Reports in a business organization are considered as the visual parameter to describe the status of the organization. Thus the reports should well educate the concerning personals upon a glance into them. Since every business organization doesn't need all the information in a report they are split up into different modes in which each can be selected upon need. Among the various visual aids of reporting Cohort view is considered as the apt one while dealing with the warehouse operations of a company. The mode of view provides the user with advantages to establish the transfers held at the inventory based on dates, months, and years.
Let it be inbound or outbound transfers which will be clearly depicted in the cohort view dashboard. Thus the user can establish the requirement of the product at its various inventories and the duration upon which the stocks are sold out and plan accordingly. Moreover the user is provided with a percentage depiction of the transfer which is being gone on. In instances such as the product is ordered and is being shipped a certain numerical percentage is depicted in the view. Whereas in the case of delivery and the order is complete the percentage indicates a hundred.
The cohort view can be seen in the inventory module of the Odoo platform. Upon selecting the inventory module from the menu select the reporting option and choose the warehouse analysis method. Scroll down the menu to view the cohort view.
Structure of Cohort View
The methodology of the cohort view is based on providing information to the next 15 days or months or years. As you see in the image just say 5th June 2020 to the right of this date you can see the count of operations to the further right it depicts the upcoming days. There is a 15-day window provided by the columns by +0,+1,.....+15 which describes the date plus the number count. Thus the user can understand the information from a selected date up to fifteen days after the selected date.
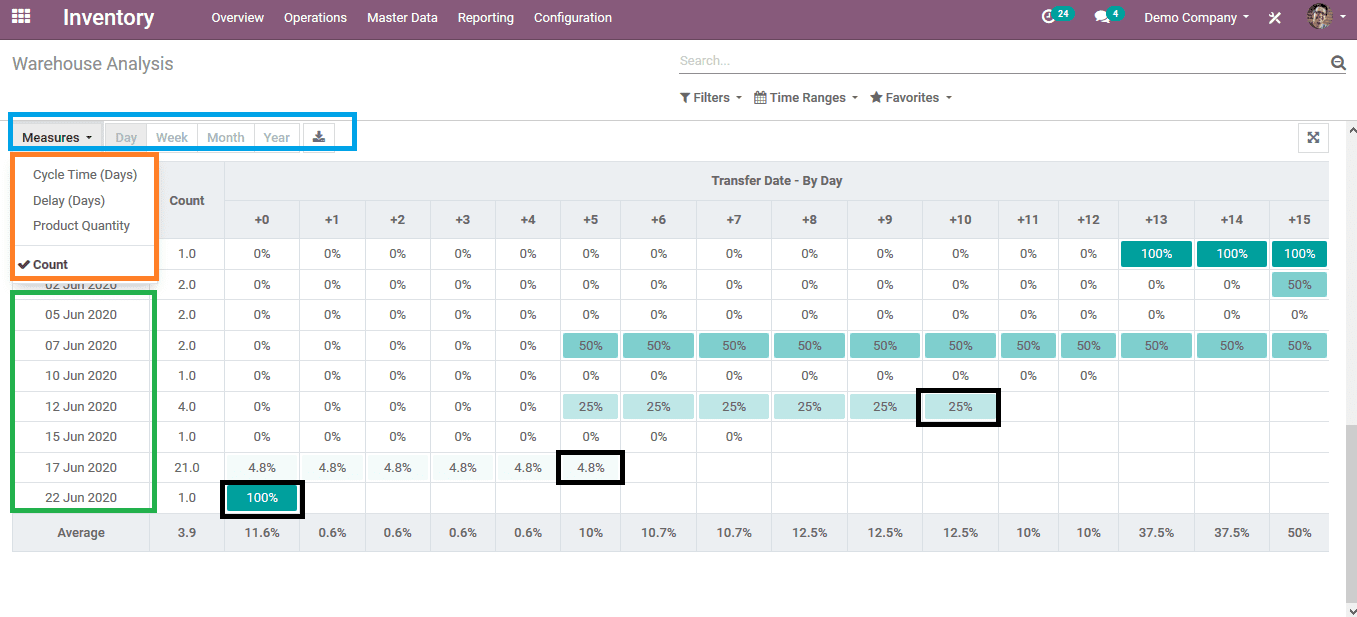
On the top left side you could view the modes to measure the different quantities such as cycle time, delay, product quantity, and count. On the left side you could see the dates of operation and the count.
The count indicates the number of transfers being done. The percentage indication in the dashboard can depict the status of completion of the transfer. The filtration can be done based on months, weeks, and dates.
The filter can scrutinize data based on transfer, deliveries, receipts, and also custom made filtration can also be done. Custom made filters can also be saved upon for future references.
To depict how the cohort view works in the inventory module let's look at an example.
Step 1: in the inventory module the user can see only two counts of transfer i.e. two products are being transferred from the inventory. The percentage indication says that 100 percent of the transfer is complete which indicates that the products ordered are being delivered.

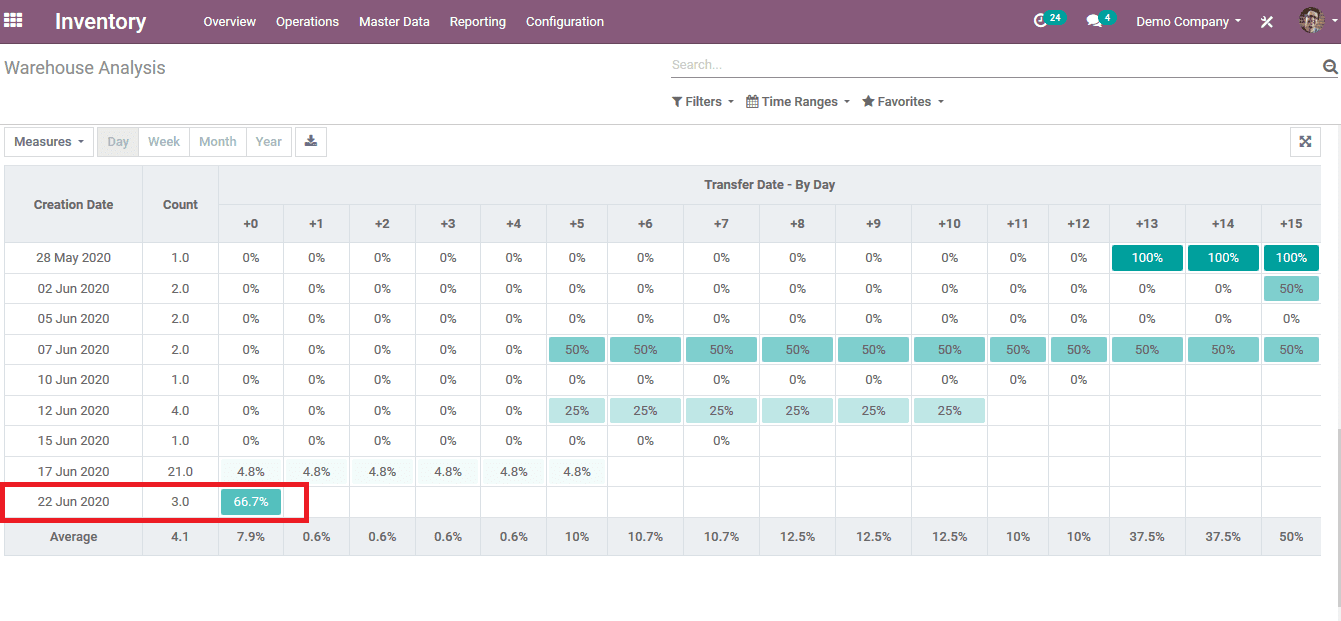
Step 2: Now a customer visits the website of the company or walks in at the point of sales and orders a product by providing the details required. The customer is waiting for the order to be shipped and delivered. While the customer weights the user of the company checks in the cohort view in the warehouse module. The view depicts that there are 3 counts on the same date i.e. three orders. By analyzing the percentage of operation the user can understand that the delivery is not complete as it depicts only 66.7%. It may be in the shipping process or the packaging section. Thus the user can understand the inventory ongoings of his/ her company.
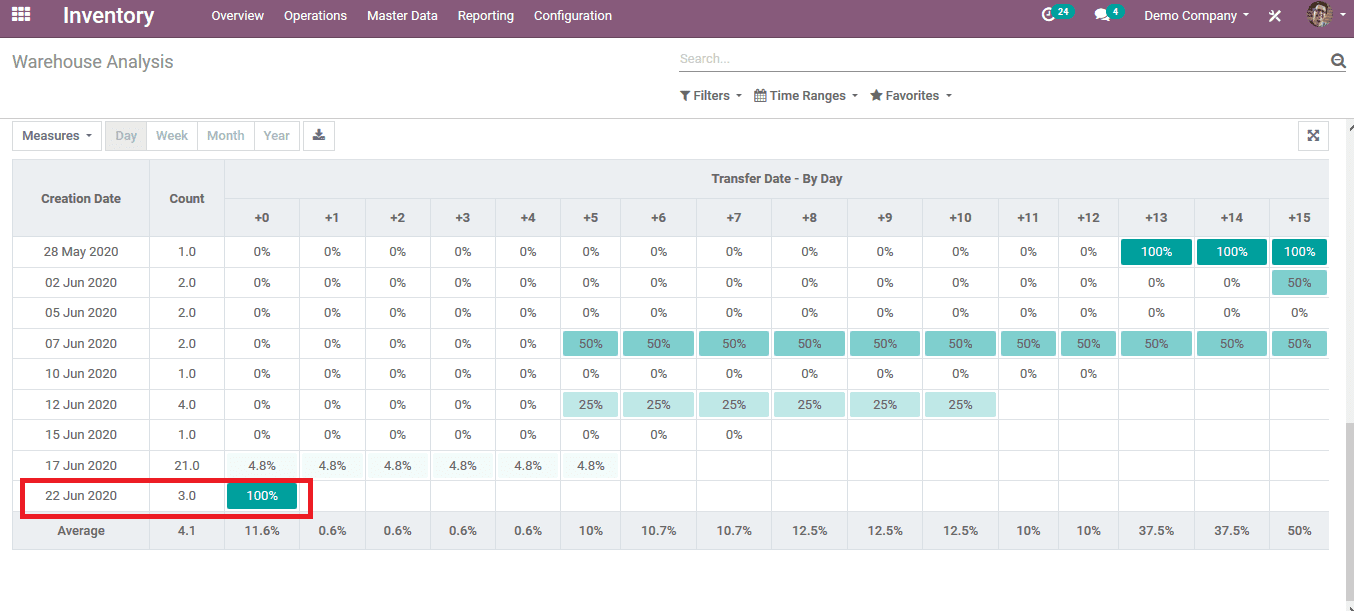
Step 3: As the customer is delivered with the order the status on the sales quotation changes to delivered to the location and the order is complete. As soon as the delivery is complete the status of the inventory section changes to 100% but the count remains the same as there have not been any new orders on that day.
As the inventory section of the company is the most looked upon to track the ongoing activities of a company the cohort view best suits the module. Also to this view the user has the provision to download data from the menu about the aspects of the inventory module and can be used for external applications. The action can be performed by selecting the download icon present next to the measure. Icon of the cohort view. The files being downloaded are in the excel format since they can be easily made to hard copies. The user can change the time period of each action being taken palace and filter accordingly. This function is much helpful for inventory management and its managers to depict the efficiency of the deliveries and how they are managed.
For more info, Read Blog: How to Create Cohort View in Odoo 13