Understanding sales and performance is important for every business to make better decisions and improve its operations. Odoo 20 provides different reporting options that help businesses analyse their sales activities from various perspectives. With Odoo 20 Sales Reports, users can review overall sales performance, track individual salesperson performance, identify popular products, and understand customer purchasing patterns.
In this blog, we will explore sales analysis in Odoo 20. The reporting tools allow users to organise data using different measures and grouping options, making it easier to compare results.
Accessing Sales Reports
Open the Sales module from the Odoo 20 dashboard. Select Reporting from the Sales dashboard as shown below.
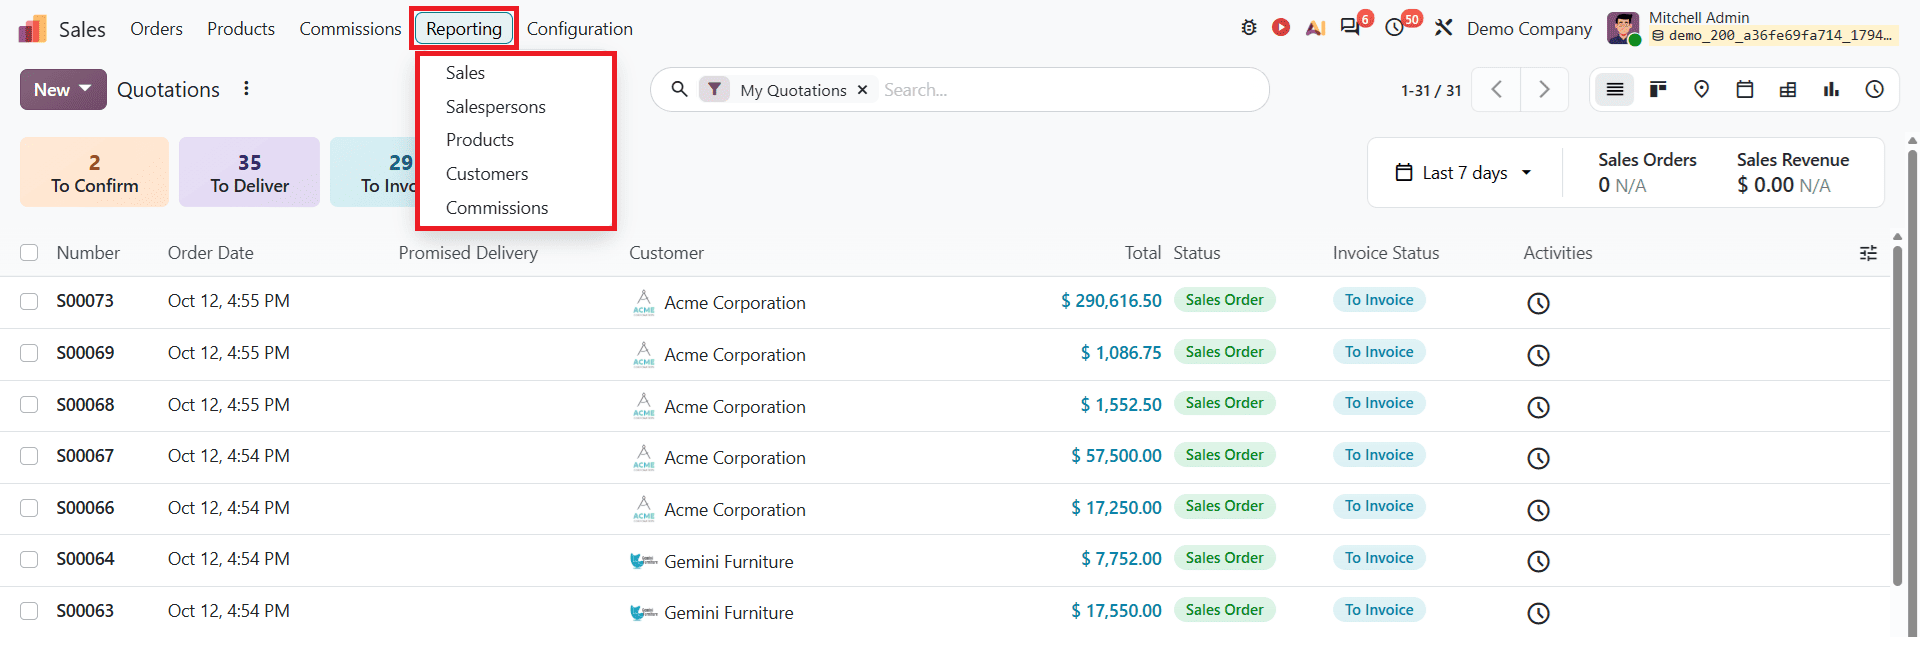
The reporting section includes Sales, Salesperson, Products, Customers, and Commissions. Each section provides different analyses of sales activities within the organisation. These features help businesses get a clear picture of their sales activities and make decisions based on the available data.
Sales
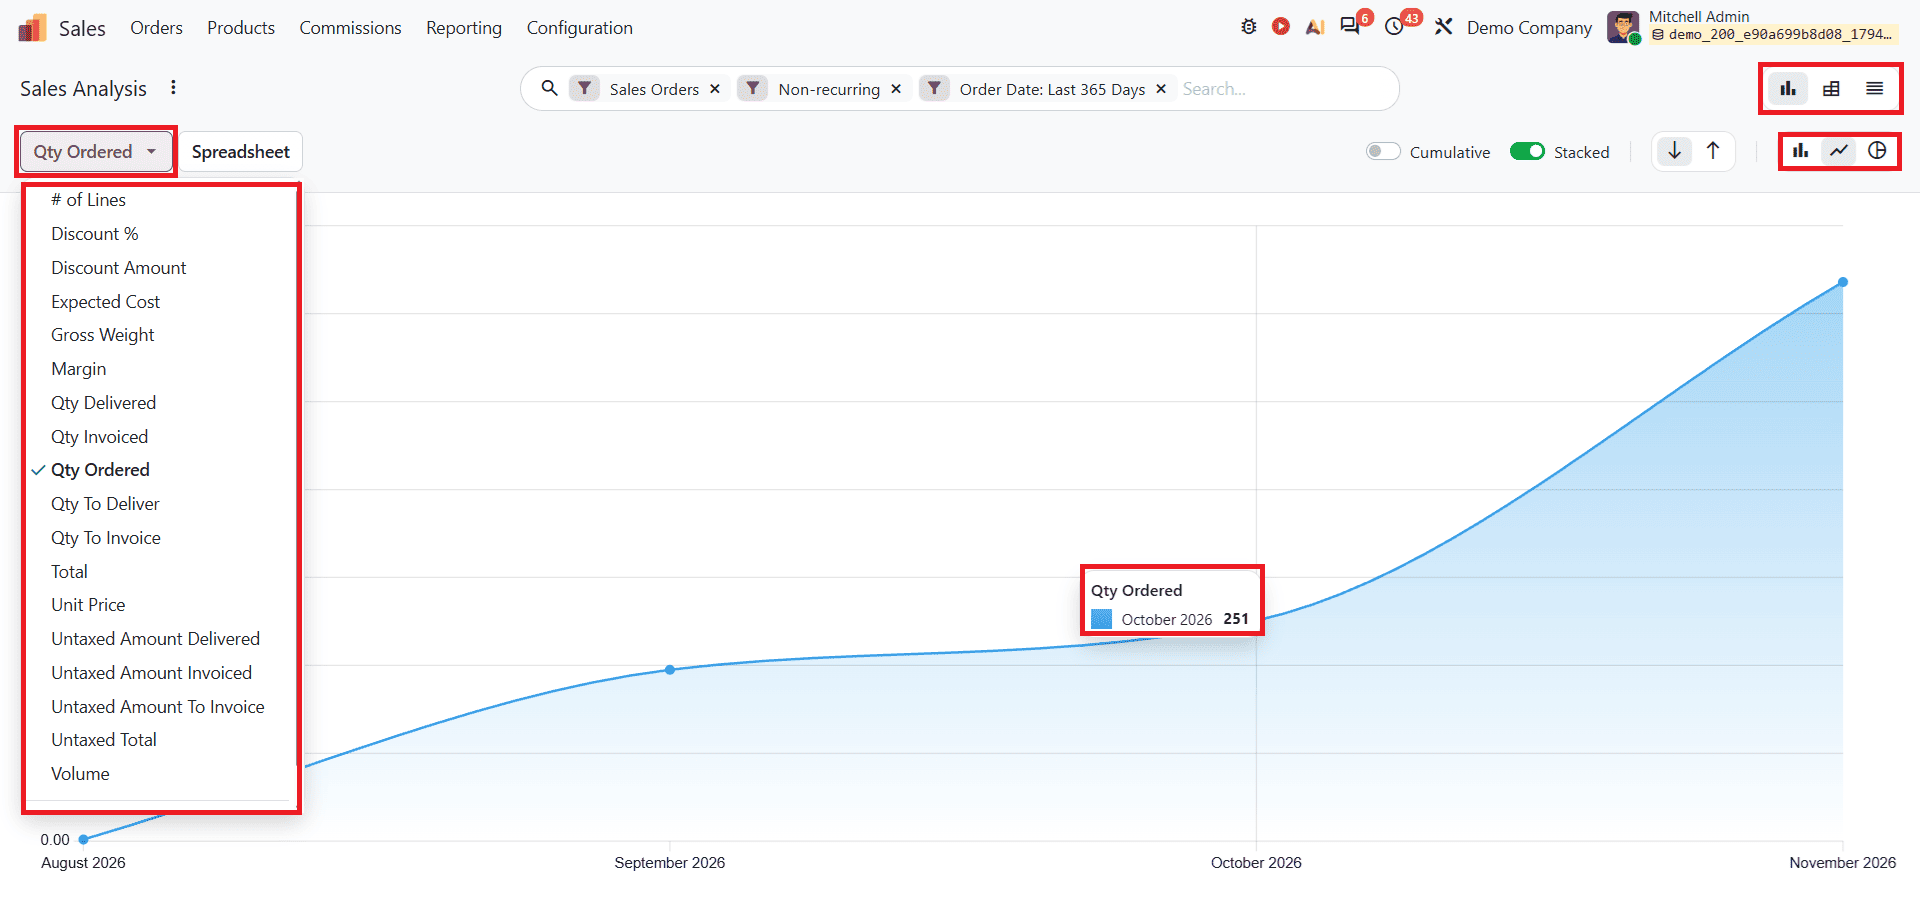
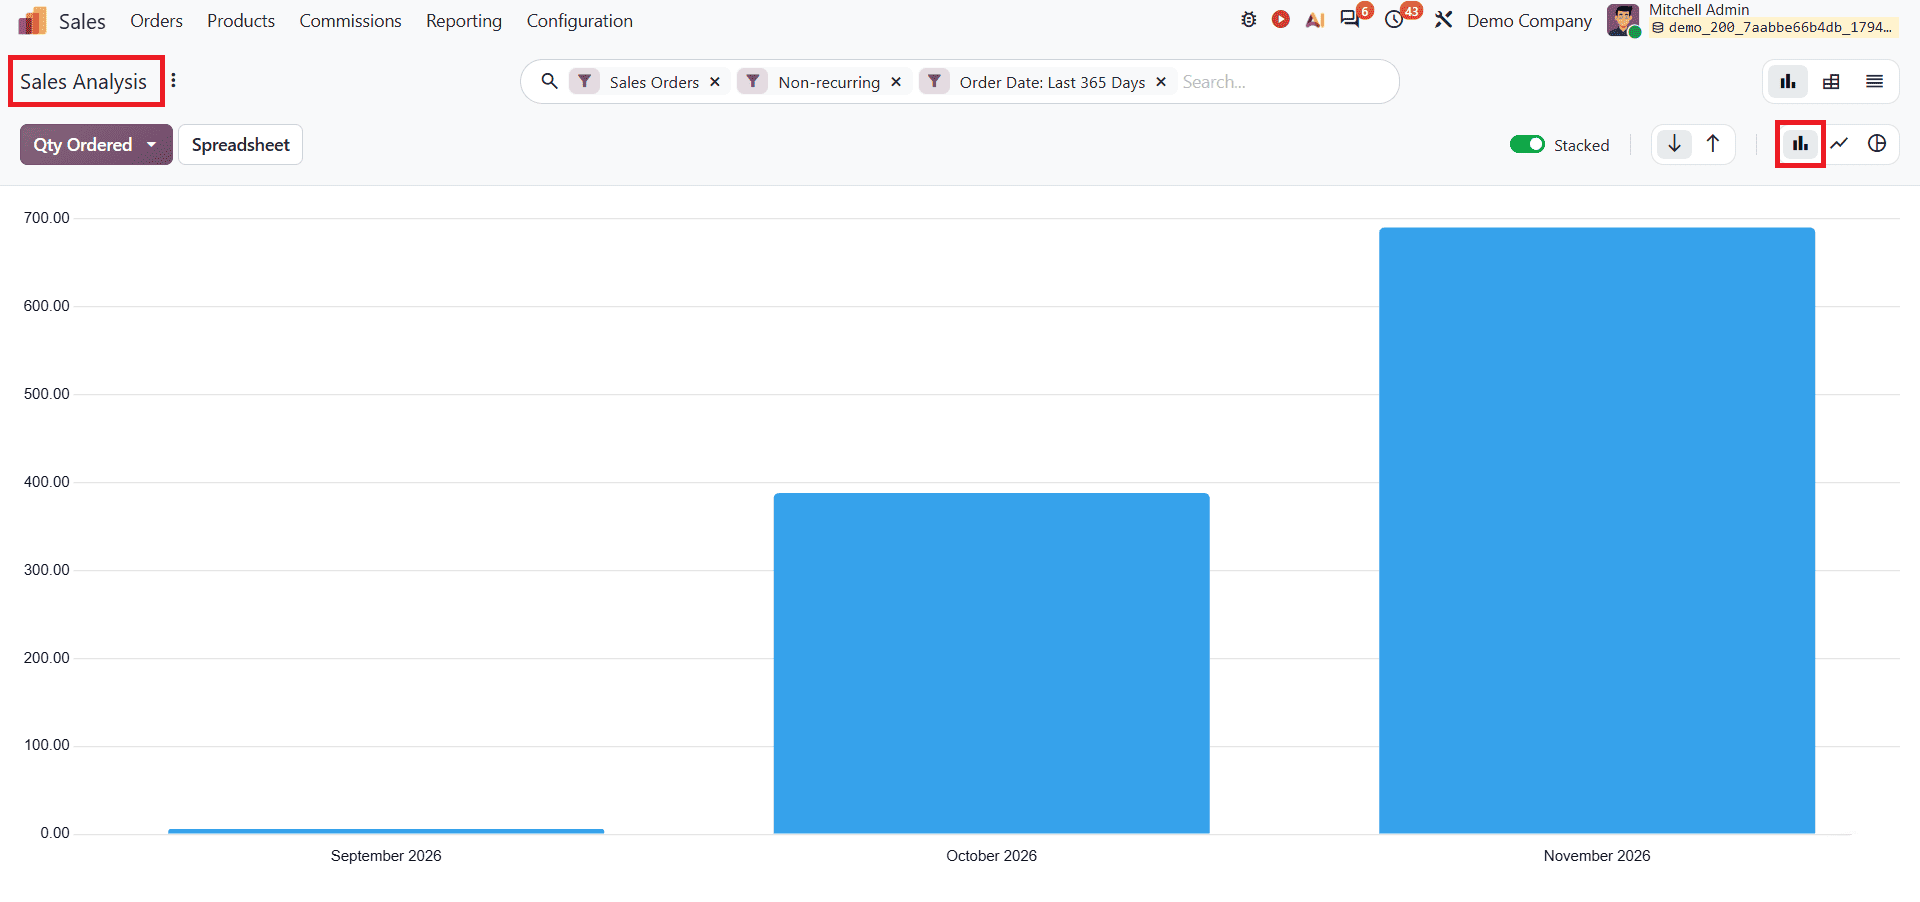
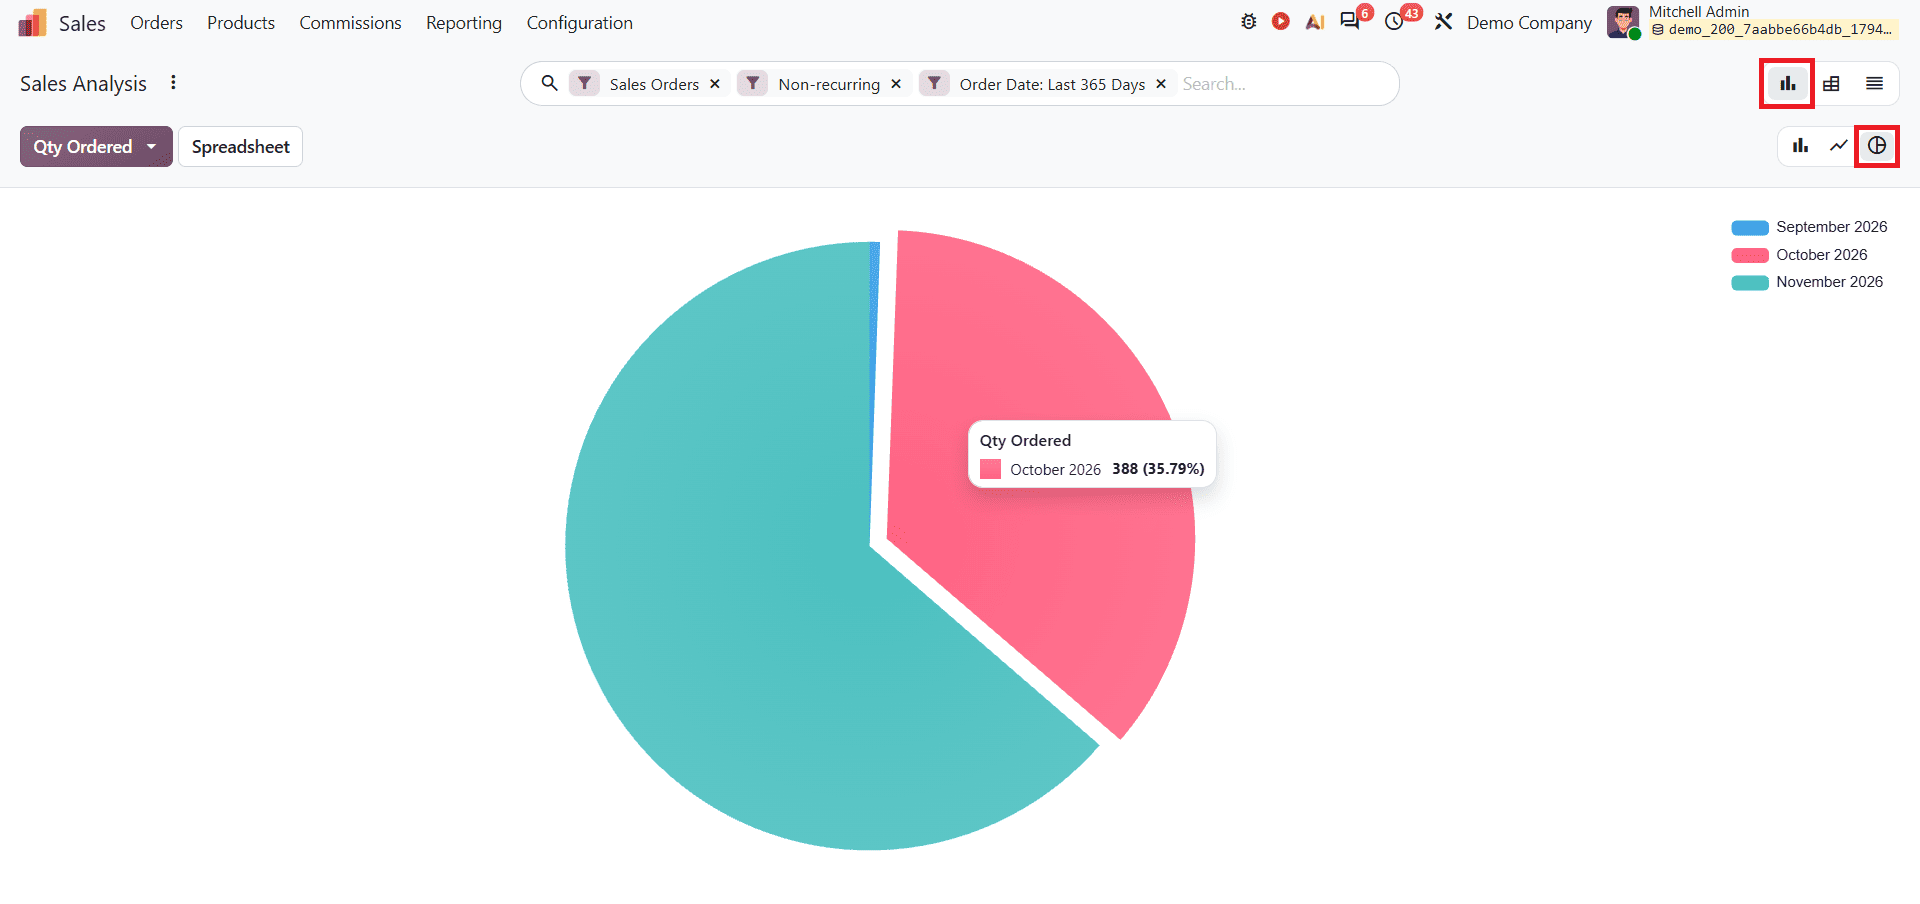
The Sales Analysis report helps businesses evaluate sales performance using different measures and categories. Select Sales from the Reporting menu. In this report, there are different types of views available, including Graph, Pivot, and List views. In the Graph view, users can select Bar Chart, Line Chart, and Pie Chart.
The Graph view helps users visualise sales data through different chart types and compare performance. It includes Line Chart, Bar Chart, and Pie Chart.
The default Line Chart is shown below.
Bar Chart from Graph view:
Pie Chart from Graph view:
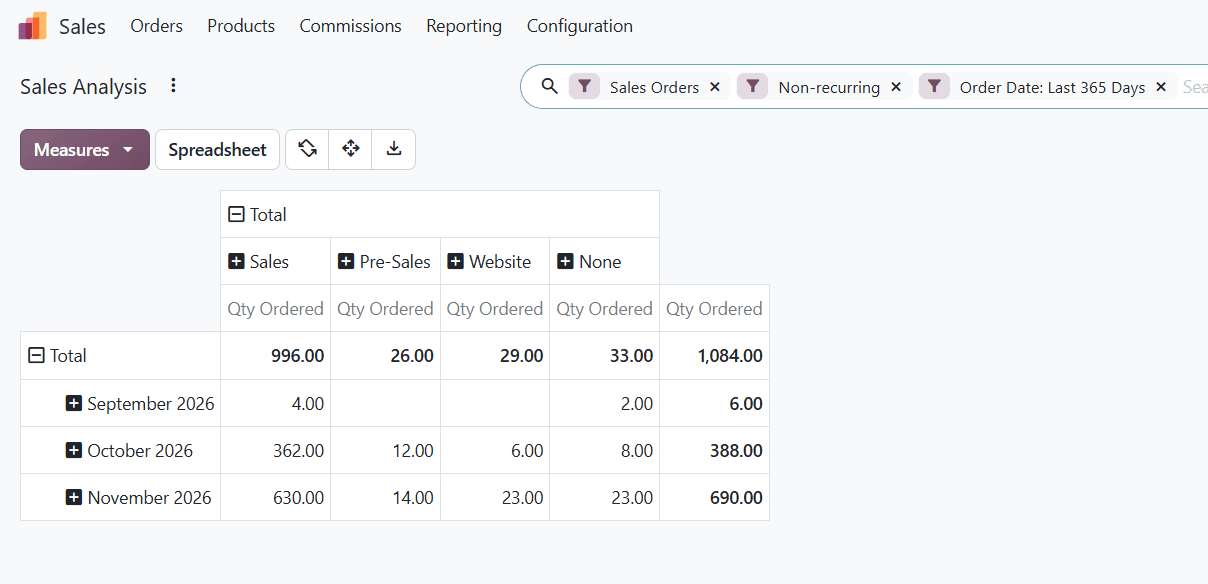
Pivot view: It helps to break down data for deeper analysis, allowing users to analyse and compare different sales data. Users can organise the report using various grouping options and measures to examine sales performance across different months.
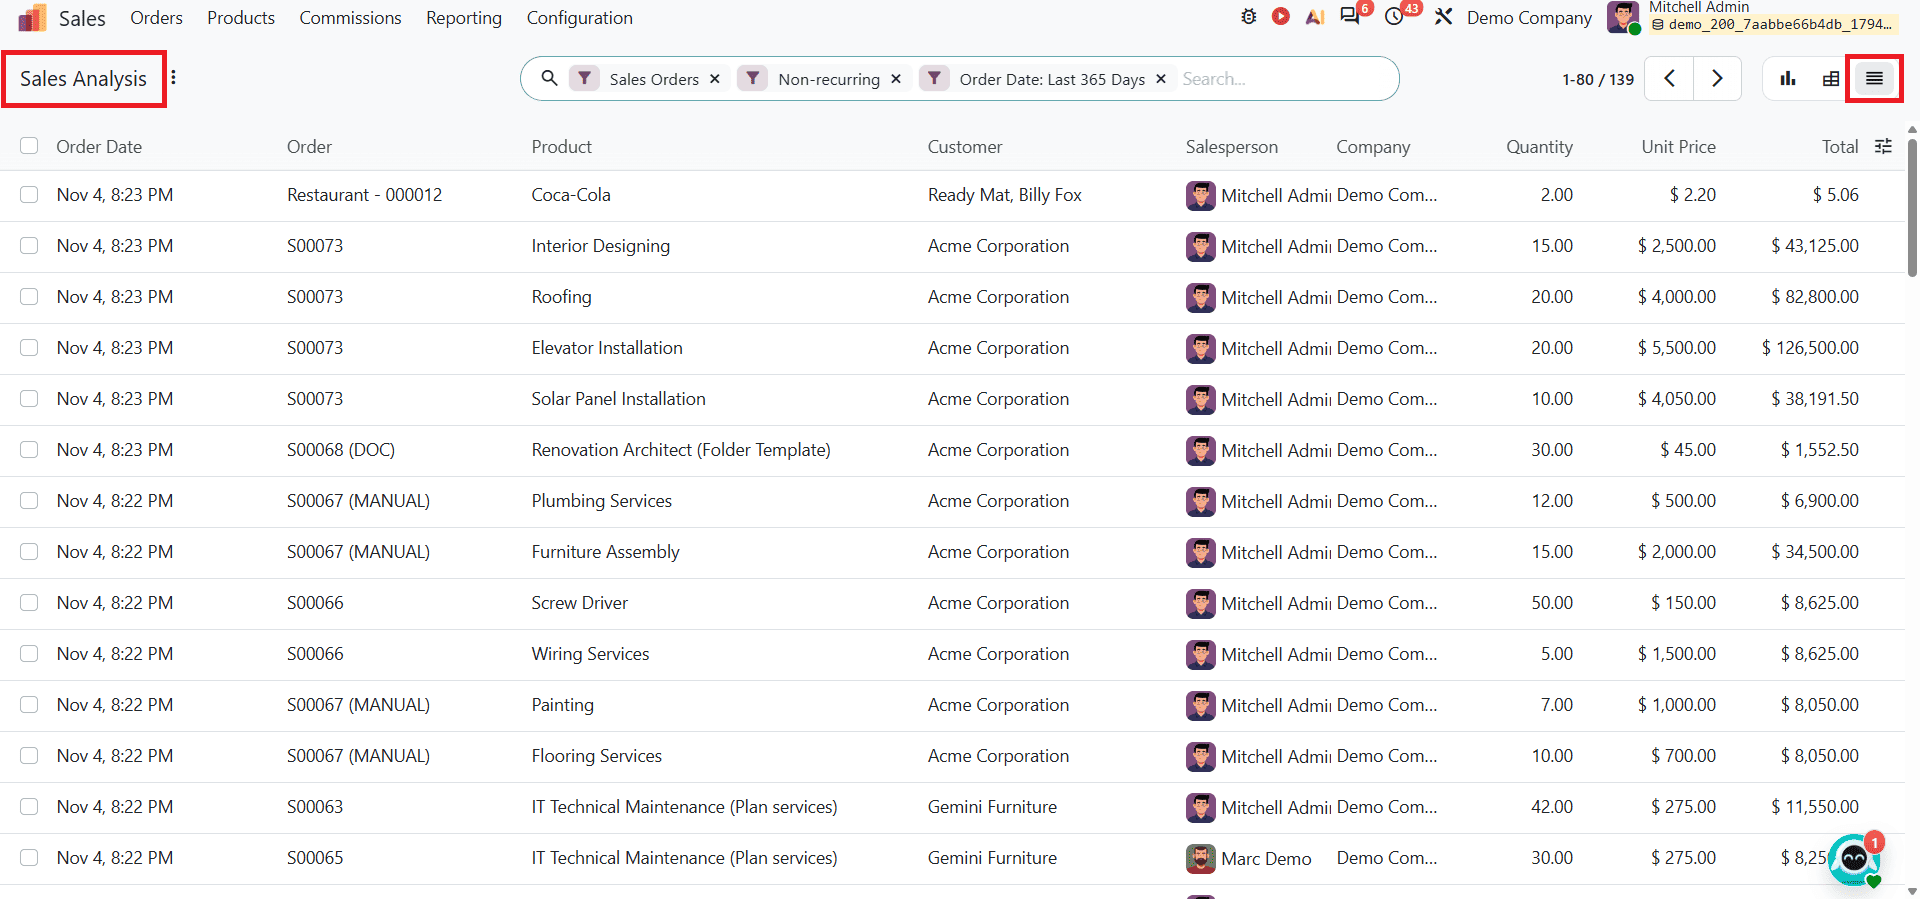
List view: It displays records, allowing you to check individual source documents directly from the report interface. This makes it easier to review individual records and their details.
Odoo 20 provides search and grouping options that help users find and organise the required information in the sales report. The search bar allows users to look for specific information, while the Group By option helps organise the available data based on selected categories. It includes Filters, Group By, and Favorites as shown below.
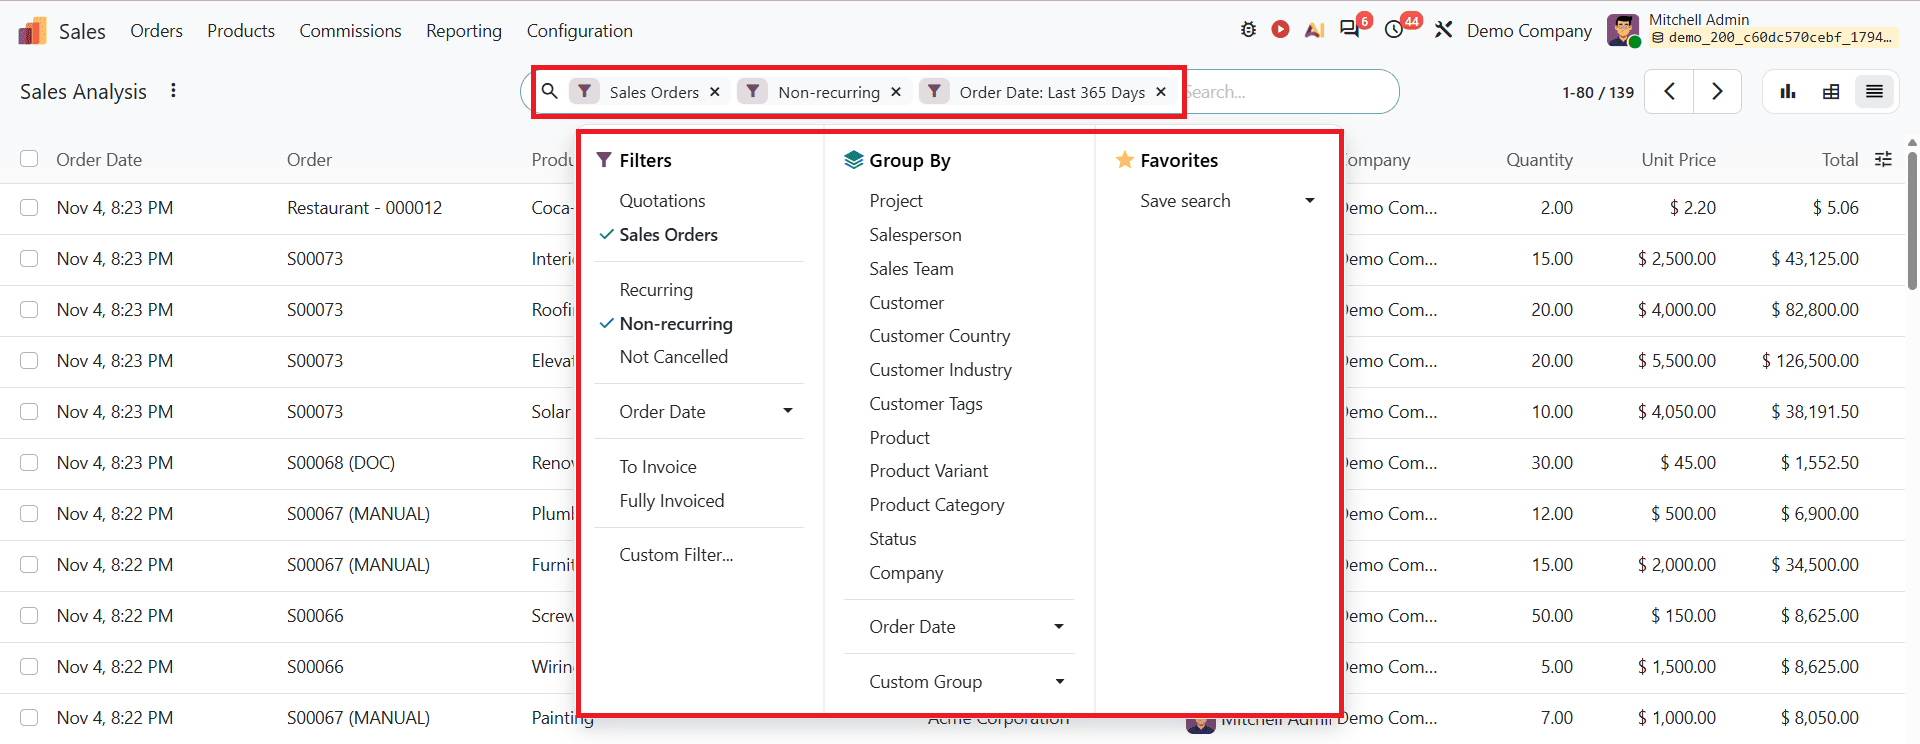
Users can apply filters to narrow down records according to their reporting requirements. These options make it easier to examine sales information from different perspectives.
Salesperson
After selecting Salesperson from the Reporting menu, the report opens in Graph view by default, as shown below.
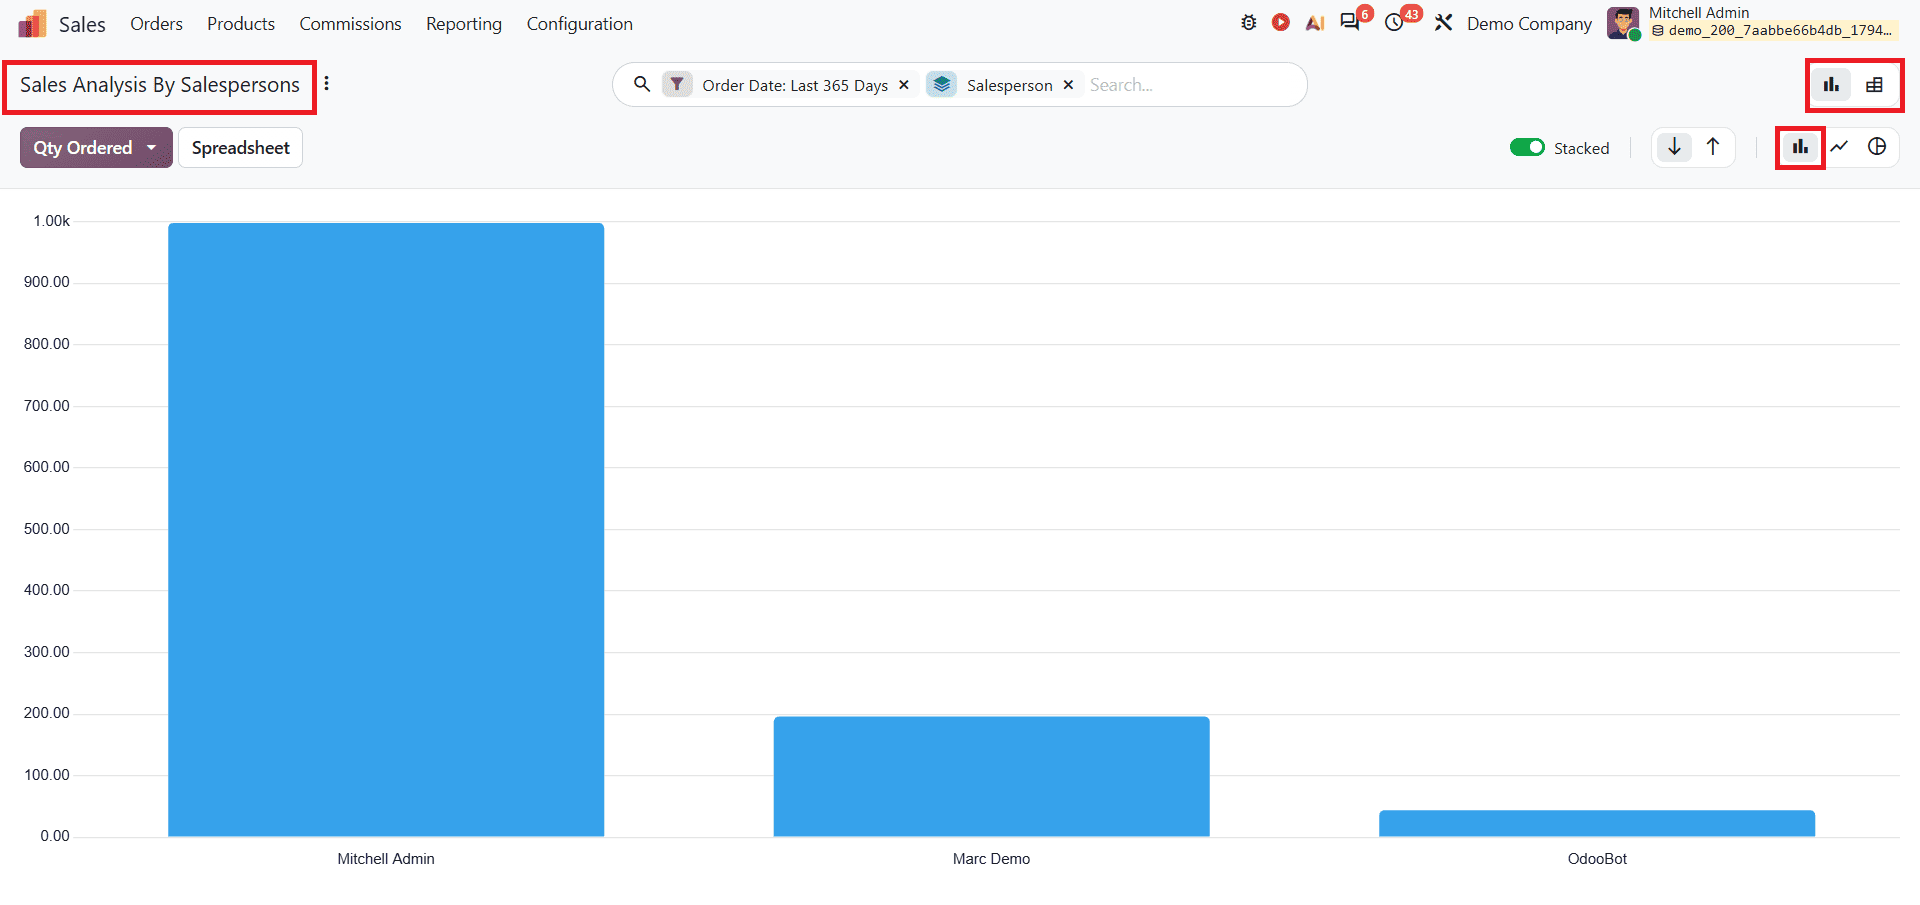
The Sales report helps businesses analyse the sales performance of individual salespersons. It allows users to compare their contributions and understand how many orders each salesperson achieved. This makes it easier to compare their sales activities and identify differences in individual performance.
The Pivot view provides a detailed analysis of sales performance and shows which sales team or channel the orders came from, such as Sales, Pre-Sales, and Website.
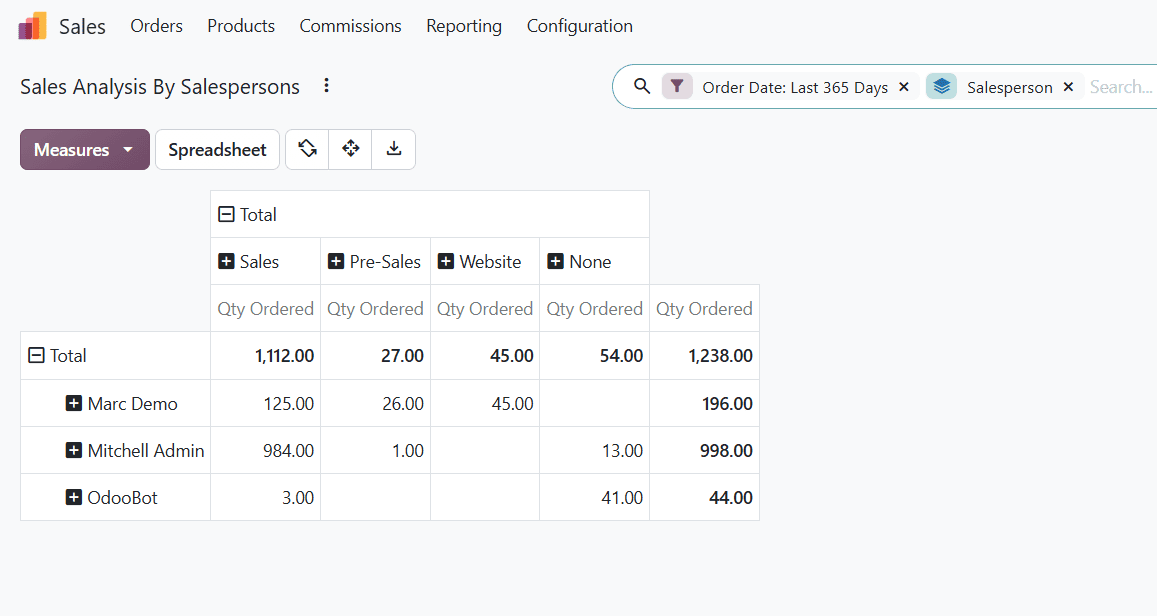
It allows users to organise and analyse salesperson-related sales data using different grouping options and measures. This helps businesses compare performance and review sales contribution in a structured format.
Products
The Product report helps businesses understand the sales performance of individual products, items, variants, and product categories. It provides an overview of product sales and helps identify which products contribute more to overall sales. The Product Report in Odoo 20 helps businesses make smarter decisions about inventory, pricing, sales channels, and forecasting by showing which products are selling best and generating the most profit.
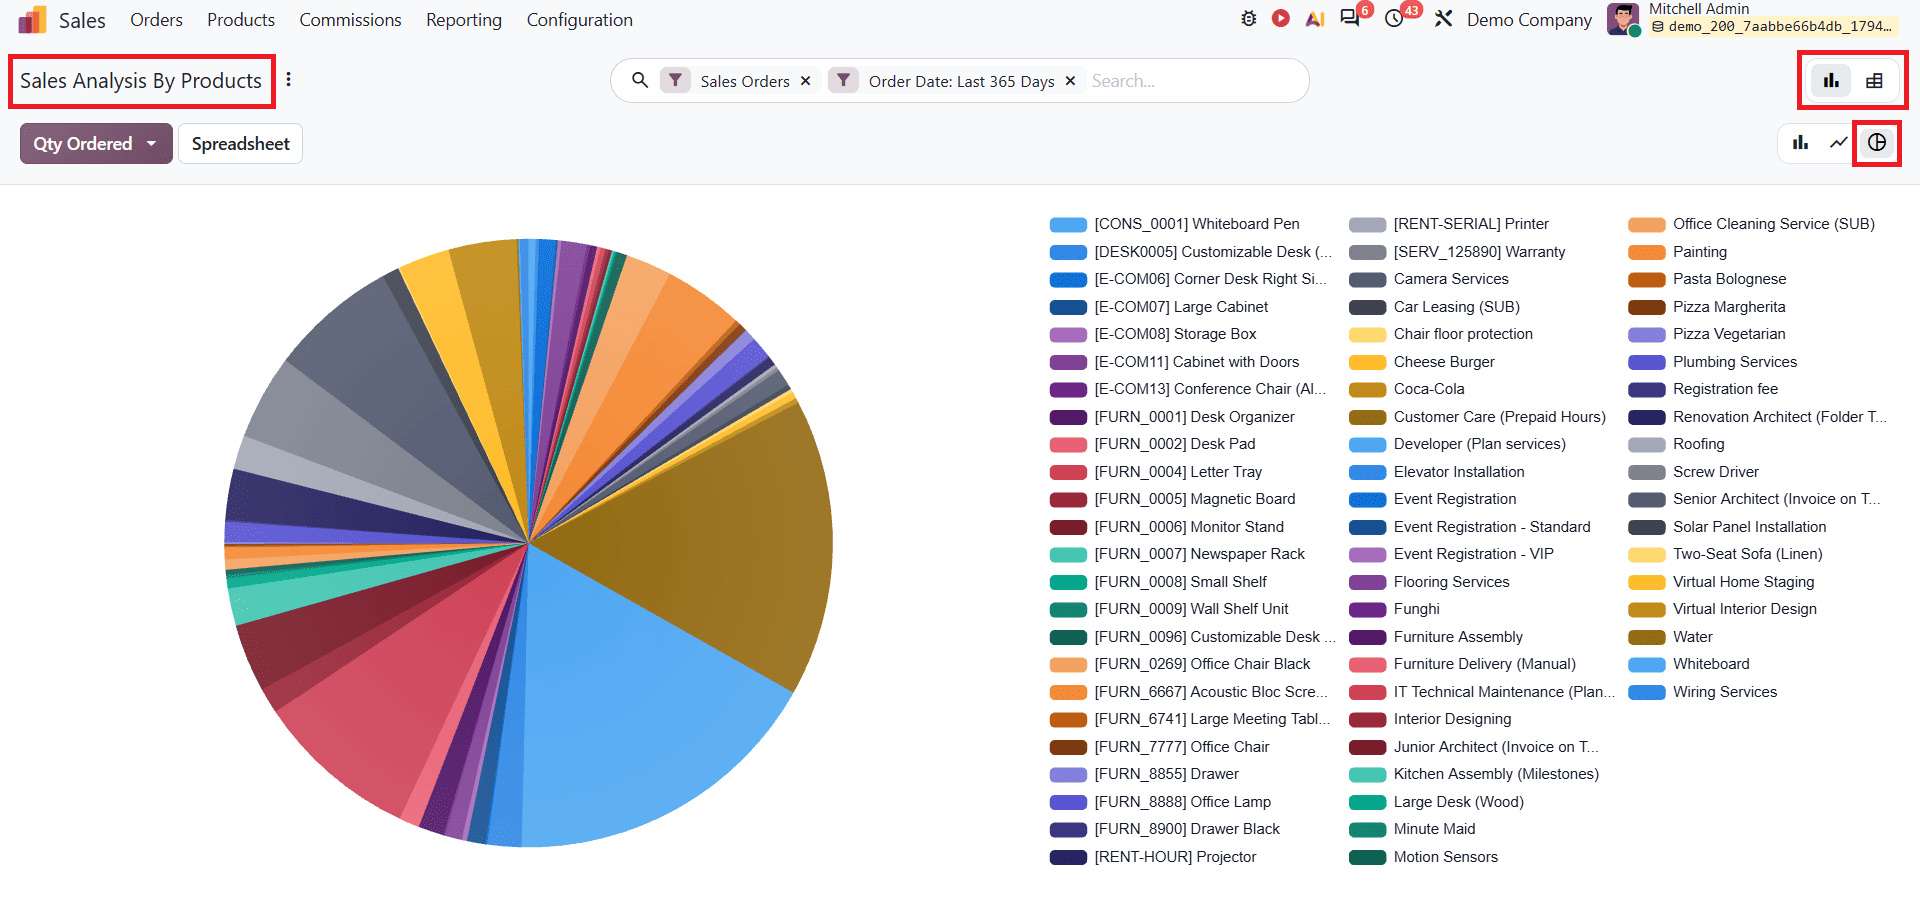
The Graph view presents product sales data visually, making it easier to compare the performance of different products. Users can use the available chart options to examine product sales from different perspectives. The default Graph view, which uses a Pie Chart, is shown below.
The Pivot view allows users to analyse sales data in a structured format. By using different measures and grouping options, users can compare product performance and review their sales distribution.
Customers
The Customer report helps businesses understand the sales performance of each customer. It is essential for account management and marketing strategies. It provides insights into customer purchasing patterns and their contribution to overall sales. By analysing this information, businesses can identify valuable customers, understand their buying trends, and improve their sales strategies.
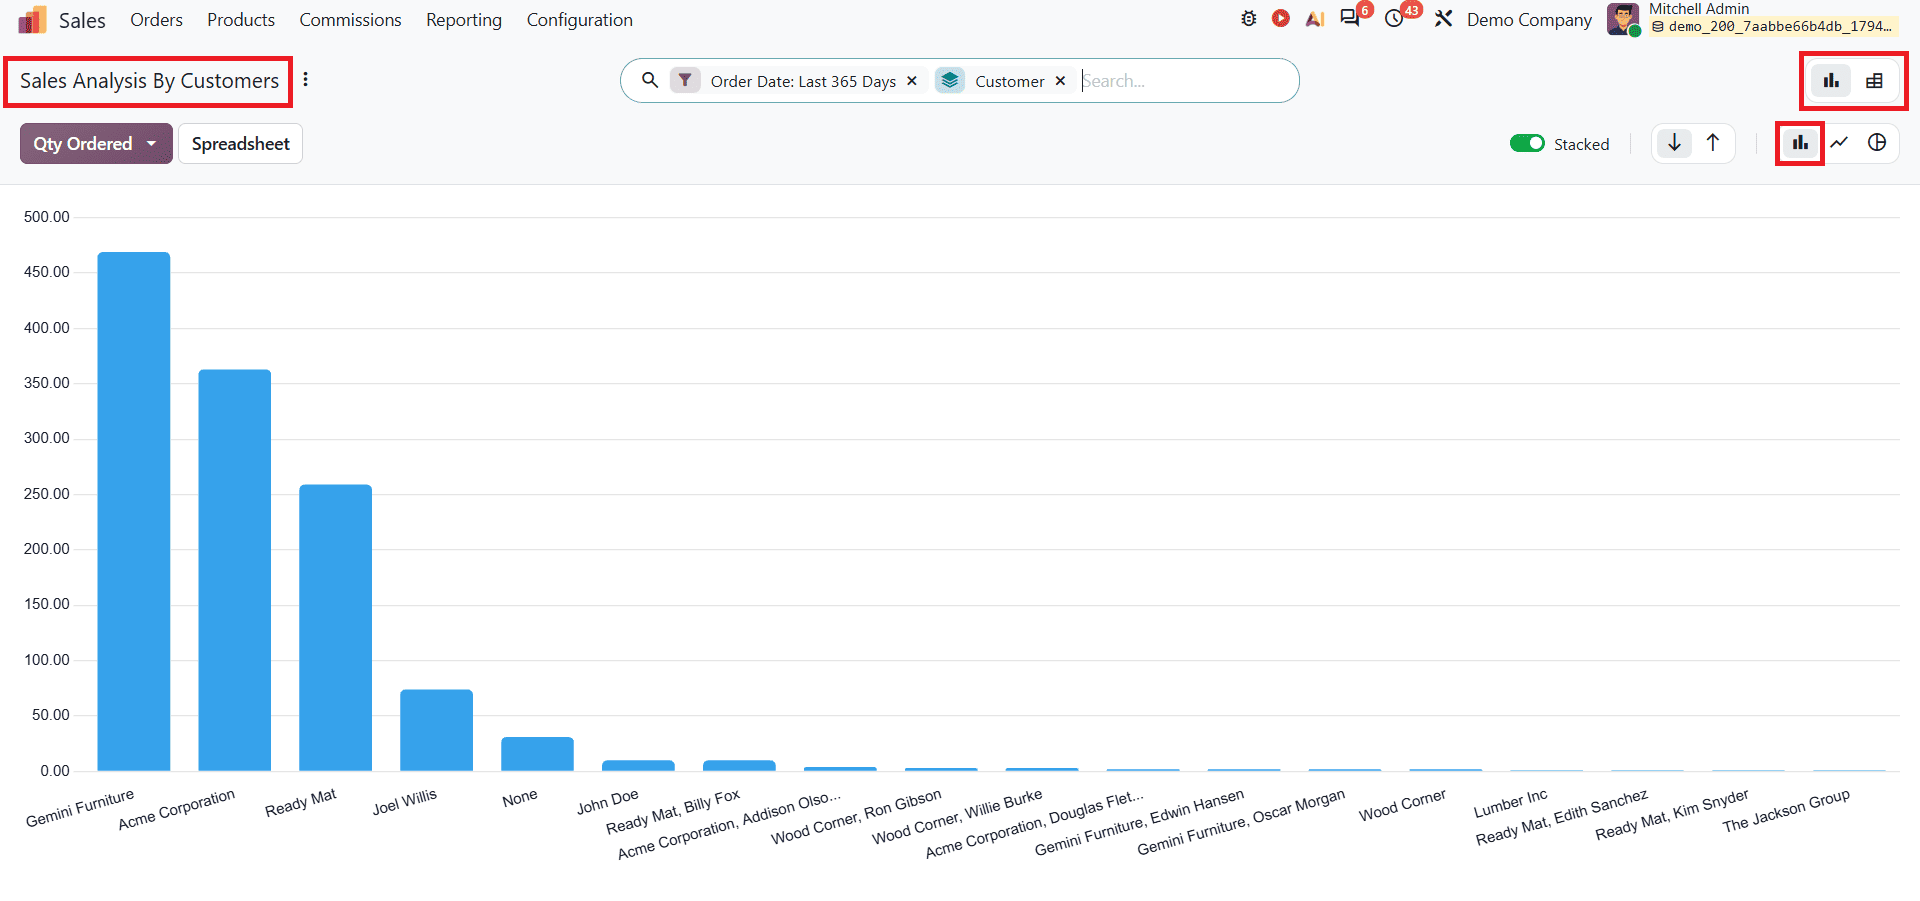
The Graph view provides a visual representation of sales data by customer contribution and purchasing activity. The graphical representation makes it easier to understand customer-related sales performance. The default Graph view, a Bar Chart, is shown below.
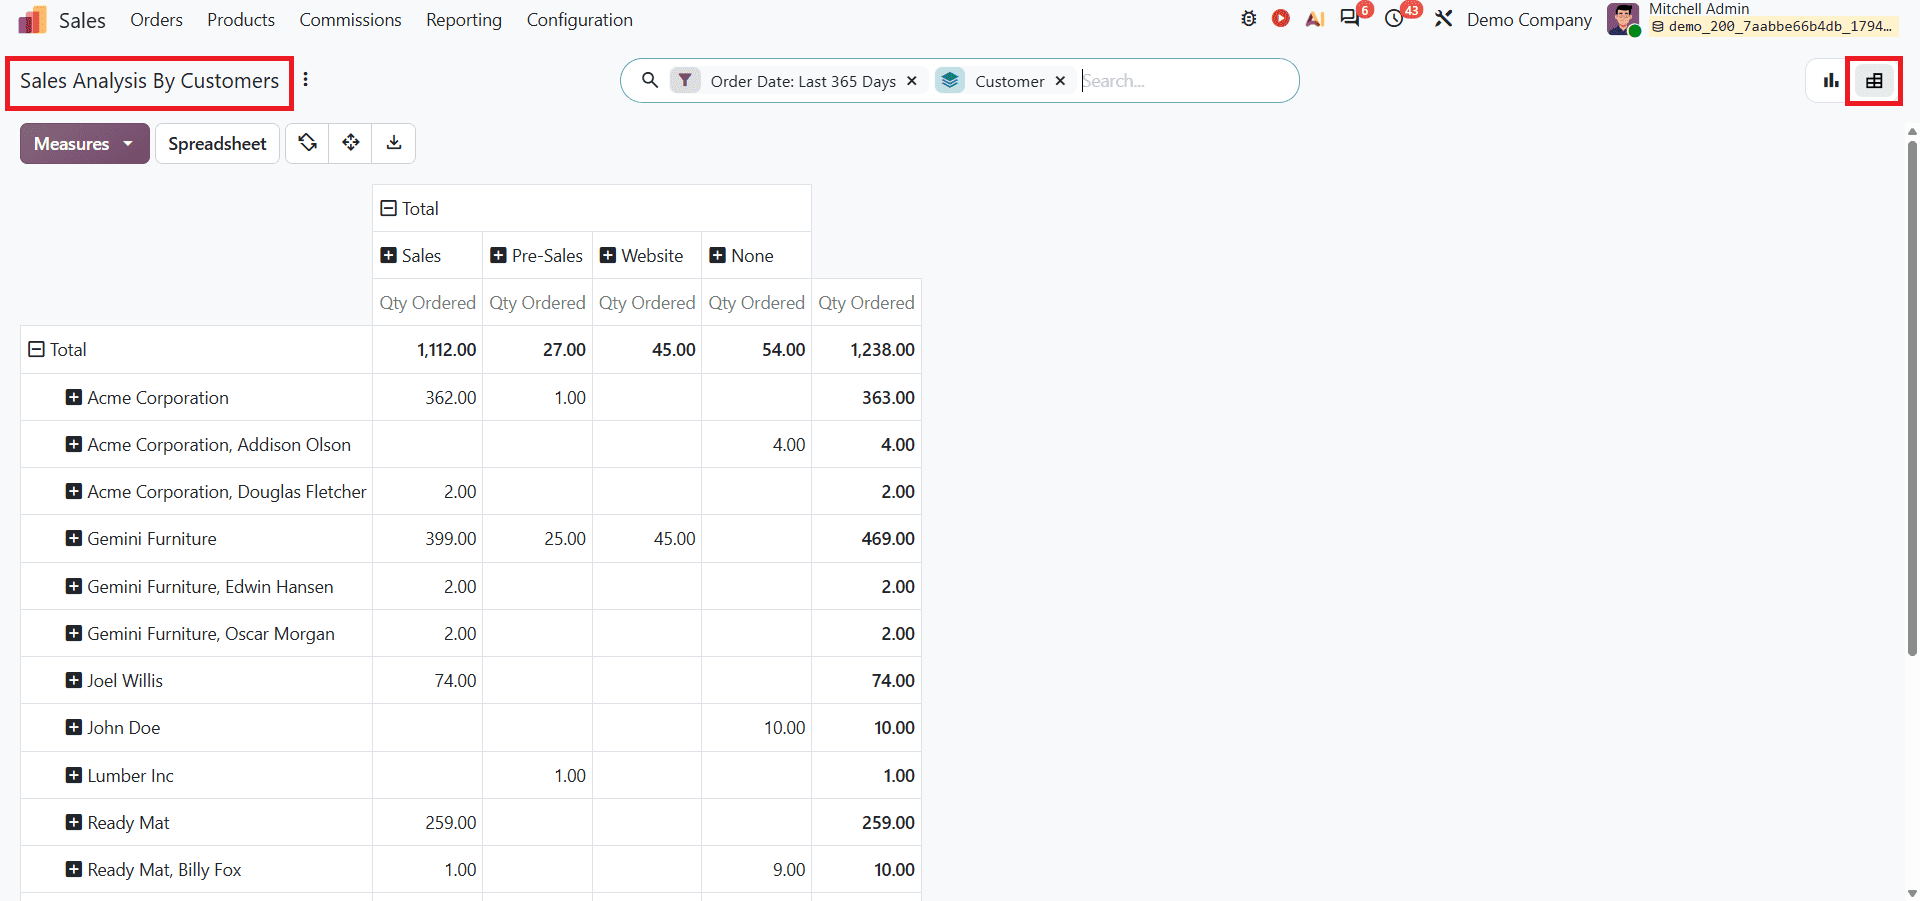
The Pivot view presents customer sales data in a structured tabular format. It allows users to organise and compare information using different measures and grouping options. This helps businesses examine customer contributions and analyse purchasing patterns in greater detail.
Commissions
The Commissions report helps businesses analyse the commissions earned by salespersons based on their performance. It provides information about commission achievements and targets, allowing users to monitor incentives and performance across individual salespersons and teams.
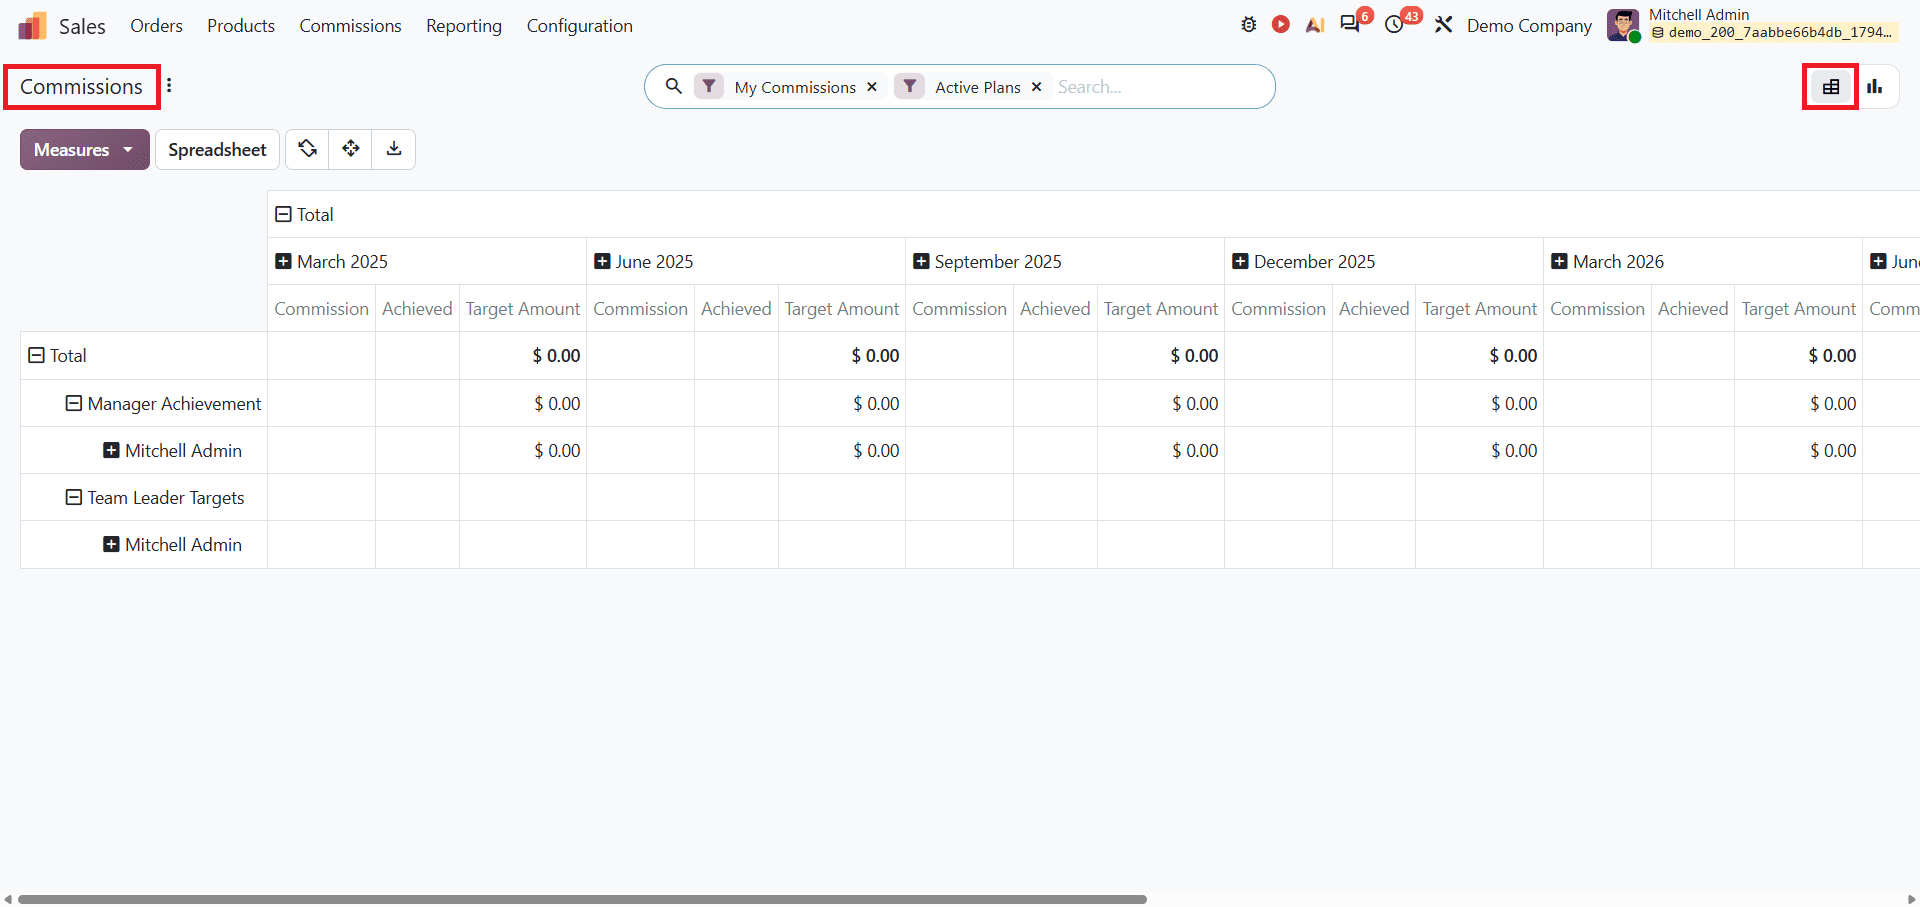
The default Pivot view presents commission-related information in a structured format. It allows users to analyse data using different measures and grouping options. This helps managers compare achievements, review targets, and analyse commission performance. The pivot view is shown below.
The Graph view provides a visual presentation of commission performance. It helps businesses understand commission trends and compare performance across different salespersons or commission plans.
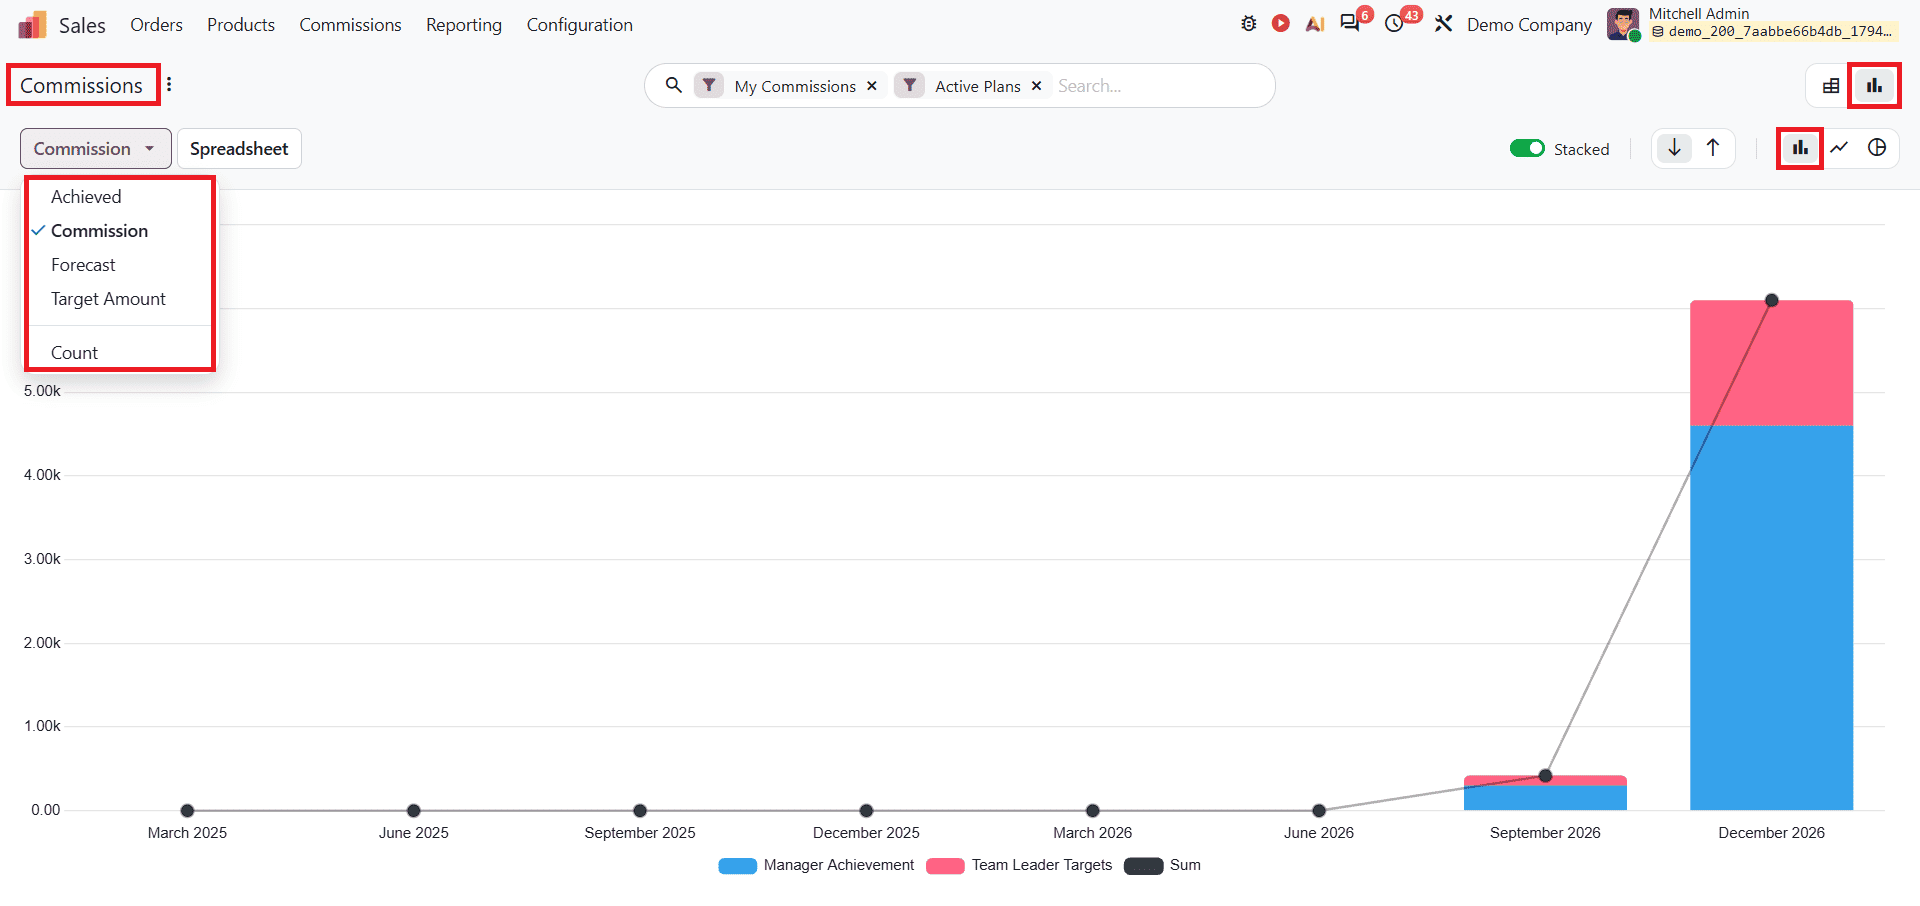
It includes measures such as Archived, Commission, Forecast, and Target Amount. Users can select different measures according to the data they want to analyse.
Inserting Sales Reports into Spreadsheet
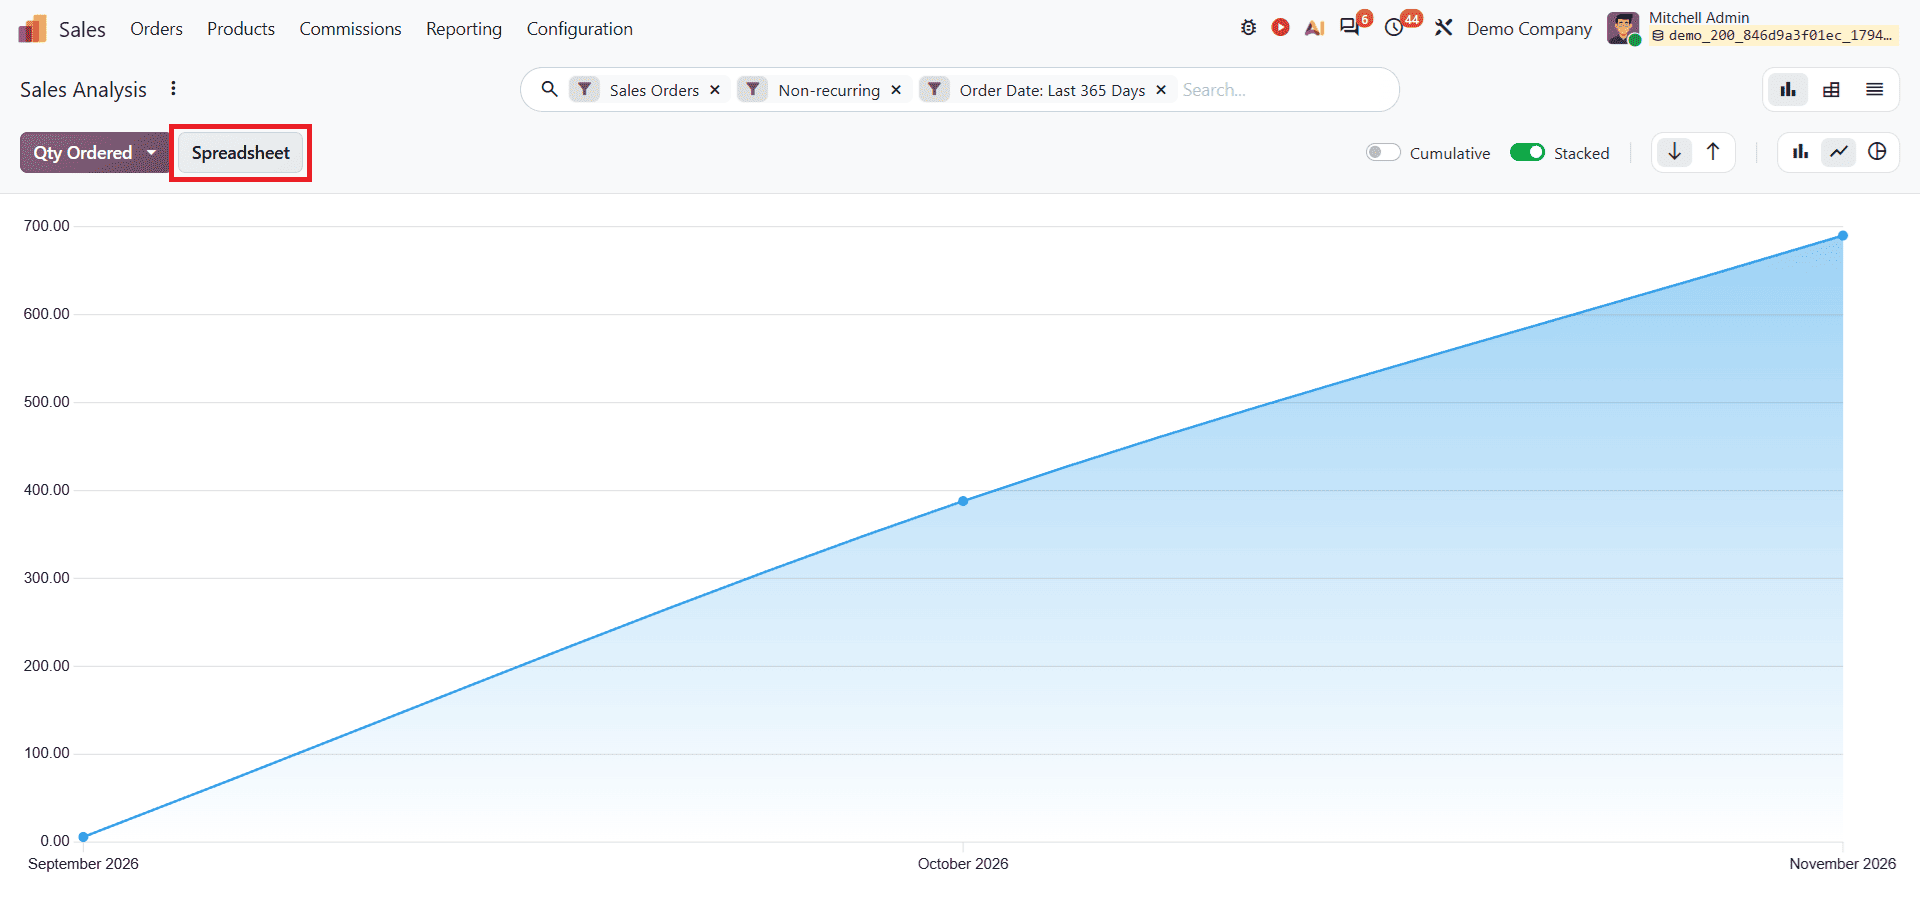
To insert reports into spreadsheets, select a report from the Reporting menu, such as Sales, open the report, and click the Spreadsheet button beside the measures as shown below.
After clicking the Spreadsheet button, a pop-up window will appear as shown below.
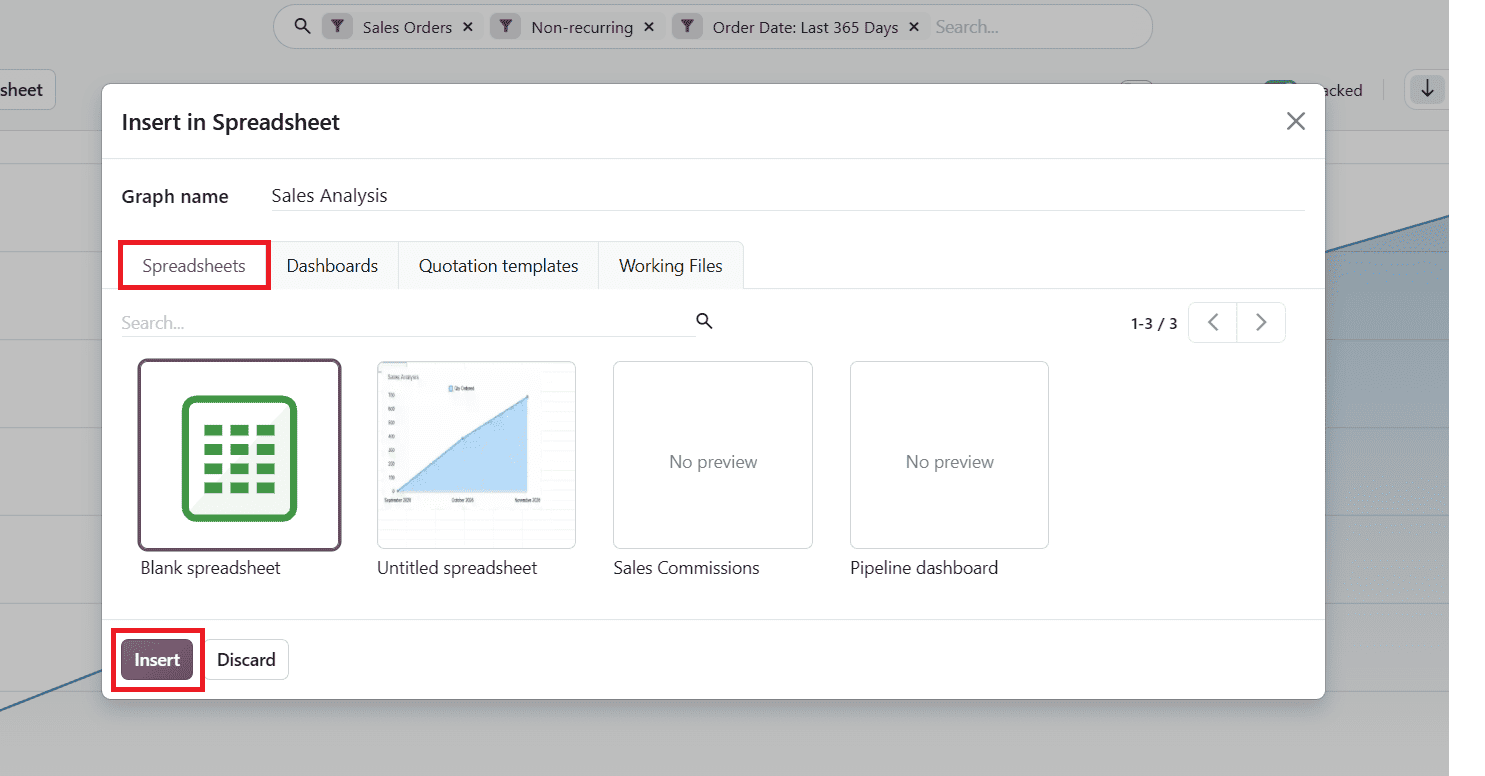
In this window, you can select the spreadsheet and click the Insert button. You can see the inserted report in spreadsheet format, as shown below.
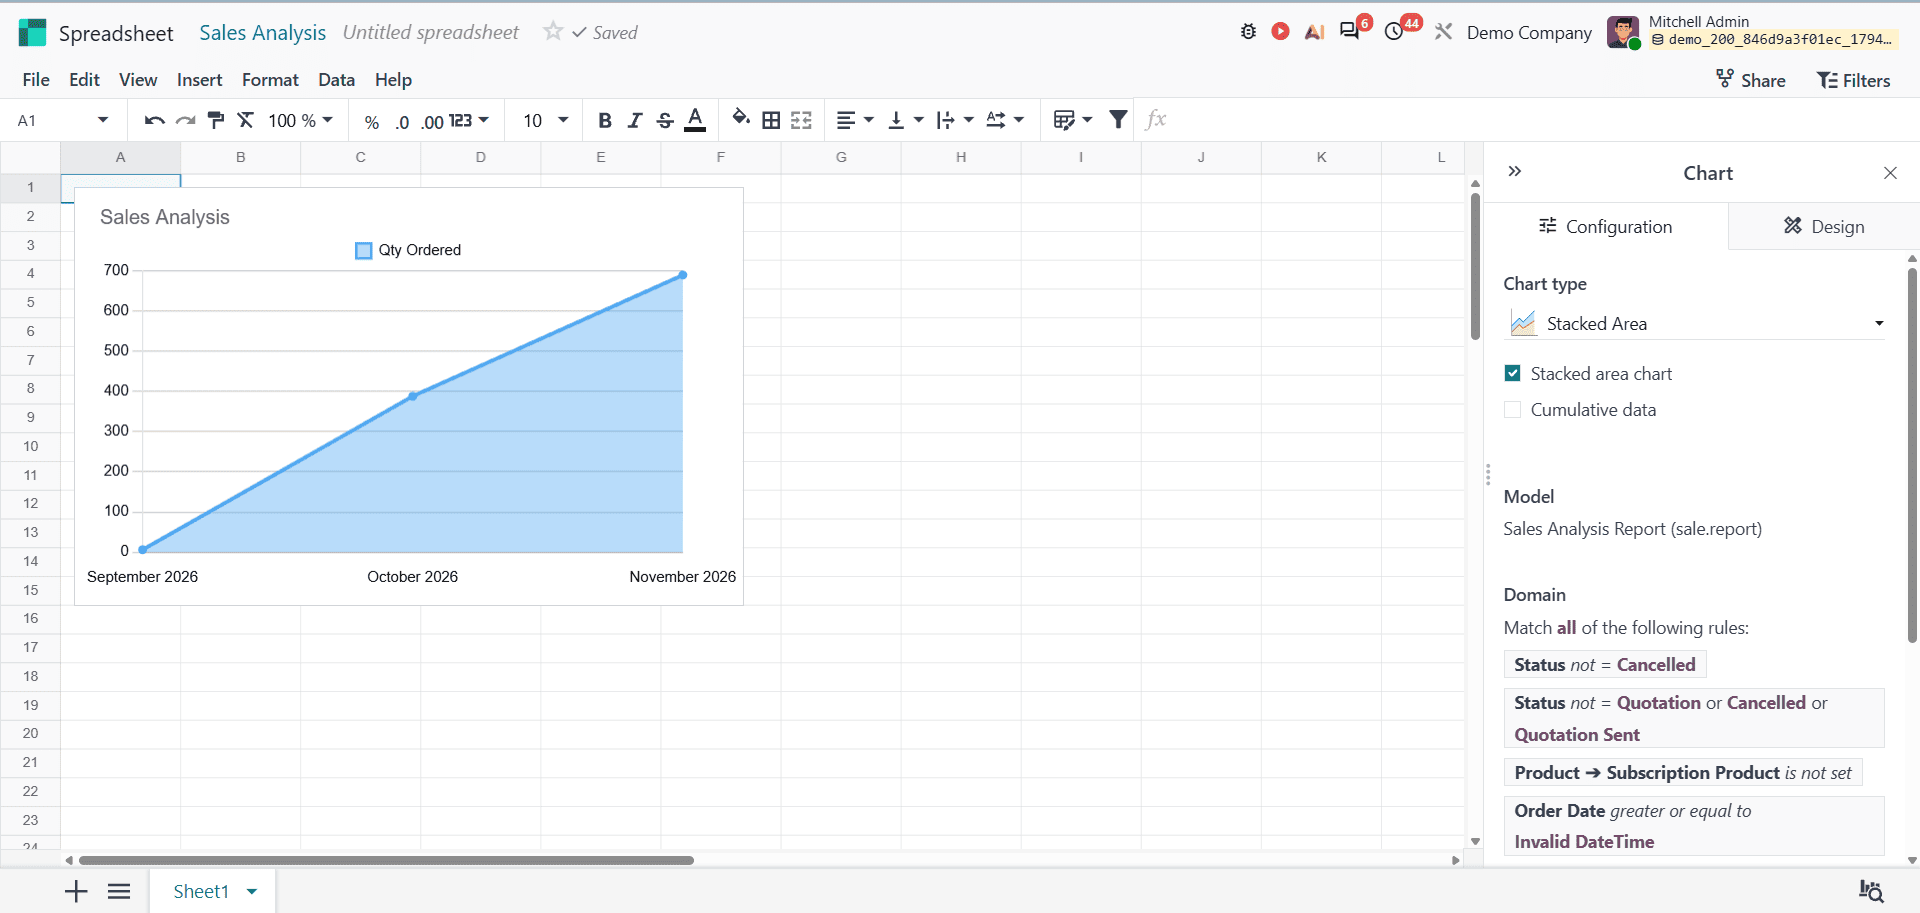
This helps organise sales information and analyse it using spreadsheet tools.
Odoo 20 Sales Reports provide businesses with different ways to analyse sales activities and evaluate performance. The Sales Analysis report gives an overview of sales activities, while the Salesperson, Products, and Customers reports provide insights into individual performance, product sales, and customer purchasing patterns. The Commissions report also helps managers monitor salesperson achievements and targets. These different reporting views, search options, filters, and grouping features make it easier to review sales data. Odoo 20 simplifies how you organise sales data, compare performance, and make better business decisions.
To read more about Everything You Need to Know About Odoo 19 Reports (With Examples), refer to our blog Everything You Need to Know About Odoo 19 Reports (With Examples).