Odoo offers a variety of view types, such as list, form, kanban, chart, and calendar, each serving a different purpose to make your data easier to understand and manage. Among these, one of the most powerful and visually intuitive is the Gantt view.
Think of the Gantt view as a horizontal bar chart that displays tasks, schedules, or activities over time. It’s an excellent tool for planning, scheduling, and tracking progress, whether you’re managing projects, production timelines, or employee schedules.
It’s worth noting that the Gantt view is available only in the Enterprise edition of Odoo, as it relies on the web_gantt module, which is not part of the Community version. You can enable it by installing the module from the Apps menu in your Enterprise database.
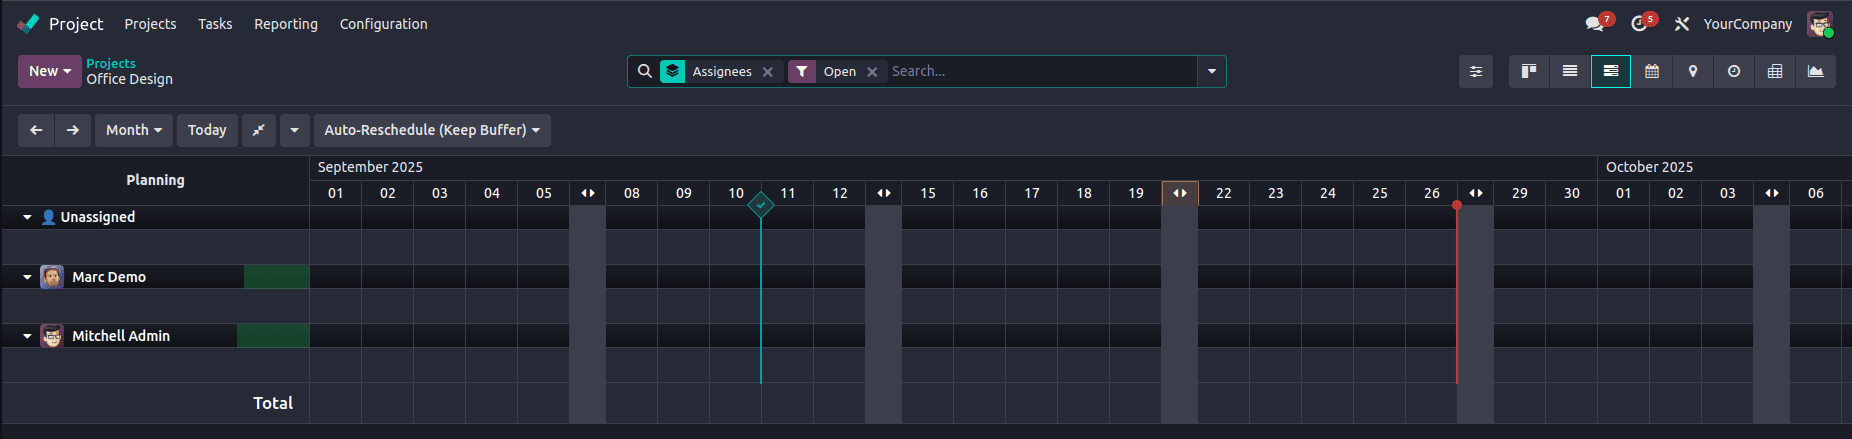
In modules like Project, the Gantt view gives a clear picture of who is working on what and when—across days, weeks, or months—making it much easier to manage tasks and deadlines efficiently.
Key Features of the Gantt View in Odoo
The Gantt view isn’t just about pretty charts: it’s a practical, interactive way to manage timelines. Some of its most useful features include:
- Adjust Scheduling Instantly: Drag and drop tasks to change their start and end dates directly on the timeline.
- Organized Display with Filters and Groups: Group tasks by project, employee, or department for a cleaner overview.
- Multiple Time Frames: Switch between day, week, month, or year views to see both the big picture and finer details.
- Track Progress Visually: See how much of each task has been completed through progress indicators.
- Custom Colors: Use color codes to highlight priorities, task types, or responsible teams for quick identification.
Together, these features make the Gantt view an excellent choice for improving visibility, optimizing resource allocation, and keeping projects on track.
Configuring a Gantt View in Odoo
To set up a Gantt view, Odoo provides several attributes that let you control how data appears and behaves:
- string – The title or label of the view.
- date_start / date_stop – Define which fields represent the start and end dates of each task.
- default_group_by – Automatically group records by a specific field (like project or employee).
- progress – Displays completion percentage directly on the bar.
- default_scale – Sets the default timeline scale (day, week, month).
- scales – Lets users switch between different timeline scales.
- precision – Controls how detailed the intervals appear (e.g., hours, minutes).
- color – Assigns colors based on specific fields or conditions.
By using these attributes, you can tailor your Gantt view to fit your team’s exact needs, making it both powerful and user-friendly.
Building a Simple Gantt View
Let’s walk through a simple example.
1. Define the Model
Start by creating a basic model that includes fields for start and end dates, as well as a reference to a related record (like a partner).
# -*- coding: utf-8 -*-
from odoo import fields, models

class SimpleGantt(models.Model):
  _name = 'simple.gantt'
  _rec_name = 'partner_id'

  partner_id = fields.Many2one('res.partner')
  start_date = fields.Date(string='Start Date')
  end_date = fields.Date(string='End Date')
In this example:
- start_date marks when a task begins.
- end_date defines when it ends.
- partner_id links the task to a customer (or any related record).
You can easily expand this model with more fields, such as project, employee, or task type, depending on your use case.
2. Define the Gantt View in XML
Next, create an XML file for your view. The structure is similar to form or list views, but here you’ll use the <gantt> tag.
<?xml version="1.0" encoding="UTF-8" ?>
<odoo>
  <record id="simple_gantt_view_gantt" model="ir.ui.view">
      <field name="name">simple.gantt.view.gantt</field>
      <field name="model">simple.gantt</field>
      <field name="arch" type="xml">
          <gantt date_start="start_date" date_stop="end_date"
                 default_group_by="partner_id" string="Customers">
              <field name="partner_id"/>
              <field name="start_date"/>
              <field name="end_date"/>
          </gantt>
      </field>
  </record>
<record id="action_view_simple_gantt" model="ir.actions.act_window">
      <field name="name">Gantt Partners</field>
      <field name="type">ir.actions.act_window</field>
      <field name="res_model">simple.gantt</field>
      <field name="view_mode">list,form,gantt</field>
  </record>
  <menuitem id="menu_view_simple_gantt"
            name="Simple Gantt"
            action="action_view_simple_gantt"/>
</odoo>
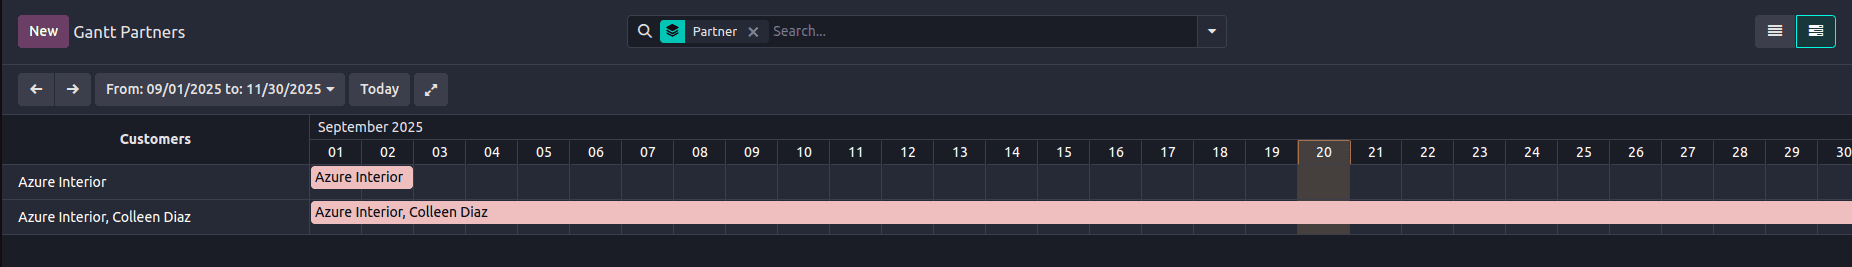
This XML definition adds a Gantt view where tasks are grouped by customer and displayed based on their start and end dates.
The action ensures that users can switch between list, form, and Gantt views within the same menu.
Once configured, the Gantt view becomes a dynamic workspace—users can create new records with the “New” button, drag to adjust durations, and view data across different timescales.
Color coding also helps distinguish between various types of tasks or resources at a glance.
The Gantt view in Odoo 19 is more than just a visual scheduling tool—it’s an intelligent planning interface that helps teams stay organized and efficient.
By combining flexibility, clarity, and real-time interaction, it transforms the way you manage timelines and resources.
Whether you’re coordinating projects, assigning workloads, or tracking milestones, using the Gantt view effectively can bring structure and insight to your day-to-day operations—helping your business work smarter, not harder.
To read more about How to Create Gantt View in Odoo 18, refer to our blog How to Create Gantt View in Odoo 18.