Debugging plays an essential role in the daily workflow of an Odoo developer. It involves analyzing errors, investigating unexpected outcomes, and pinpointing the exact source of a problem, whether it’s in the code, configuration, or data. Having a structured debugging strategy not only reduces development time but also helps keep the system stable and functioning correctly.
Tools such as developer mode, improved logging in Python, browser dev tools, and database analysis features give developers more visibility into what’s happening behind the scenes. By leveraging these resources effectively, issues can be identified and resolved much faster, leading to smoother development and a more reliable Odoo environment.
1. Using Odoo Debug Mode
Odoo Debug Mode exposes technical features that are hidden in the normal interface. Debug Mode is your first stop whenever something doesn't look or behave as expected.
You can activate debug mode by:
- Adding ?debug=1 at the end of the URL
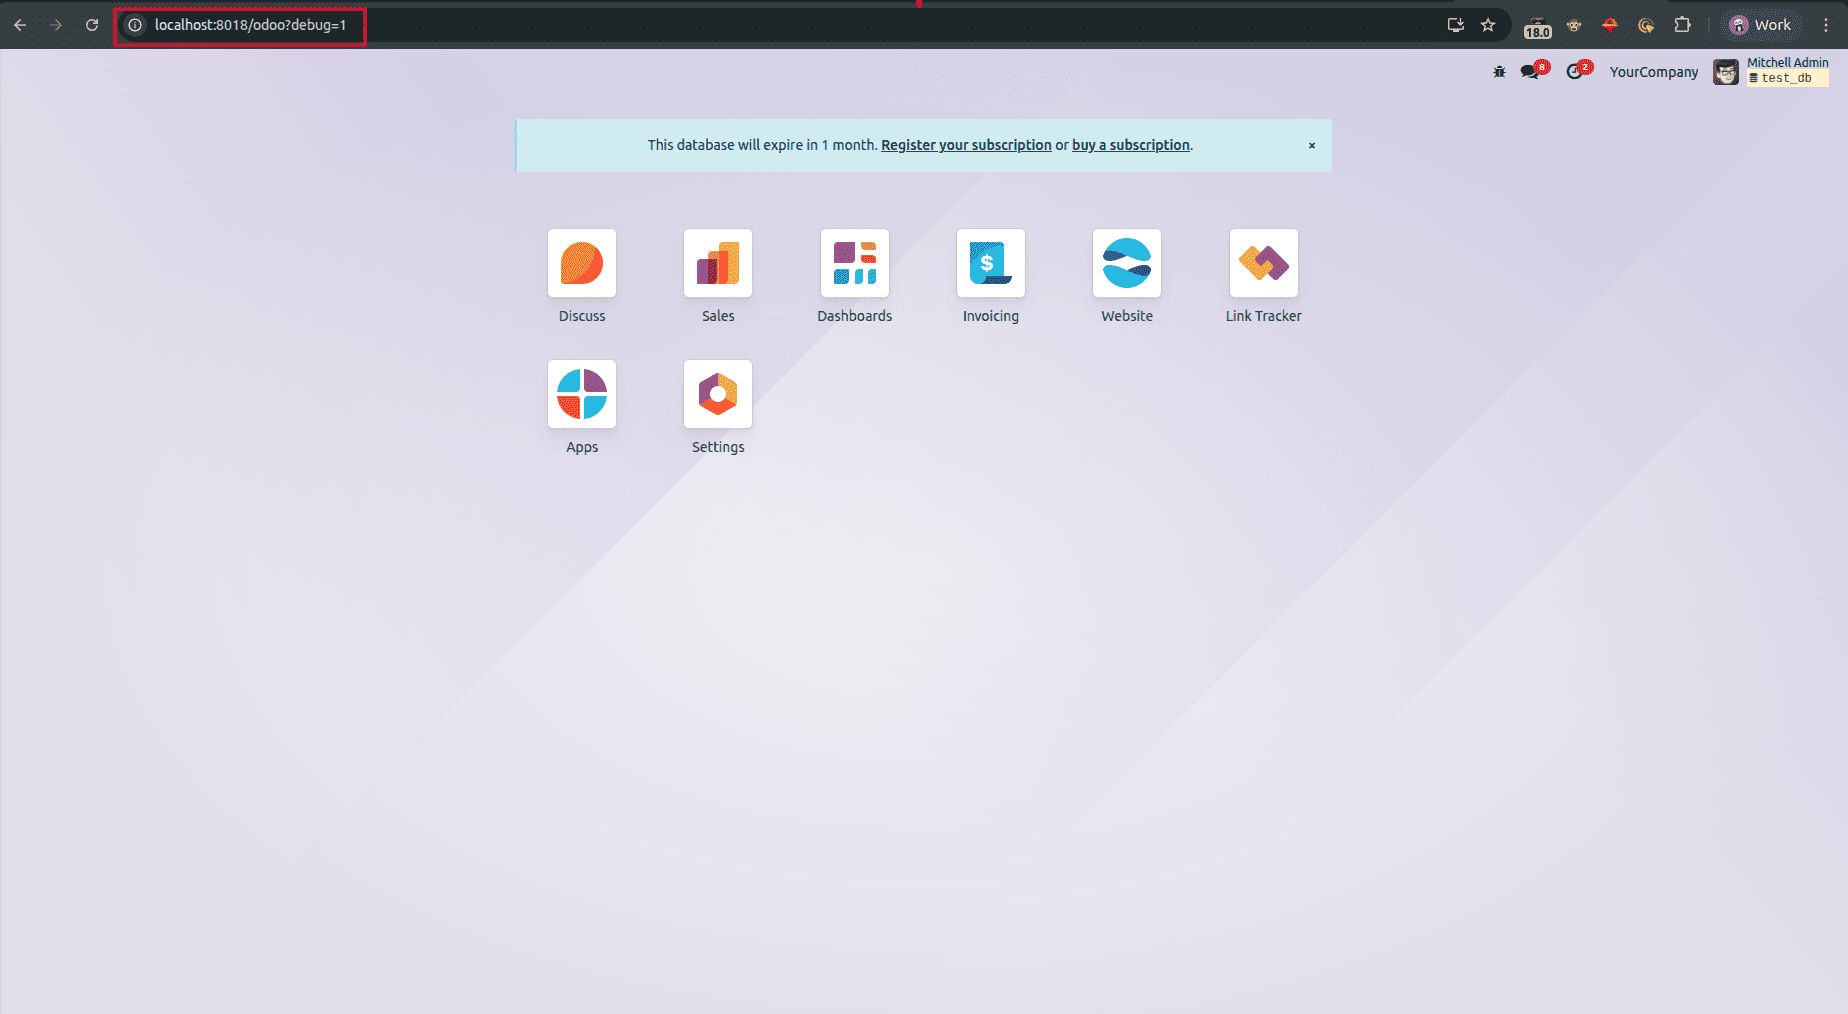
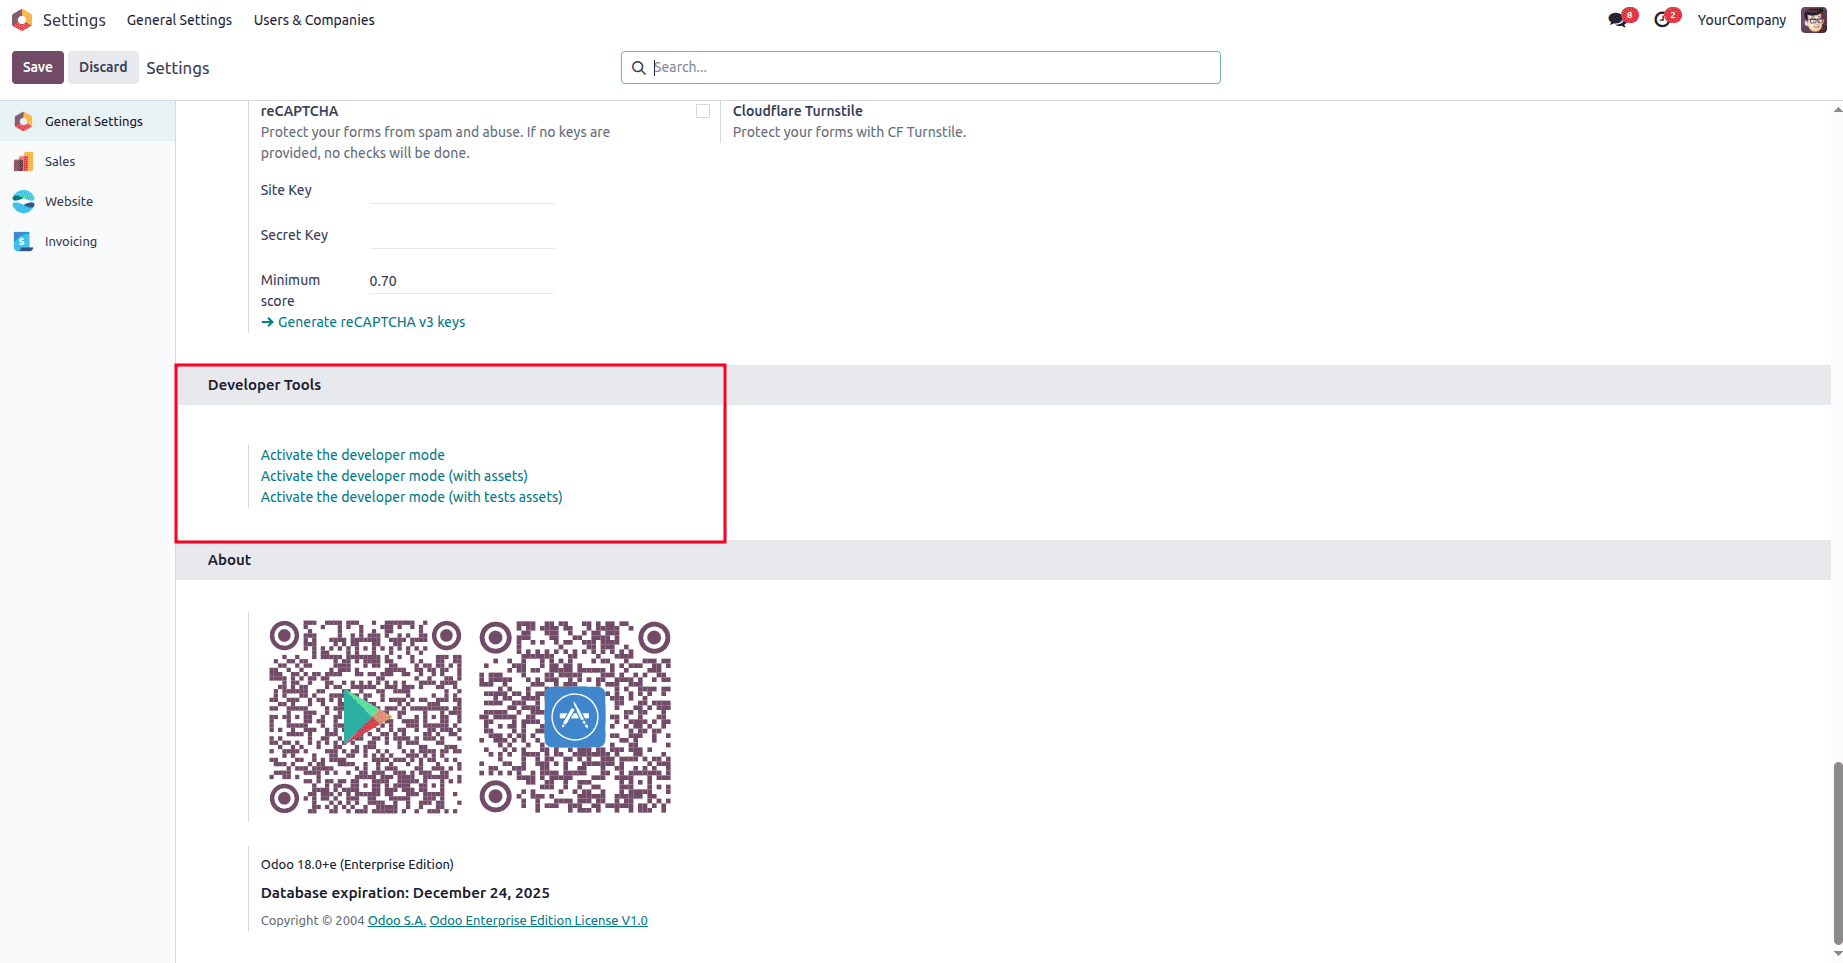
- Or using "Activate Developer Mode" from the Settings menu
What You Can Do with Debug Mode
- Inspect and edit views.
- Check context and domain values.
- Access technical settings
- Manage translations
- Trace fields, models, and inherited views
- Test access rights and record rules
2. Logging ORM Queries
When performance issues arise, ORM query logging reveals what’s happening behind the scenes.
How to Enable SQL query logs
In your Odoo configuration file (odoo.conf):
log_level = debug_sql
Or run Odoo with:
./odoo-bin --log-level=debug_sql
The log will look like this:
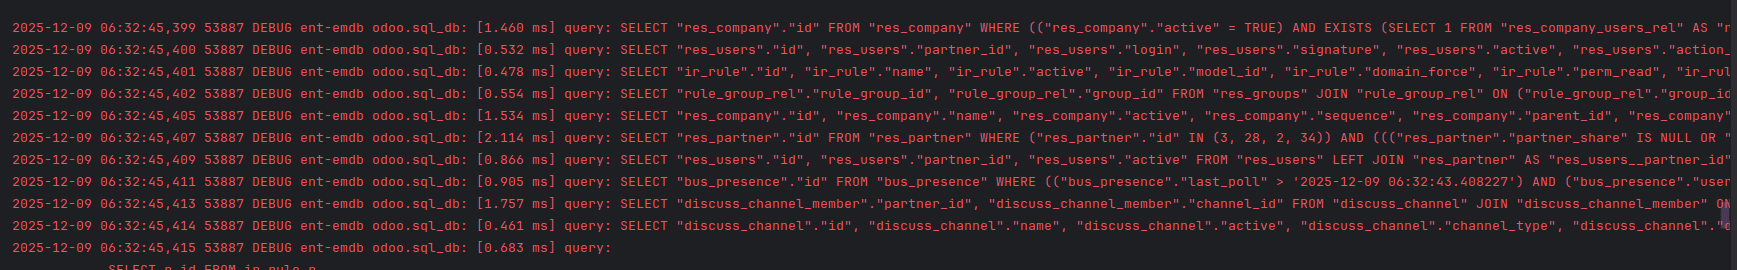
Why ORM logging is useful
- Detects slow SQL queries.
- Understand how many queries a screen or method triggers, ego.
- Identify unnecessary search() calls.
- Optimize code by catching N+1 query problems.
This is one of the best tools to debug performance issues in Odoo 19.
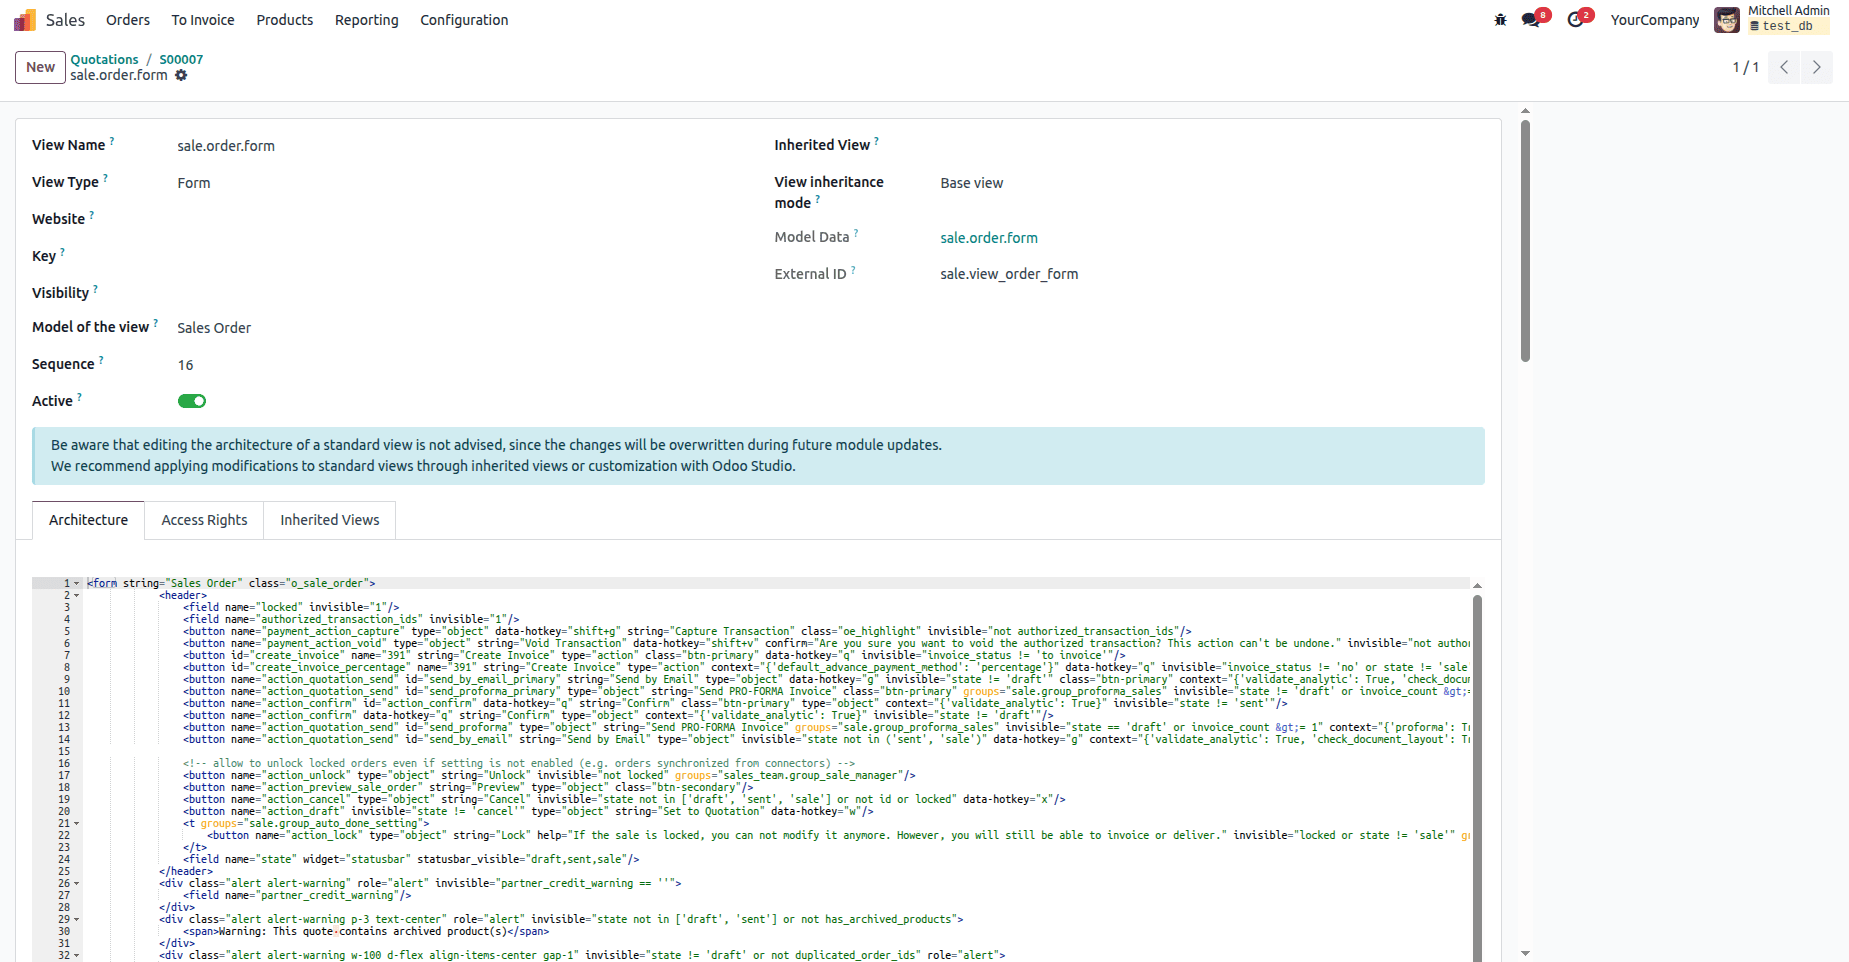
3. Debugging Views
Views are one of the most common areas where customization issues occur. First, you have to activate the debug mode. Then, go to Debug, and you can see the option to go to the details of the view.
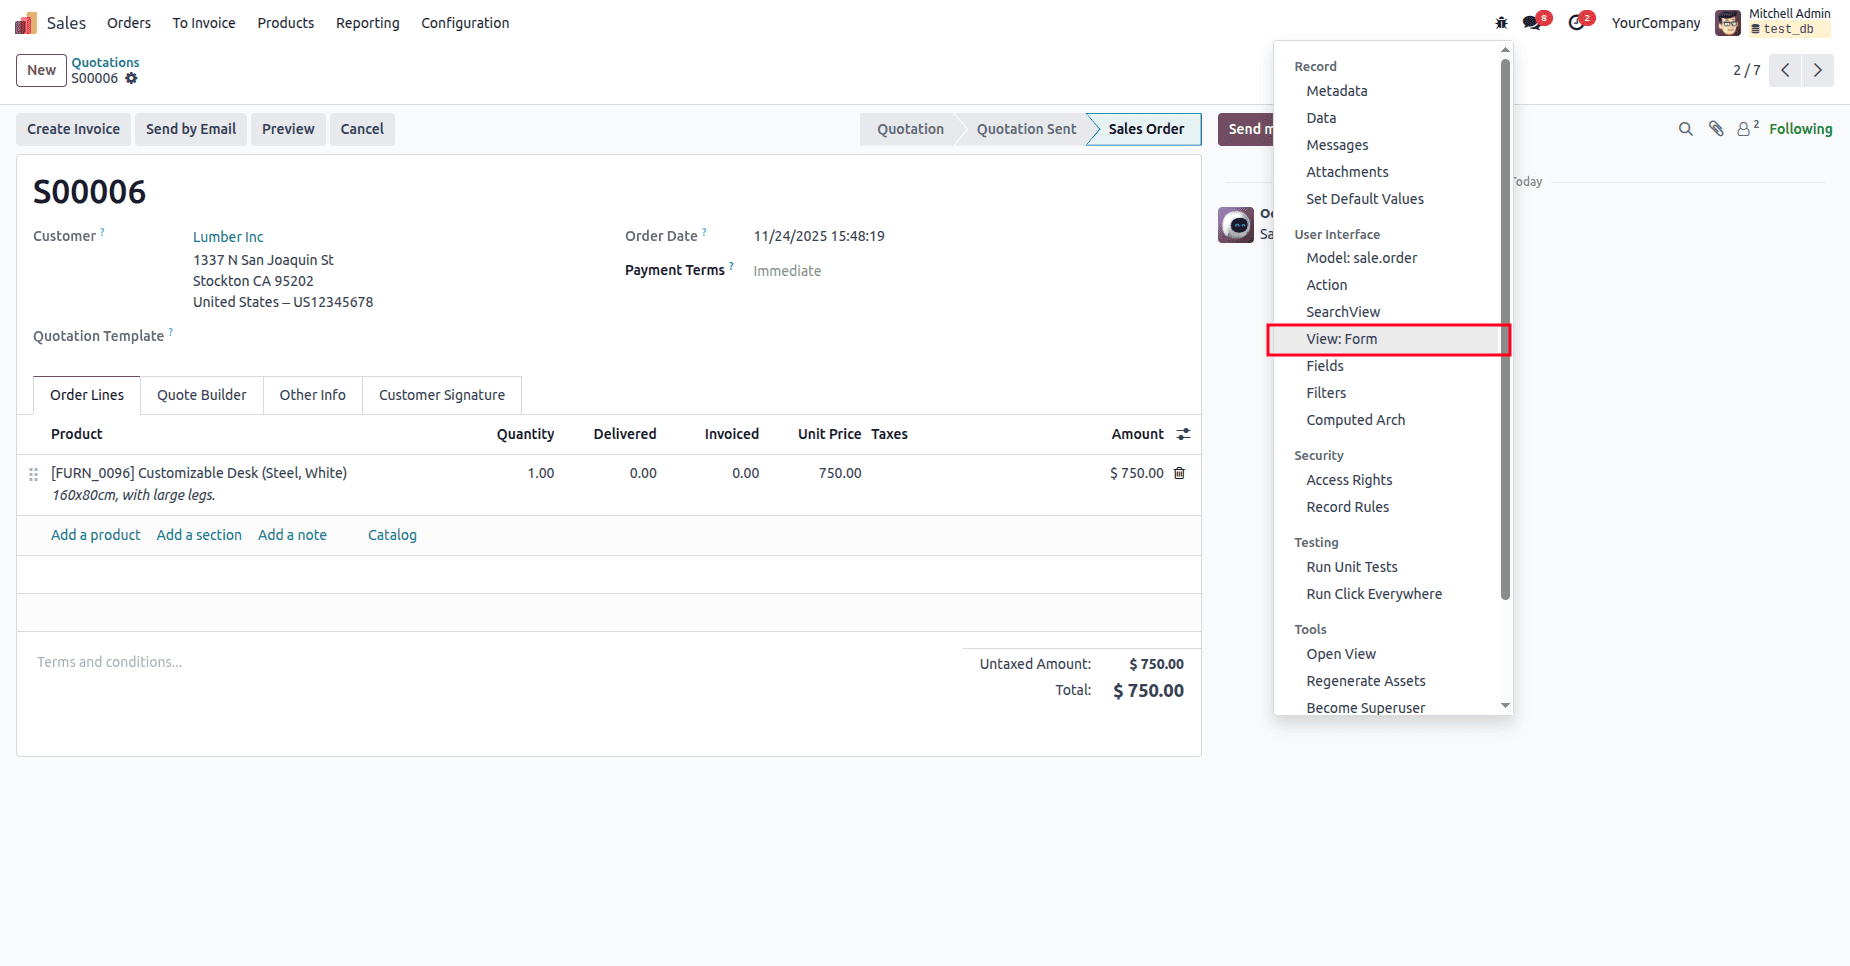
- You can check inherited views under inherited views.
- You can see the complete details of the code along with the access rights and code architecture.
- You can make changes in the architecture and perform testing through the frontend.
Common issues caught with view debugging.
- Invisible fields are not working due to wrong attributes.
- Conflicting inherited views
- Wrong domains or contexts
- Misplaced locations
4. Debugging Reports
Reports in Odoo use QWeb templates, which can be tricky to troubleshoot. You can visit the details of the reports by going to the settings. From the settings, navigate to the reports menu under the technical menu.
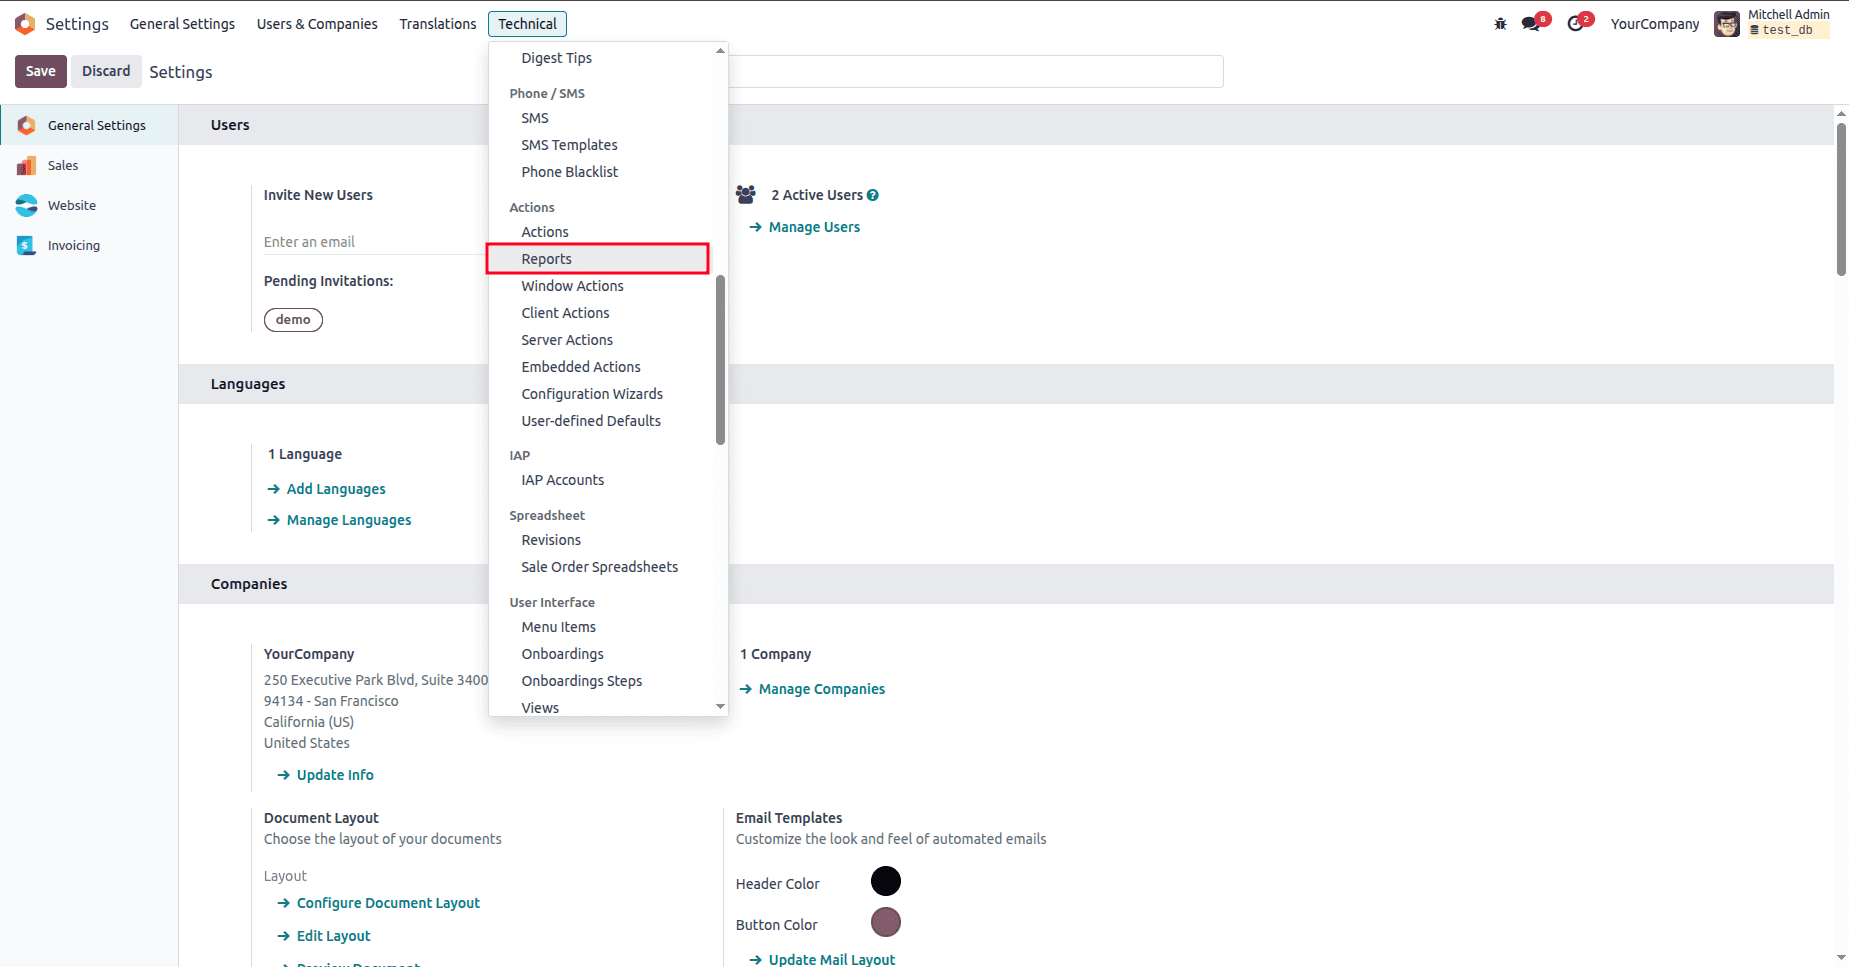
By clicking on the reports menu, you will be redirected to the reports list view, where you can see the list of reports in Odoo. By clicking on any of the reports, you can see the details of the reports.
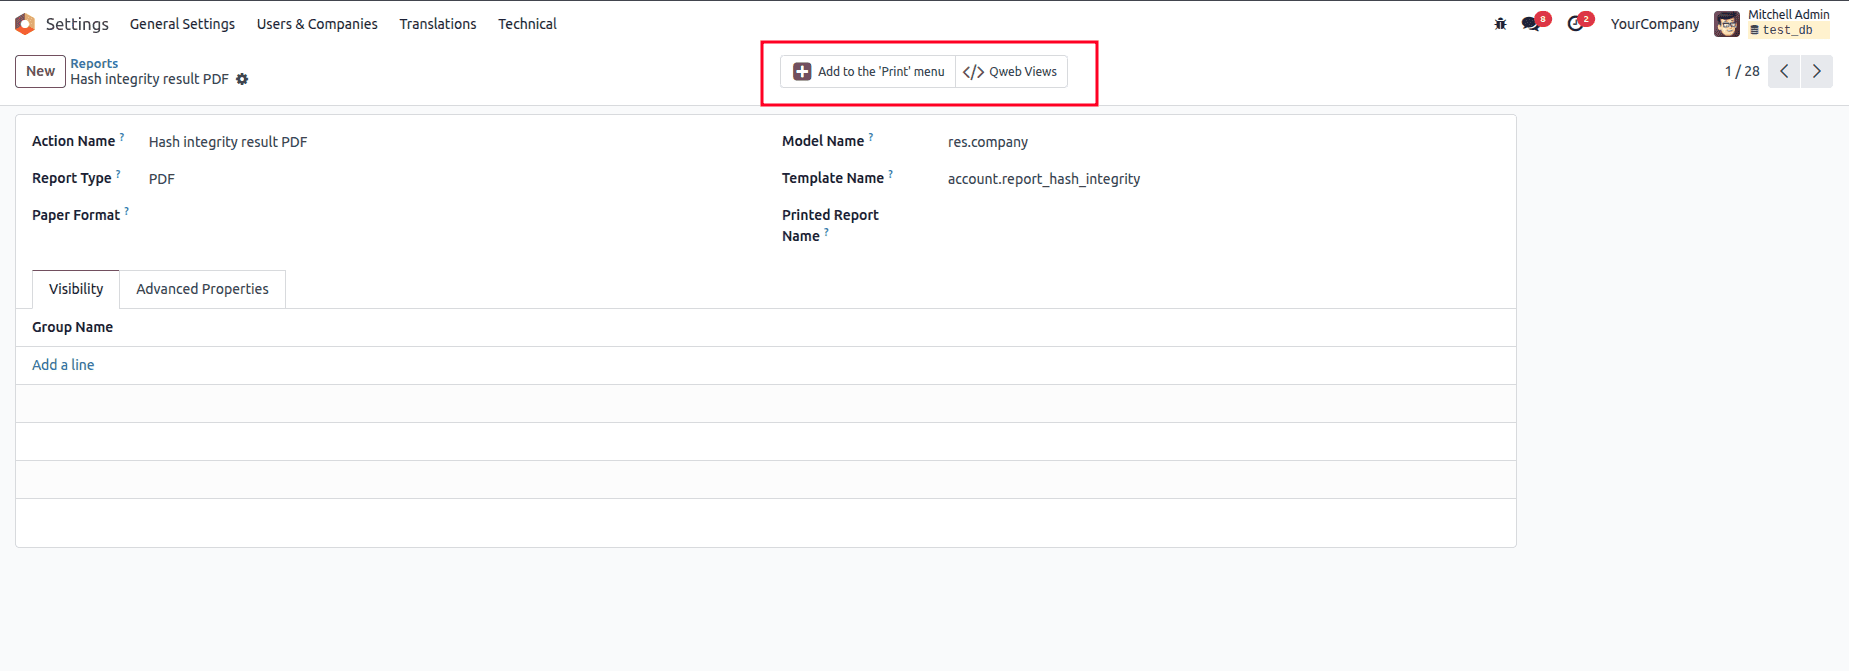
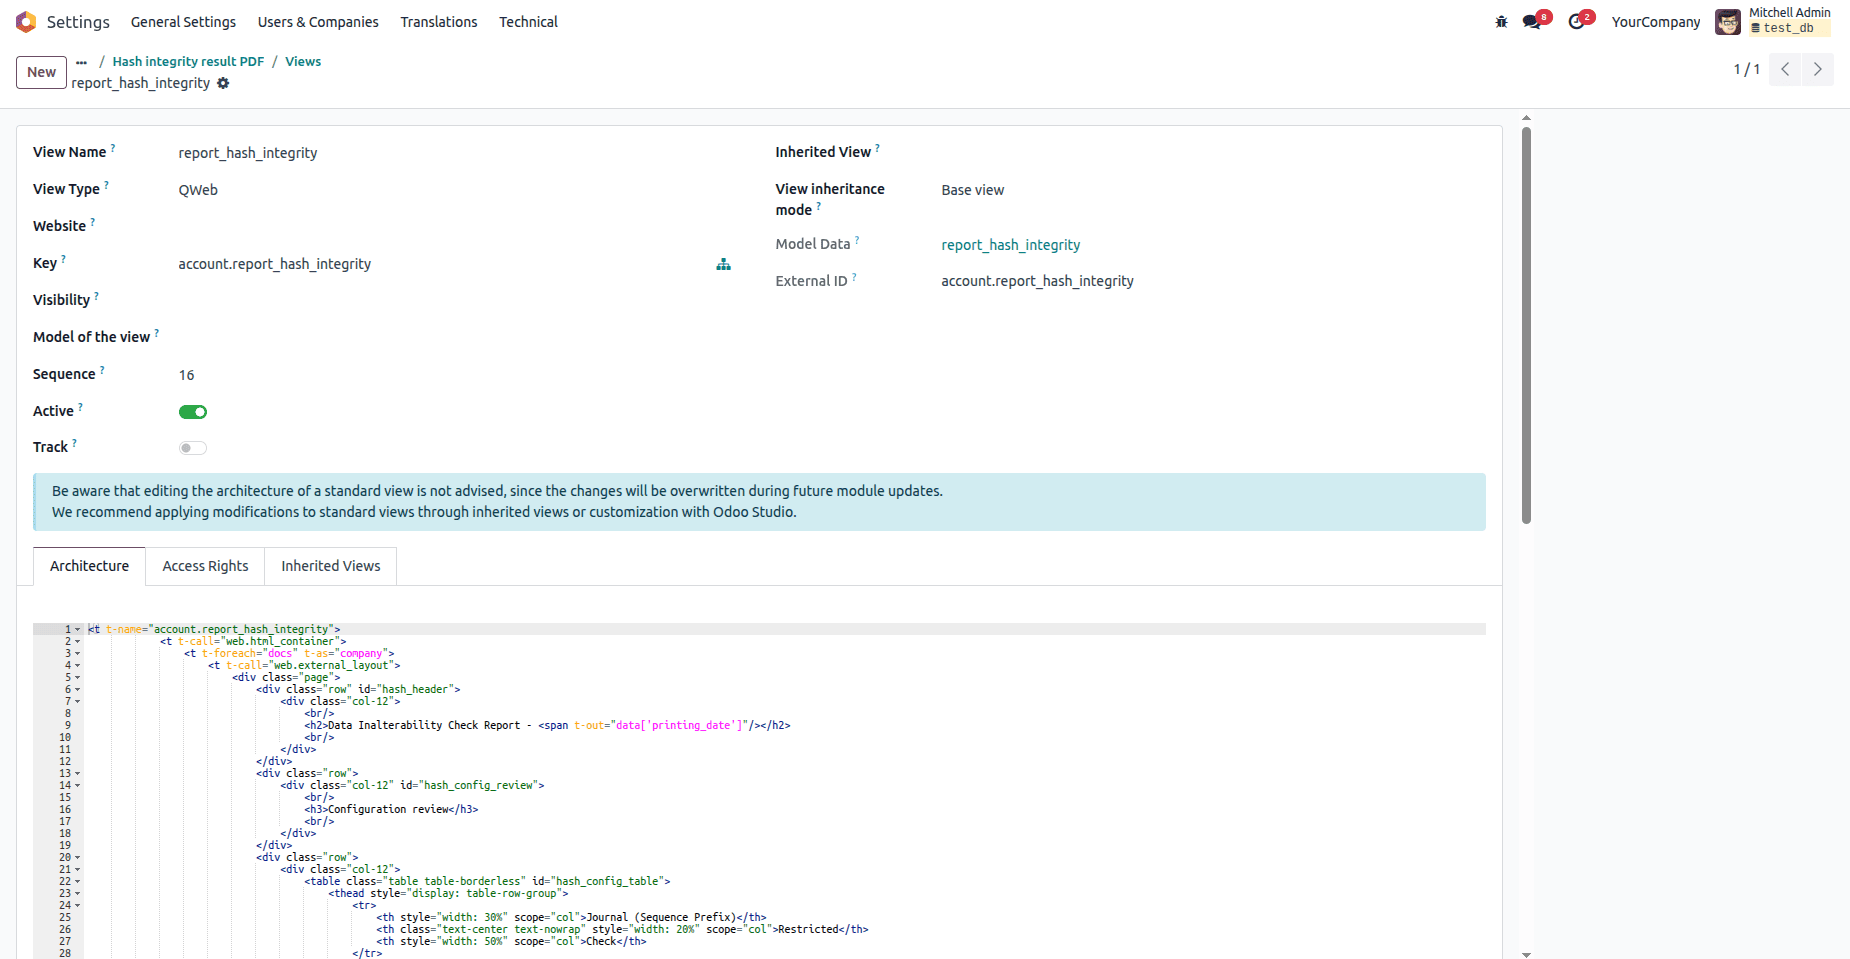
By clicking on the Qweb Views smart button, you will be able to see the view details along with the architecture, access rights, and inherited views.
Common report issues
- Missing or wrong t-xpath paths
- Unescaped variables
- PDF rendering issues due to wkhtmltopdf
5. Debugging JS/OWL Code
Odoo 19 heavily relies on OWL for new UI components.
console.log() is the simplest and fastest way to inspect variables, props, state, RPC results, or event trigger
console.log("Component props:", this.props);
console.log("State values:", this.state); - Adding Breakpoints in Browser DevTools
Breakpoints allow step-by-step execution to identify exactly where logic fails. This is especially useful for complex component interactions or asynchronous calls. To add breakpoints, go to DevTools, and from there navigate to the sources. In the sources, you can find the assets file. Click on the line in which you want to add the breakpoint.
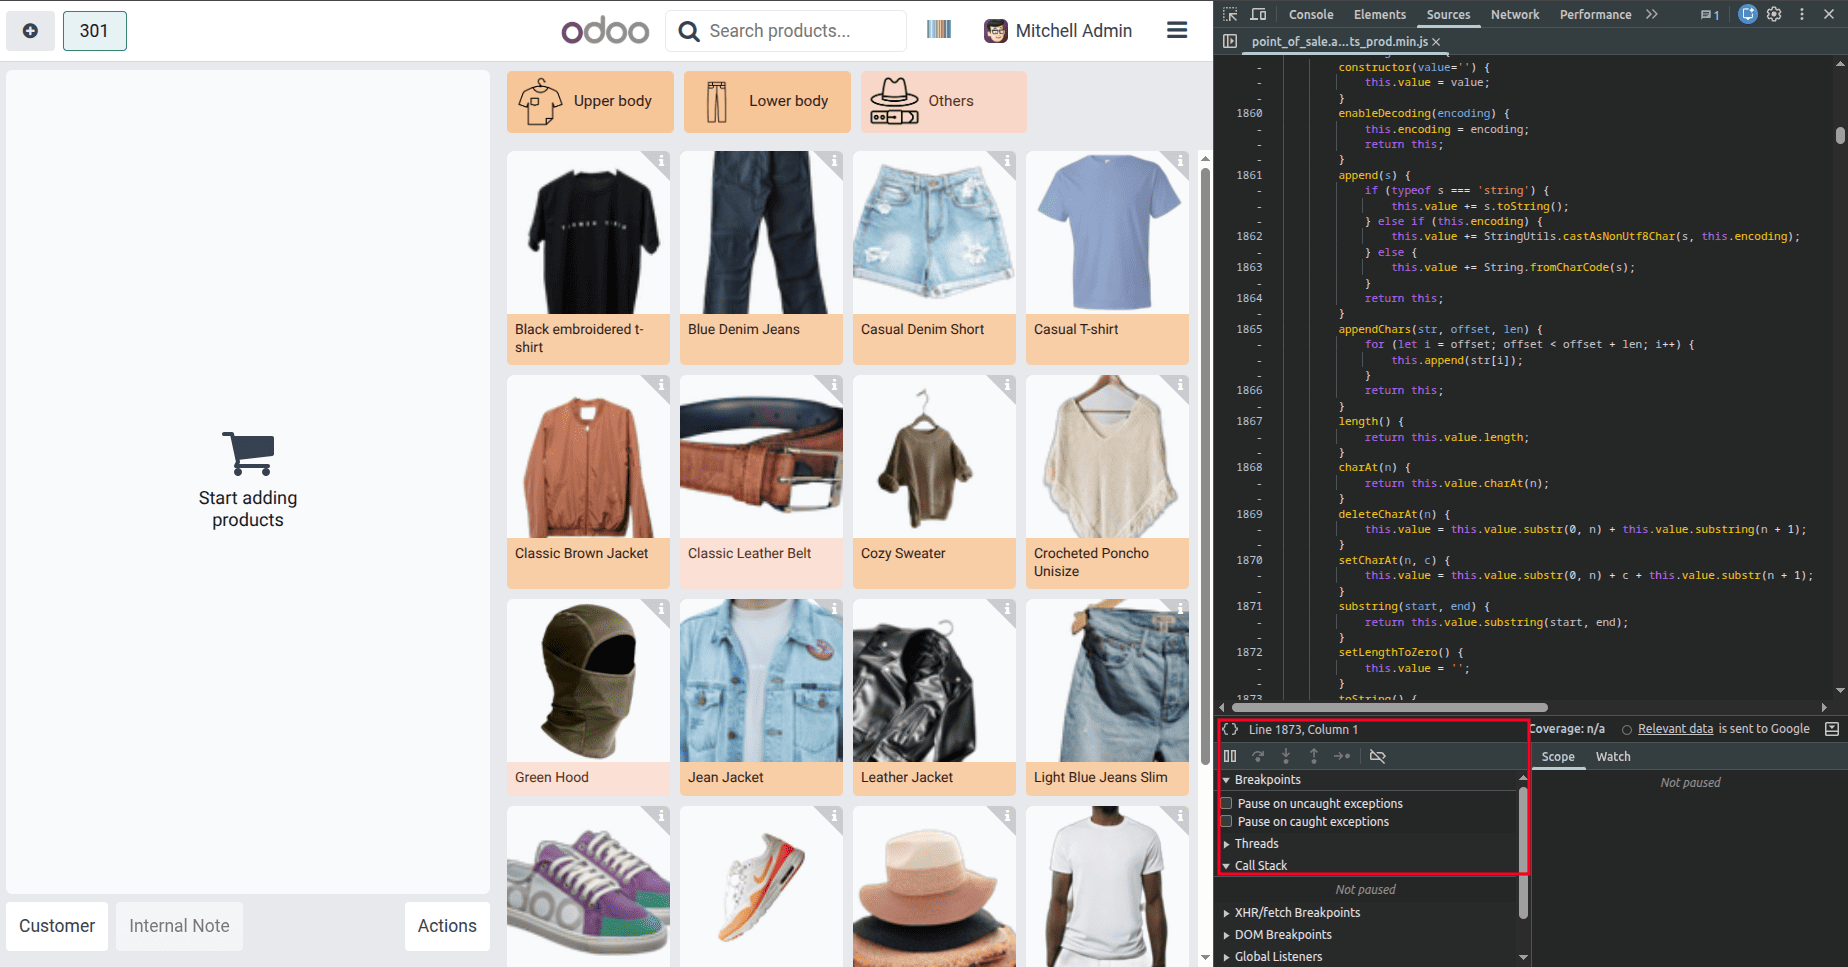
You can pause code execution at a specific line using the debugger keyword, allowing you to inspect variables, step through logic, and analyze component behavior directly in the browser DevTools.
mounted() {
   debugger;
}
Useful debugging tips
- Inspect OWL components via DevTools.
- Check event bus errors.
- Verify patches and services using the browser console.
- Watch for incorrect imports or arch mismatches.
6. Debugging Cron Jobs
Cron jobs run in the background, making issues harder to track.
Find cron logs
In the server logs, look for:
odoo.addons.base.models.ir_cron: Job `your_cron_name` Fully done
To enable detailed logs, add in odoo.conf:
log_handler = odoo.addons.base.models.ir_cron:DEBUG
The log will look like this:

Common cron debugging steps
- Check the next execution date
- Ensure the cron is active.
- Test manually by clicking Run Manually in the cron form view
- Trap exceptions using try/except to avoid silent failures
Cron jobs often fail due to access rights, incorrect domains, or sequence errors.
Conclusion
Debugging in Odoo 19 requires a combination of tools and techniques. Whether you’re fixing a UI issue, optimizing performance, or troubleshooting background jobs, the methods above form a solid debugging toolkit.
By mastering Debug Mode, ORM logs, view inspection, report tools, JS/OWL debugging, and cron logs, you’ll be able to track down almost any issue in your Odoo environment faster.
To read more about Overview of Error Management in Odoo 19, refer to our blog, Overview of Error Management in Odoo 19.