Odoo 19 Accounting's Profit and Loss report summarizes revenues and costs to assess a company's financial performance over a given time period. It is crucial for evaluating profitability since it assists companies in determining their net profit or net loss. By highlighting the revenue streams and expenses that have the biggest influence on financial outcomes, the report also aids in decision-making. In order to spot trends and growth patterns, it also lets users compare performance over time. All things considered, the Profit and Loss report offers crucial information for both general financial management and strategic planning.
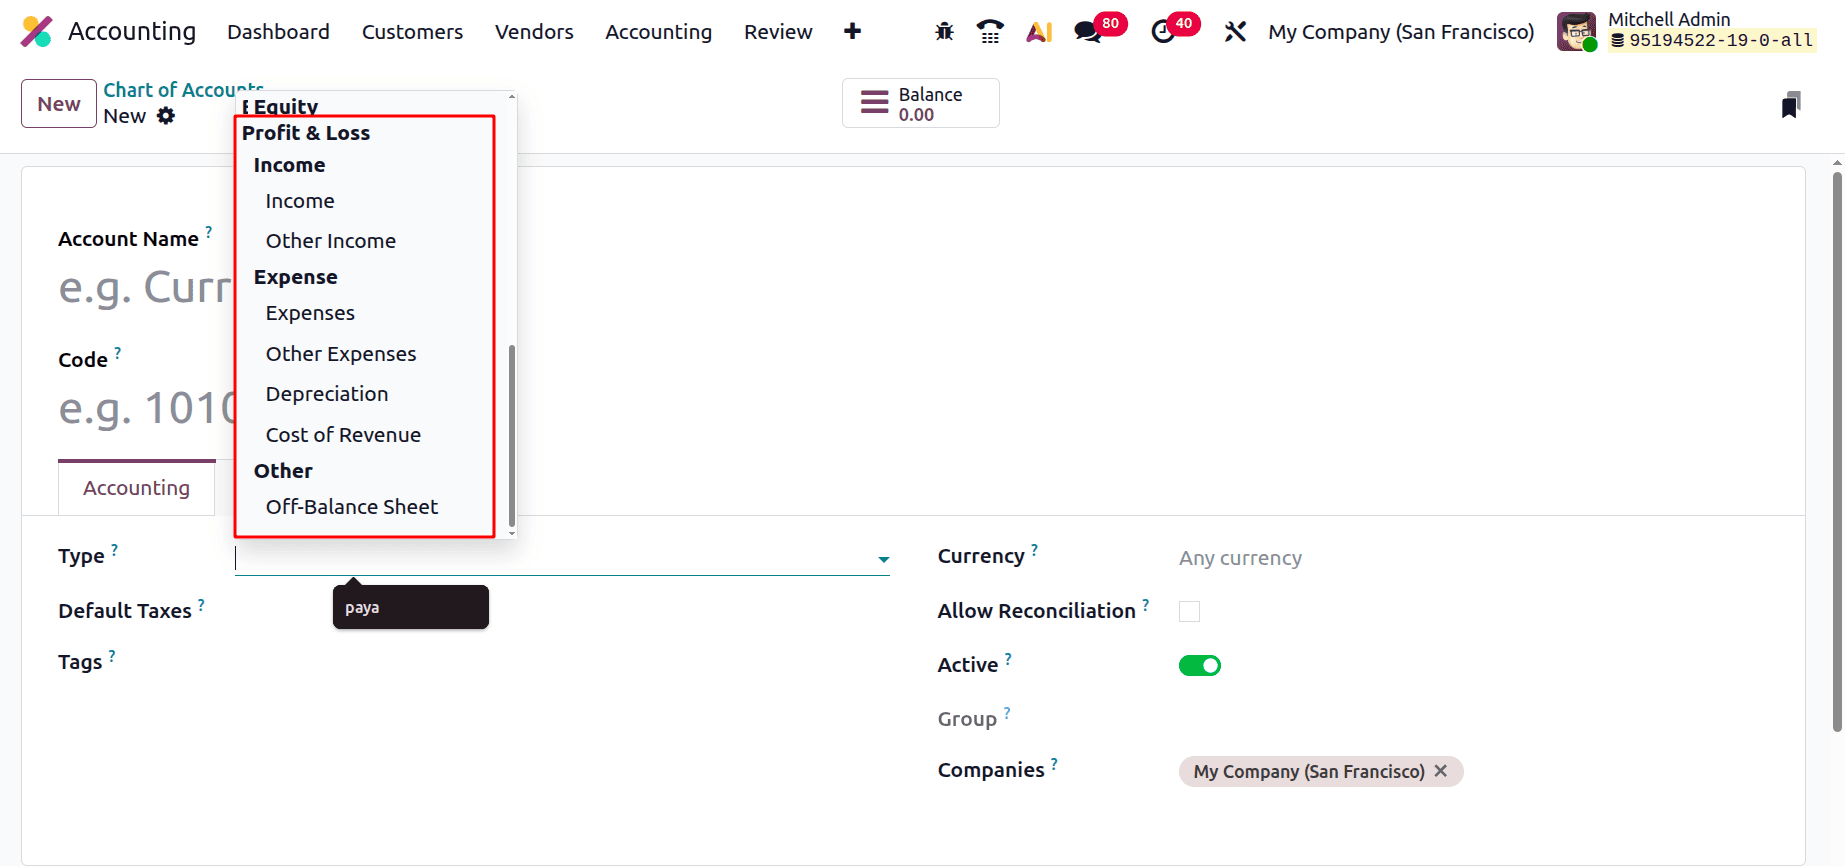
Let's check the Chart of Accounts to view which types of accounts are included in this Profit and Loss Report. Income and Expense types are included in the Profit and Loss Report. The entries added inside Income, Other Income, Expense, Other Expense, Depreciation, and Cost of Revenue are included inside the Profit and Loss Report.
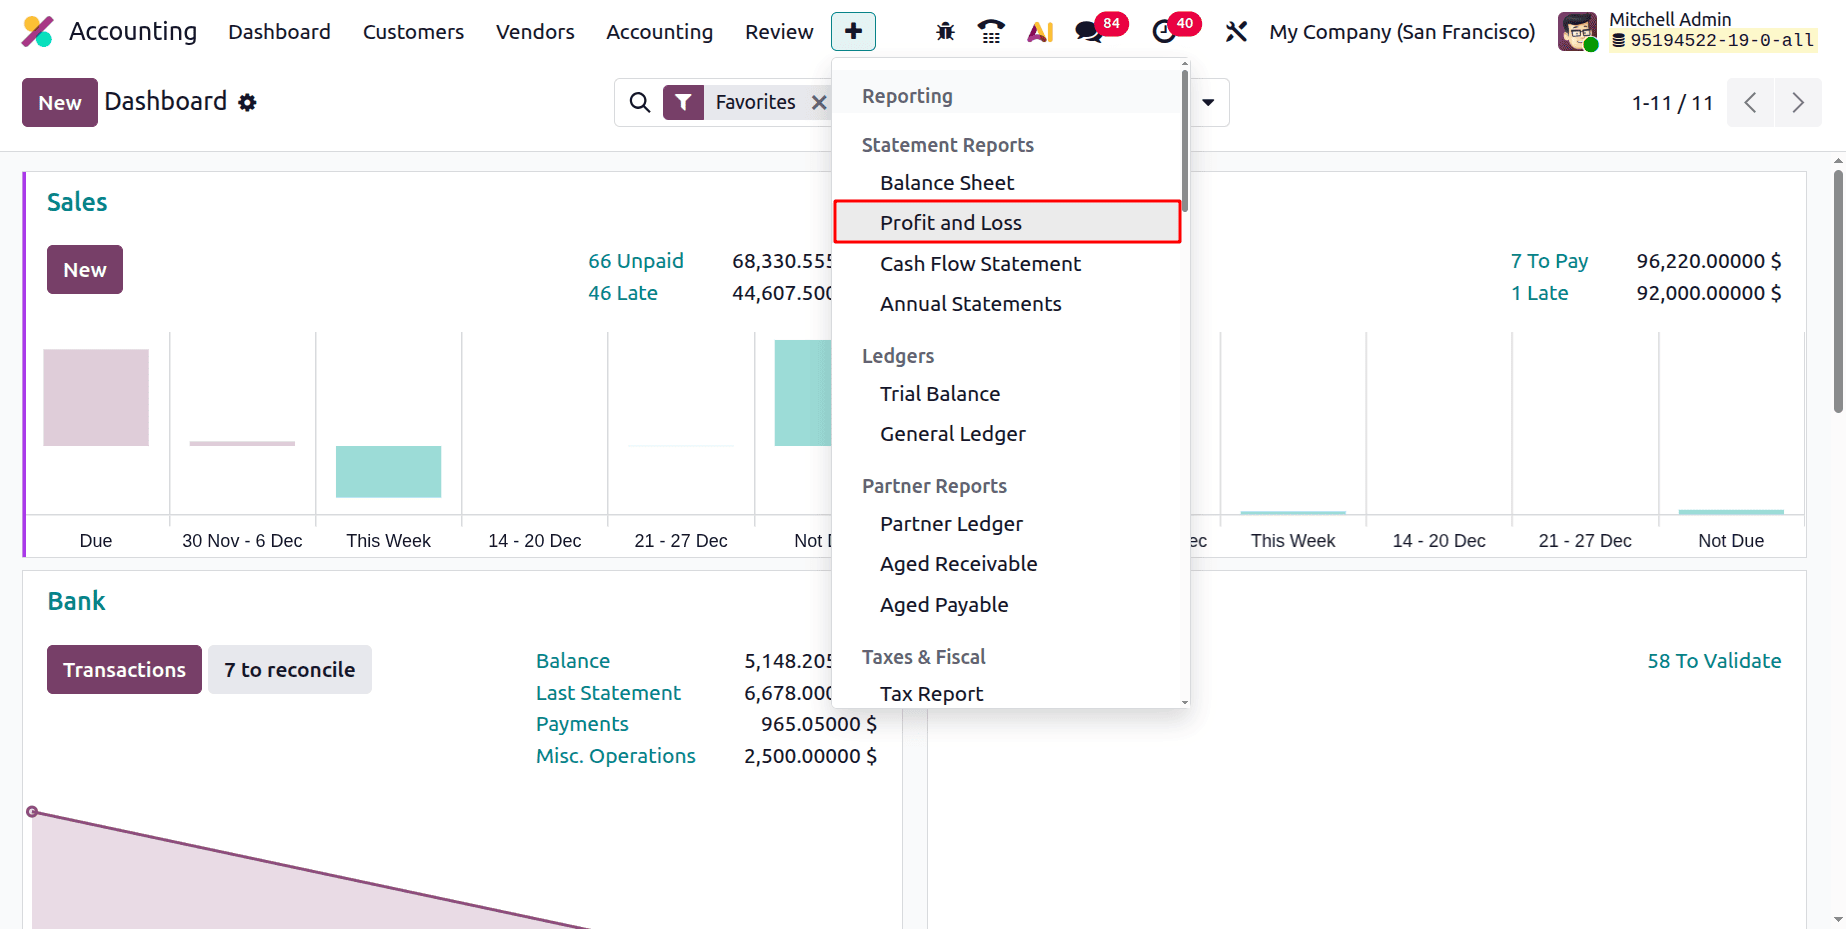
To get the Profit and Loss Report, click on the Reporting menu, then choose the Profit and Loss Report, which is added under the Statement Report.
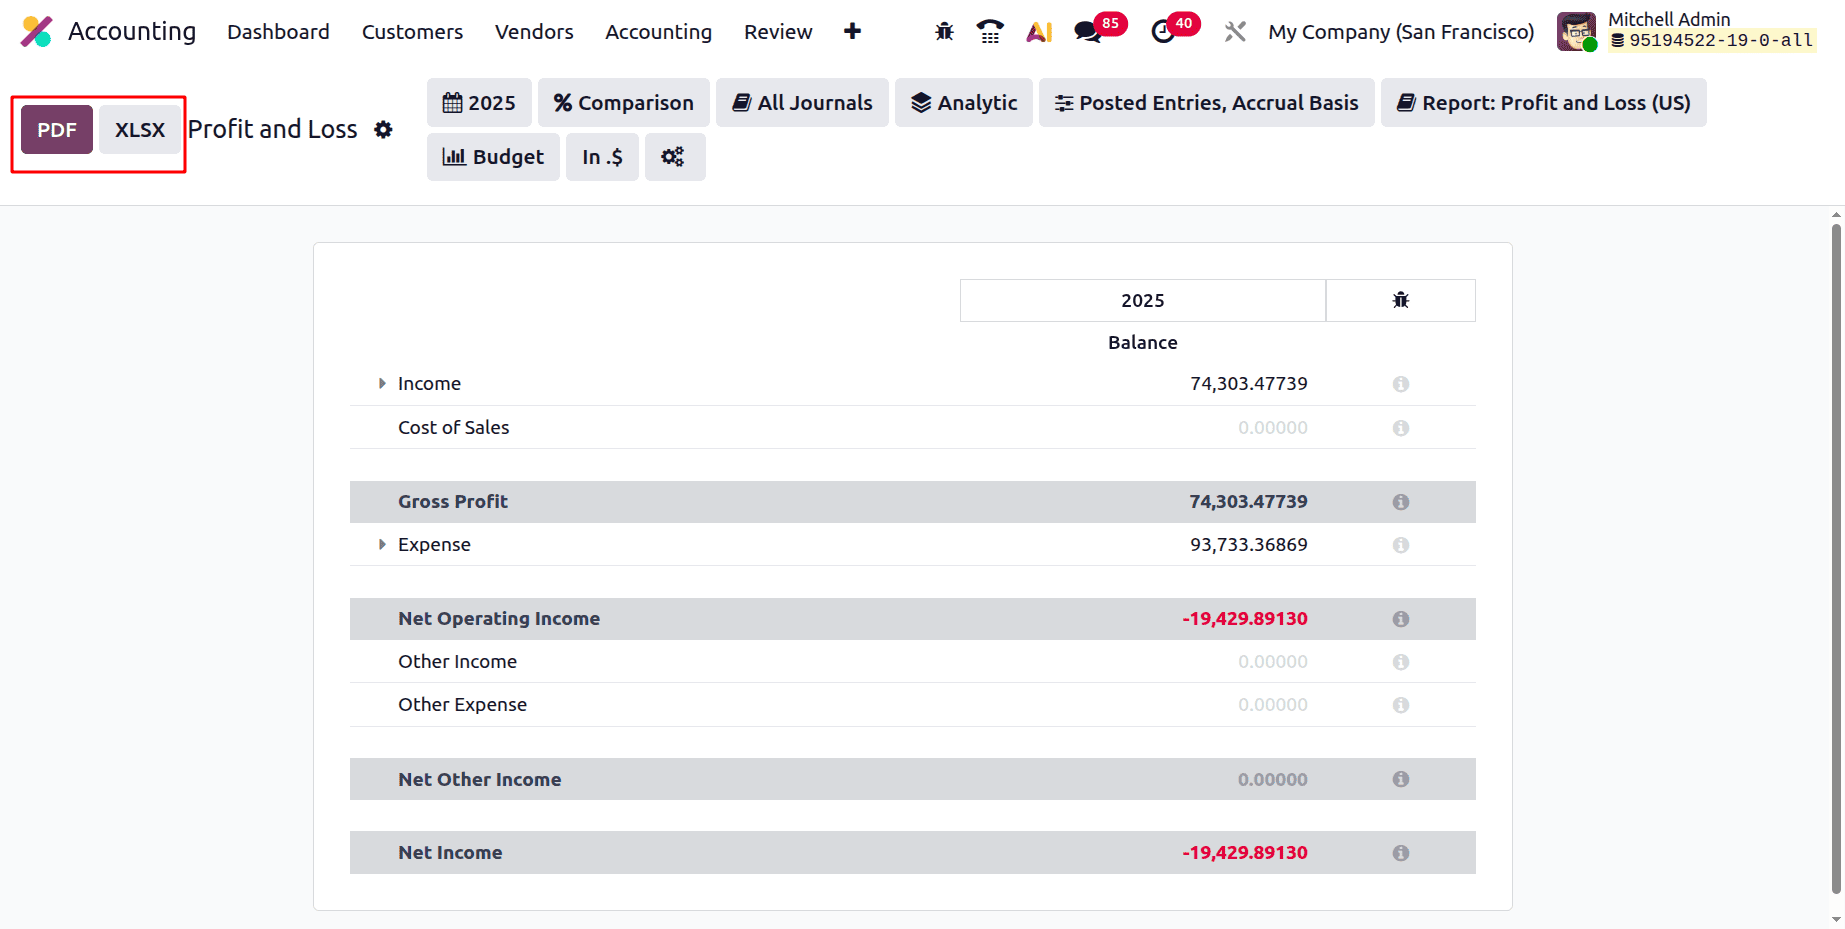
Here, the Profit and Loss report can be exported as PDF or XLSX format by clicking on the corresponding button.
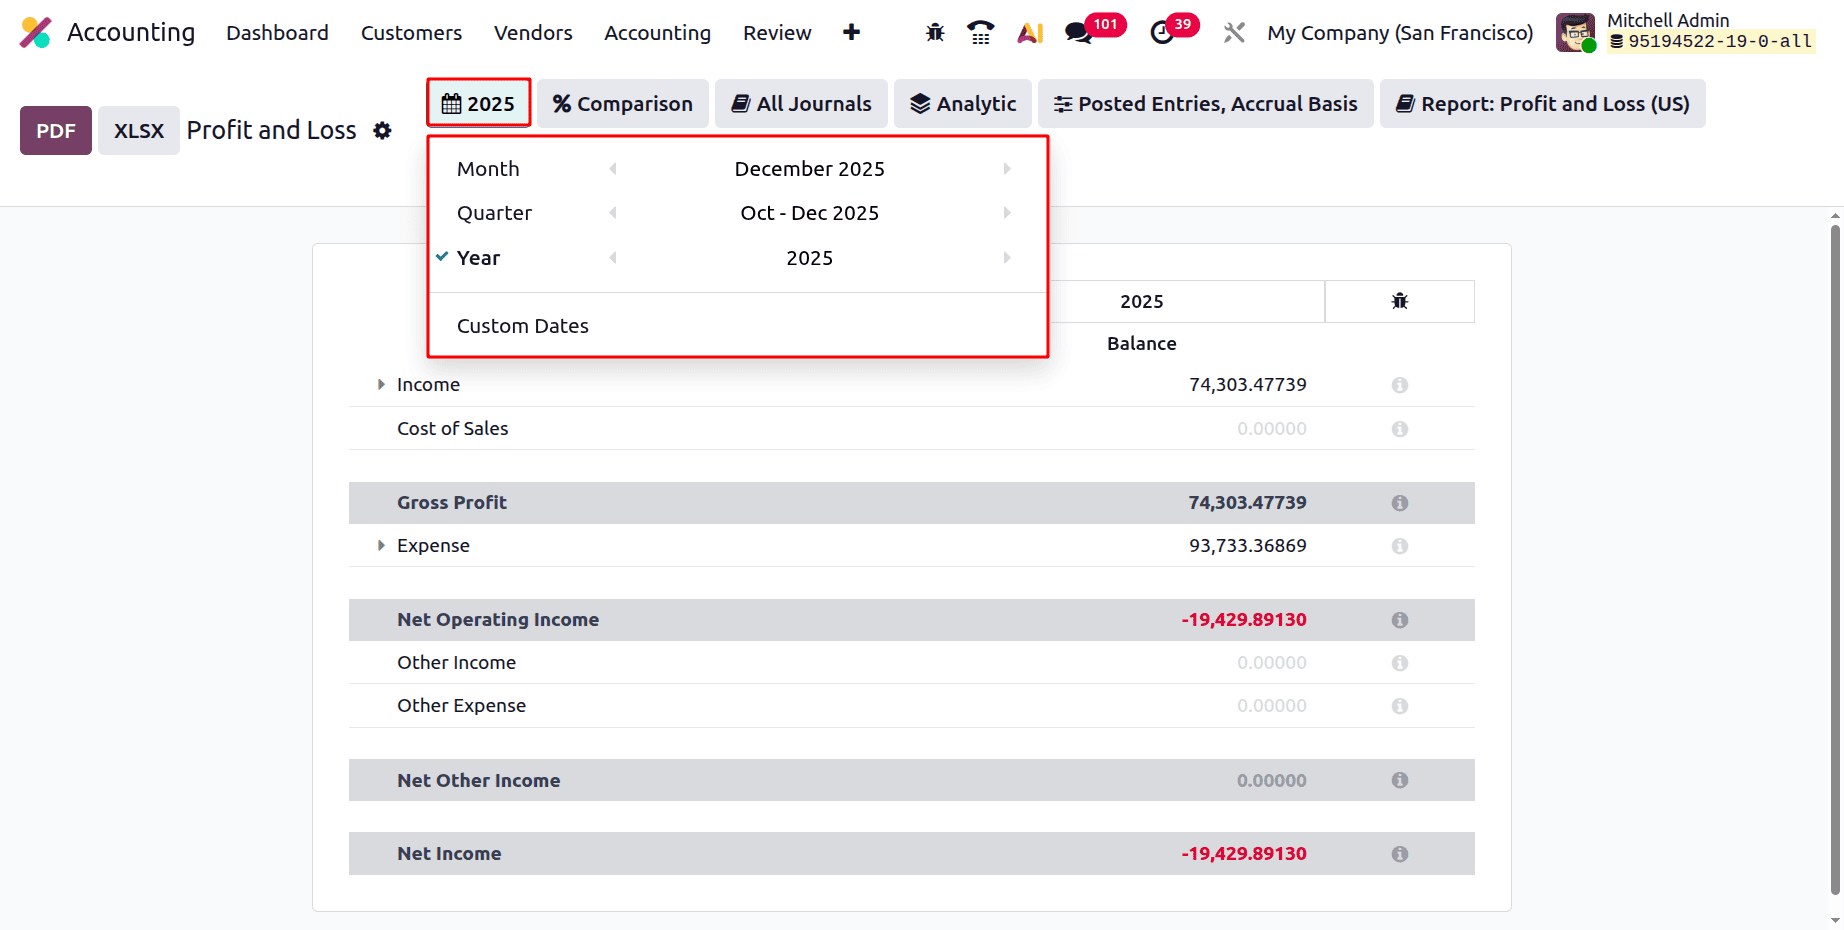
Let's discuss the filters inside the Profit and Loss report. The report is automatically generated based on the default period, usually the current fiscal year, after it is accessed. Odoo, however, offers complete flexibility to modify this timeline in accordance with particular company requirements. The report can be generated by users for a Month, Quarter, Year, or even a time of their choosing.
The Comparison filter is indicated in the Profit and Loss report. It enables you to more thoroughly examine financial performance by contrasting the current reporting period with previous reference periods. The meaning of each option under this filter is as follows:
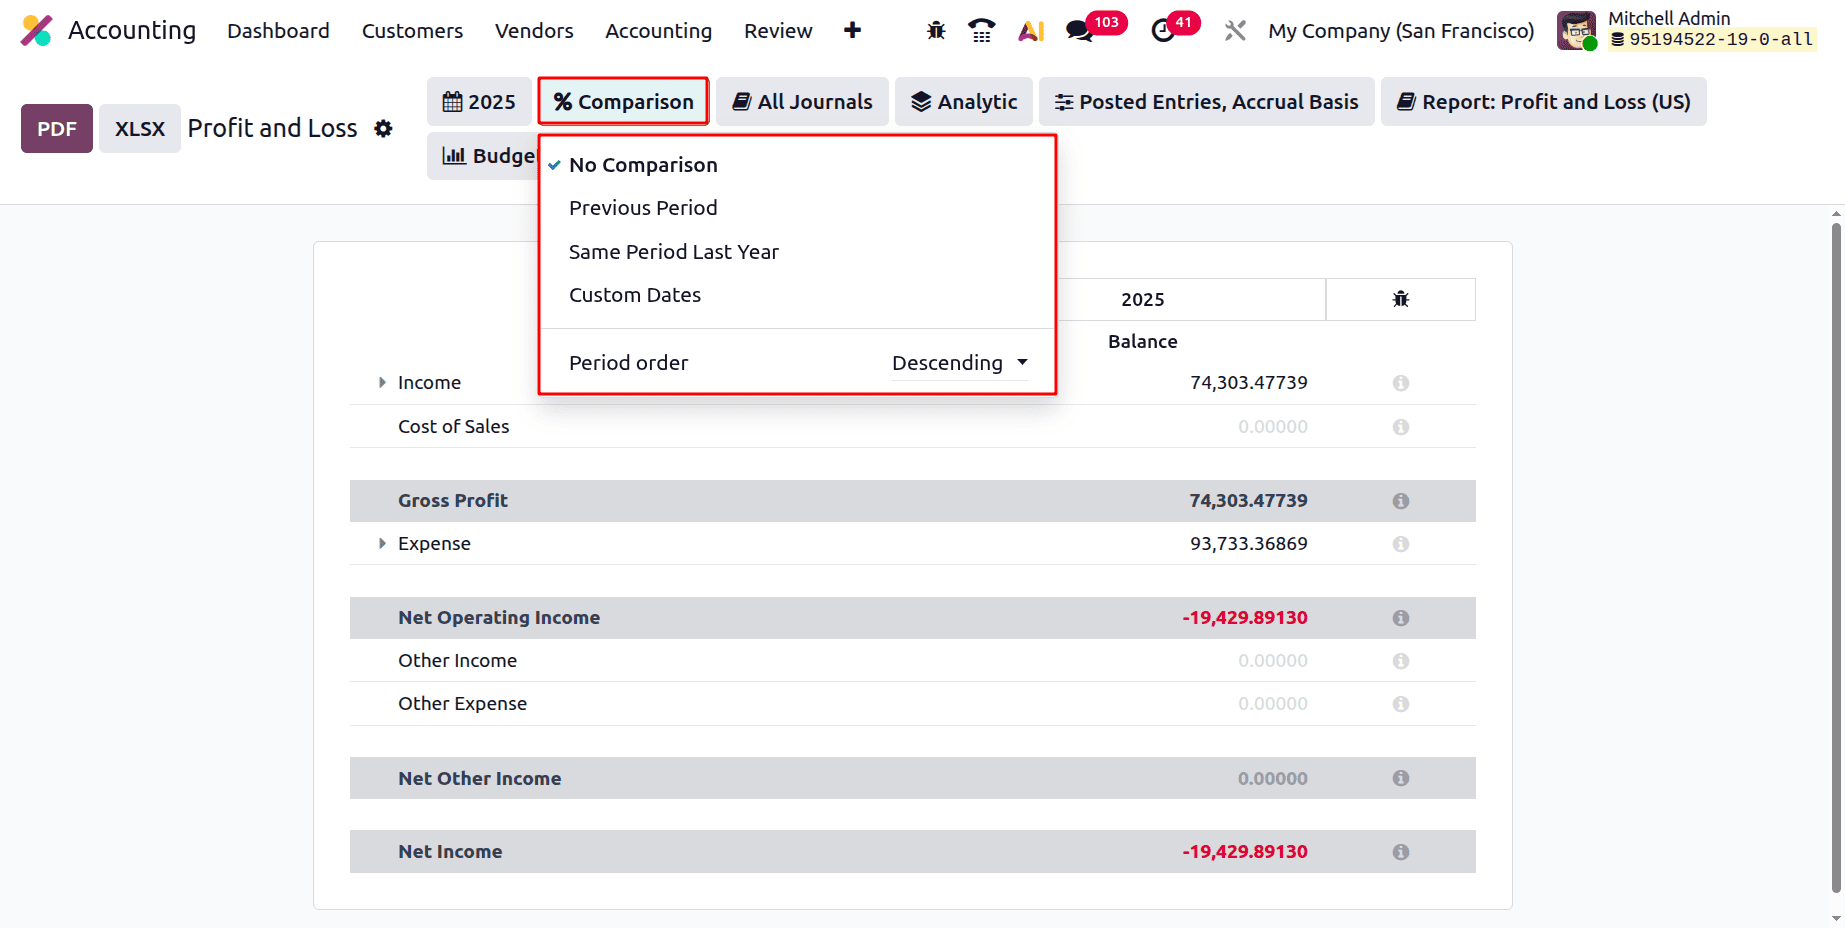
- No Comparison: Shows just the chosen time frame and no further comparison information.
- Previous Period: Compares the profit and loss figures from the current quarter to those from the period that came right before it (e.g., comparing Q2 with Q1). This aids in locating transient performance shifts.
- Same Period Last Year: Contrasts the chosen time frame with the same time frame from the prior year. This is helpful for assessing growth or reduction from year to year.
- Custom Dates: Gives you freedom for customized financial analysis by enabling you to manually choose particular dates or time periods for comparison.
- Period Order (Ascending/Descending): Chooses whether the comparison periods are shown in the most recent first (descending) or oldest first (ascending). In order to better understand trends, this helps arrange data.
All things considered, the Comparison filter improves analytical understanding by highlighting the ways in which current financial performance varies from prior or customary periods.
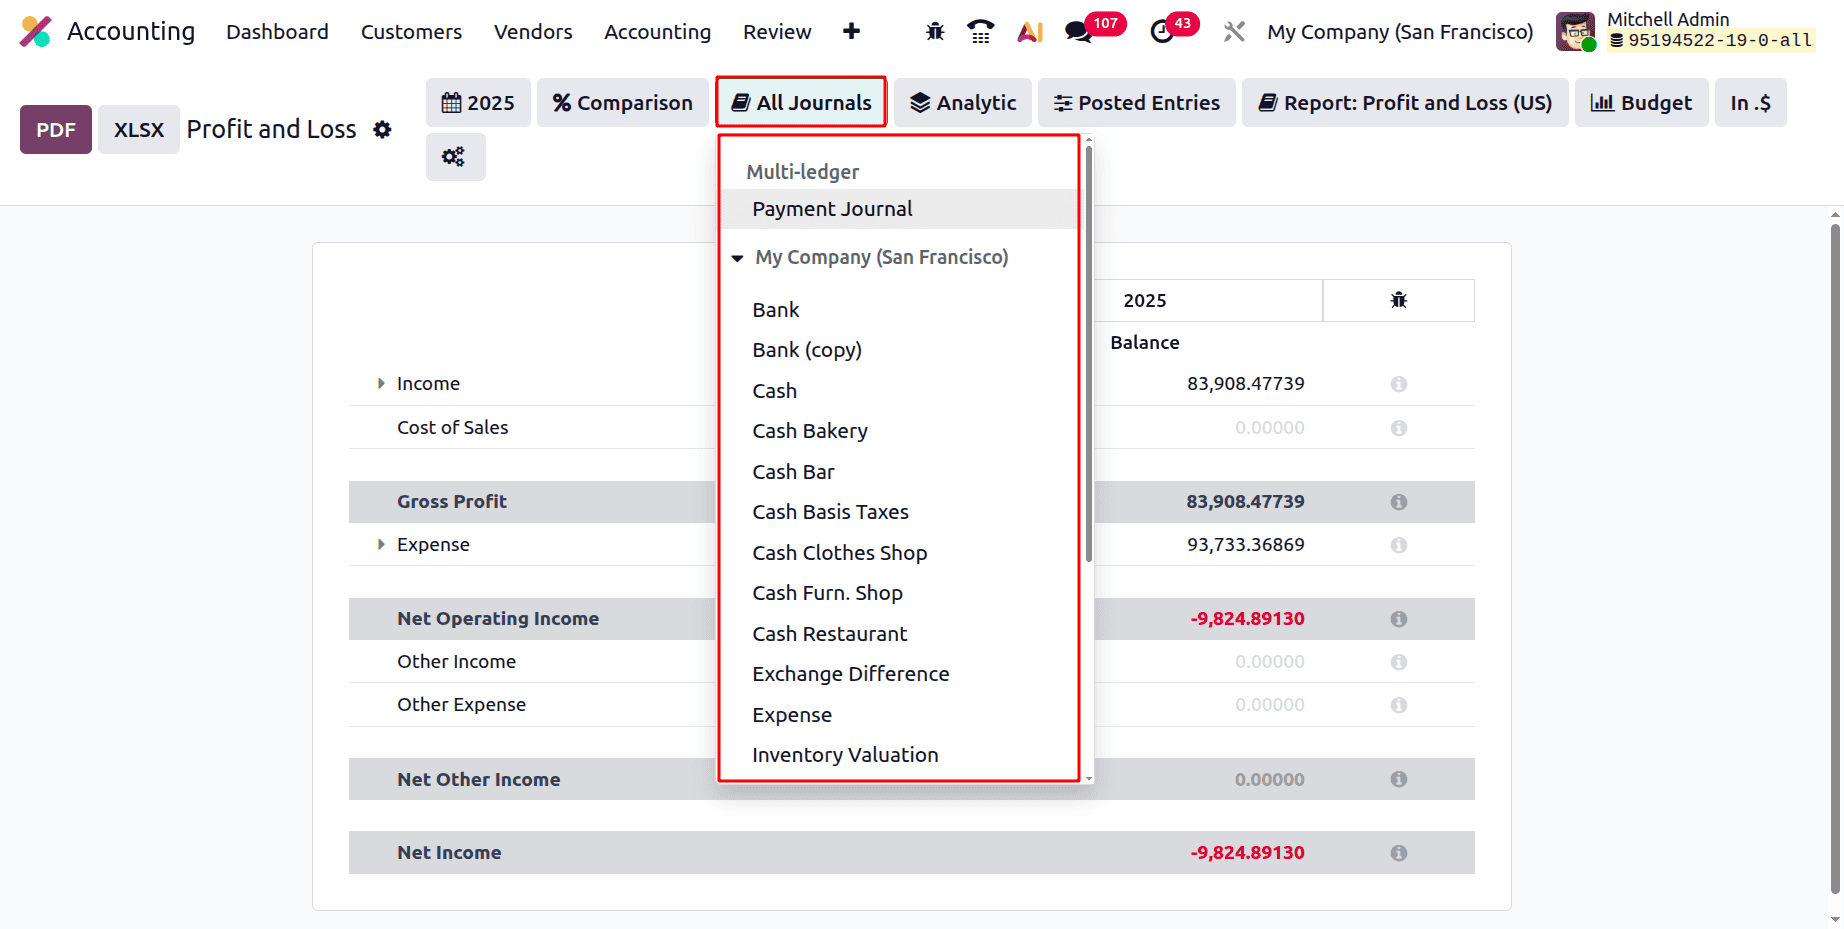
Next is a filter based on Journal. While clicking on the Journals filter, which shows all the Journals and Mult-Ledgers. So while clicking on the journal, the users can filter the Profit and Loss report.
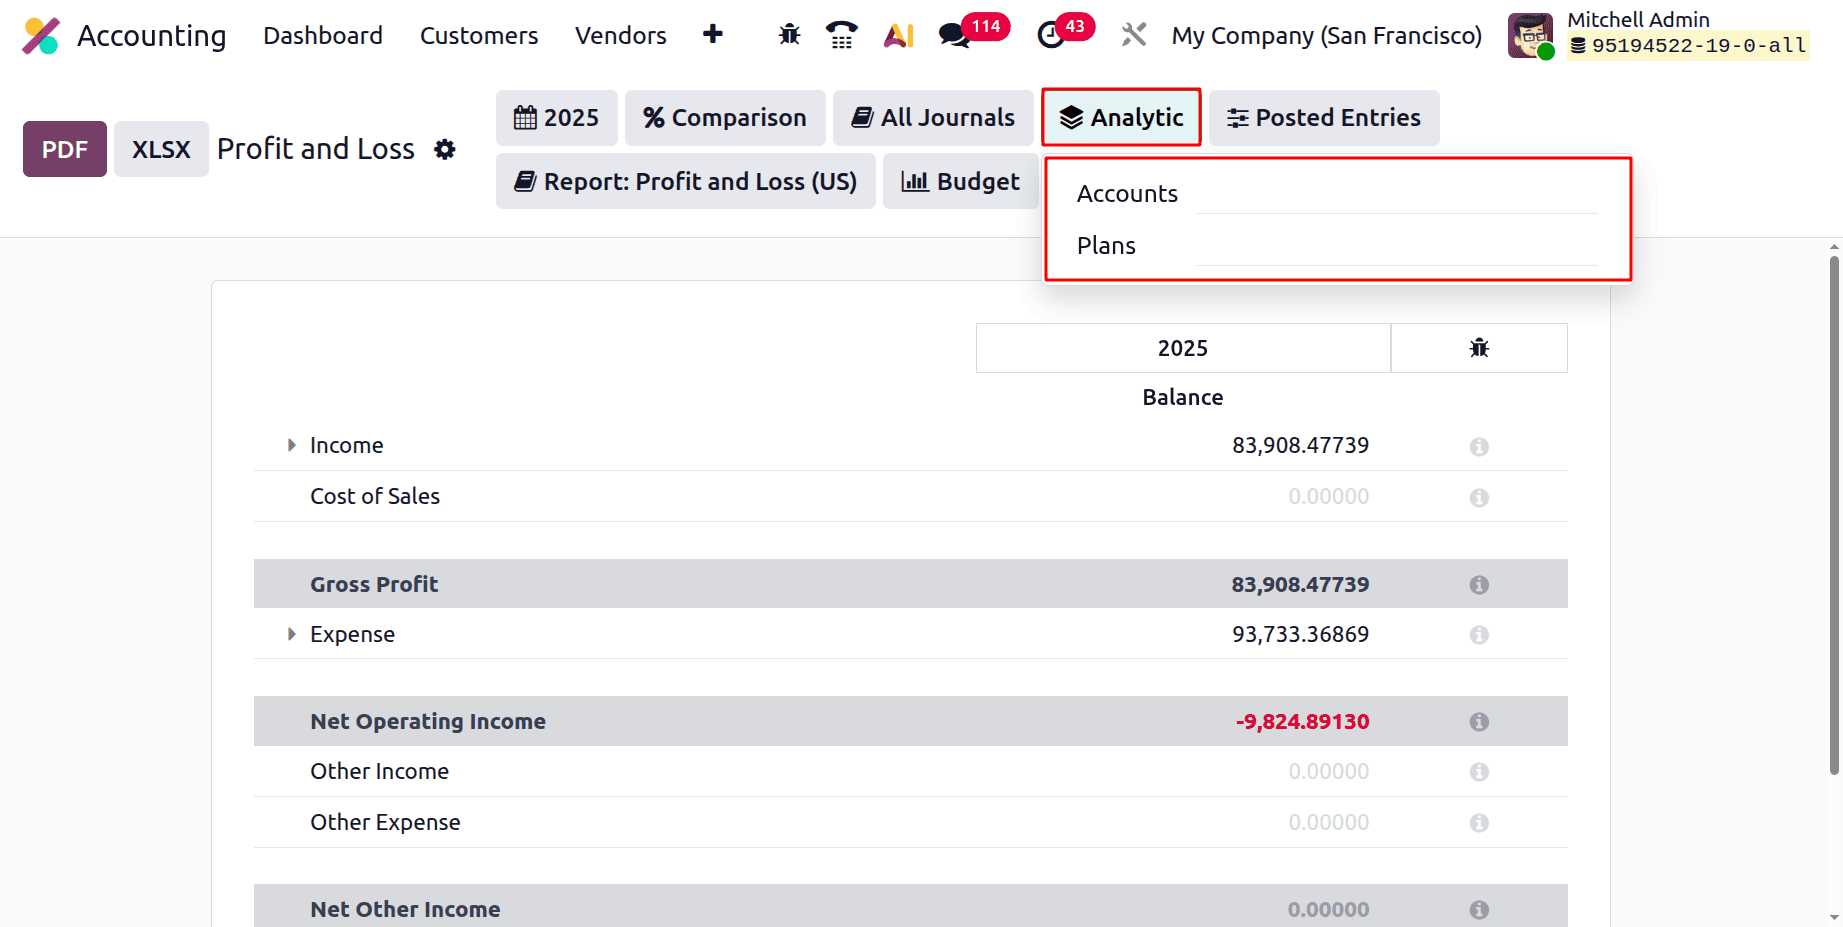
Next is Analytic Filter. The users can filter the report based on the Analytic Account and Analytic Plans.
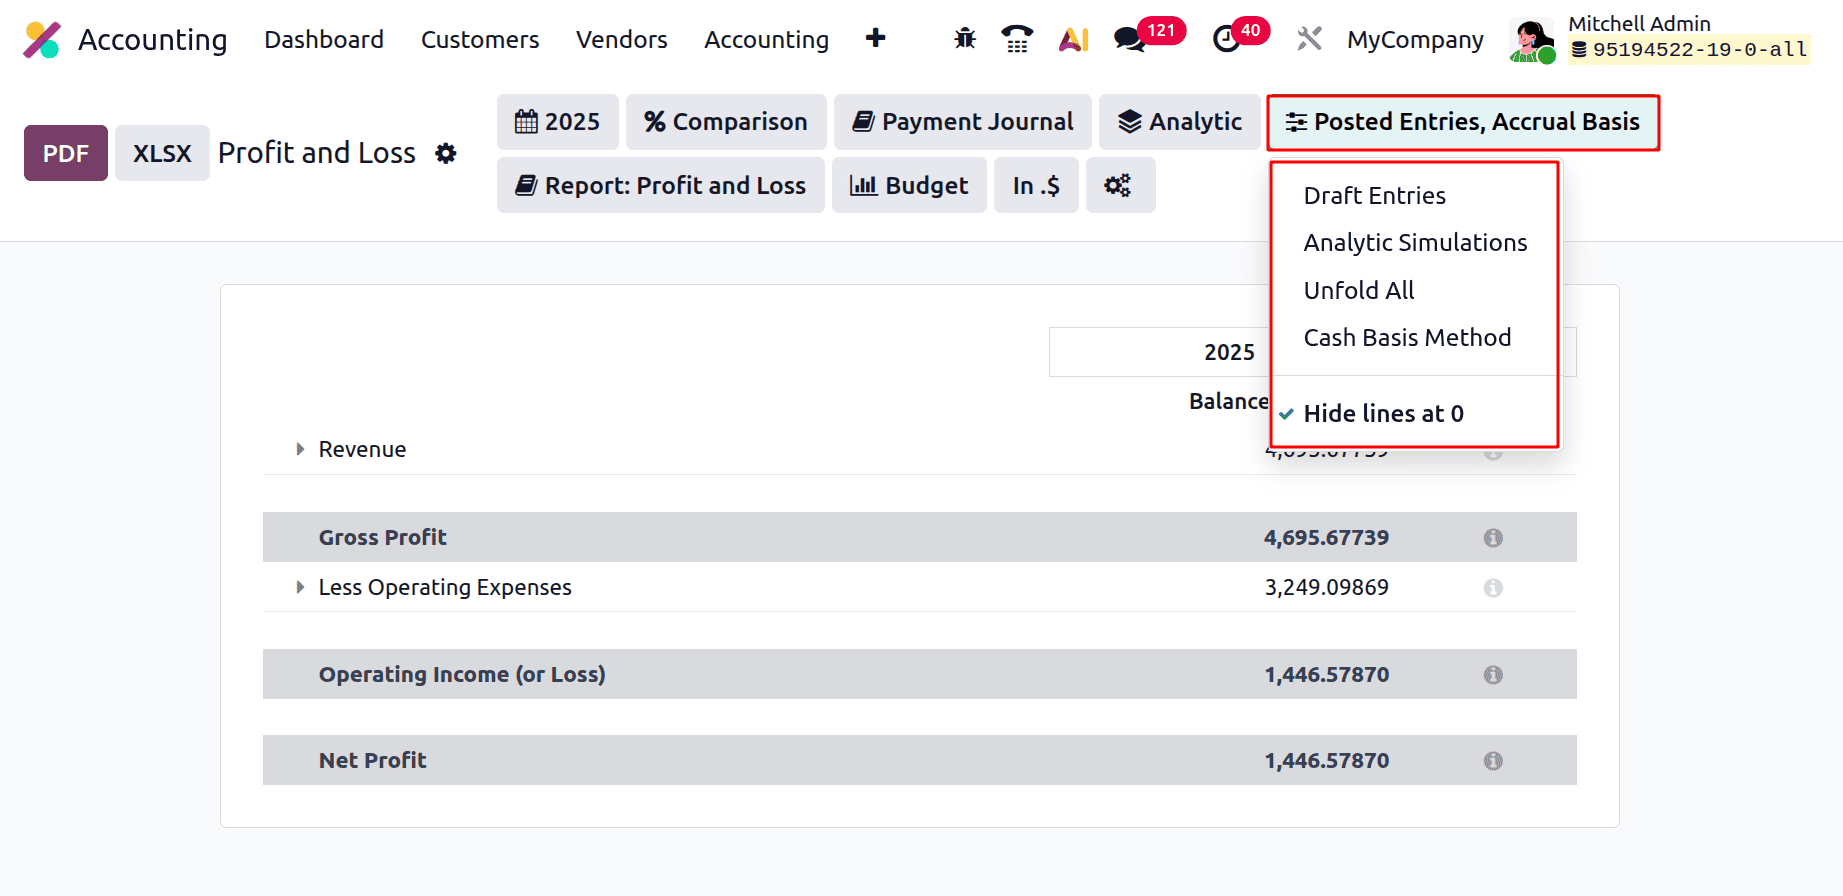
The report can be filtered based on Posted Entries, Draft Entries, and Analytic Simulations. Then they can easily unfold the lines by choosing Unfold All. From the report, the lines with zero value can be hidden by enabling the Hides lines at 0. From there, the users can filter the report based on the Accrual Basis, and Cash Basis Method.
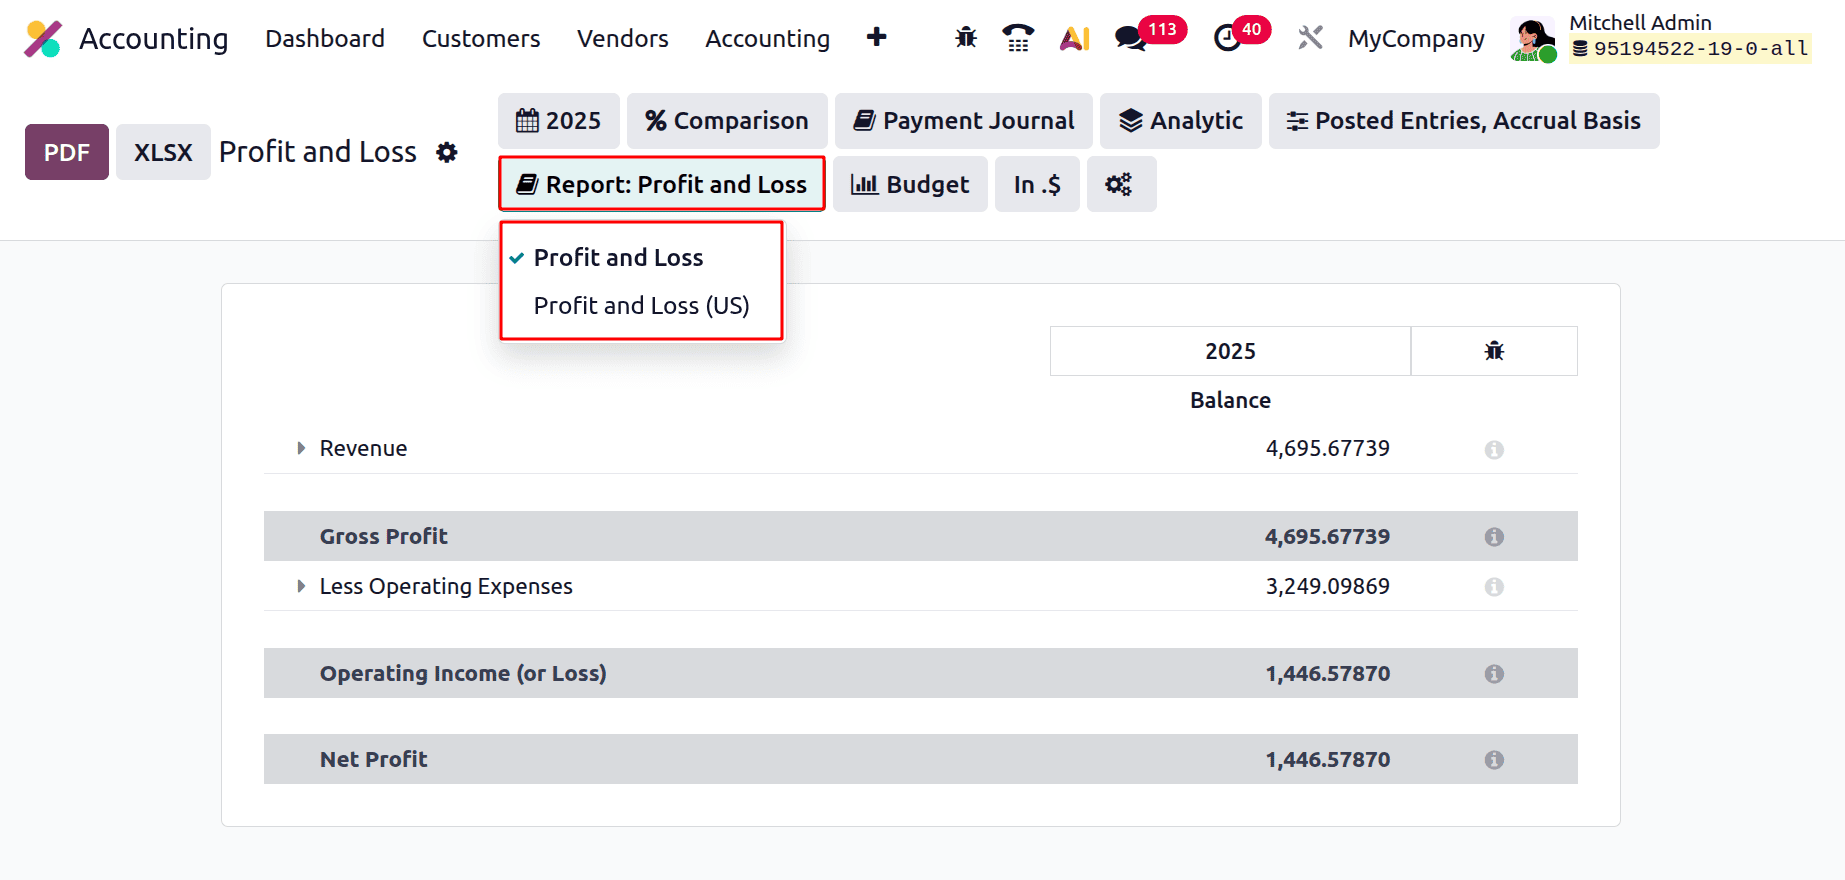
The Report filter contains two options: one is Profit and Loss Report, and the other is the Profit and Loss Report (US).
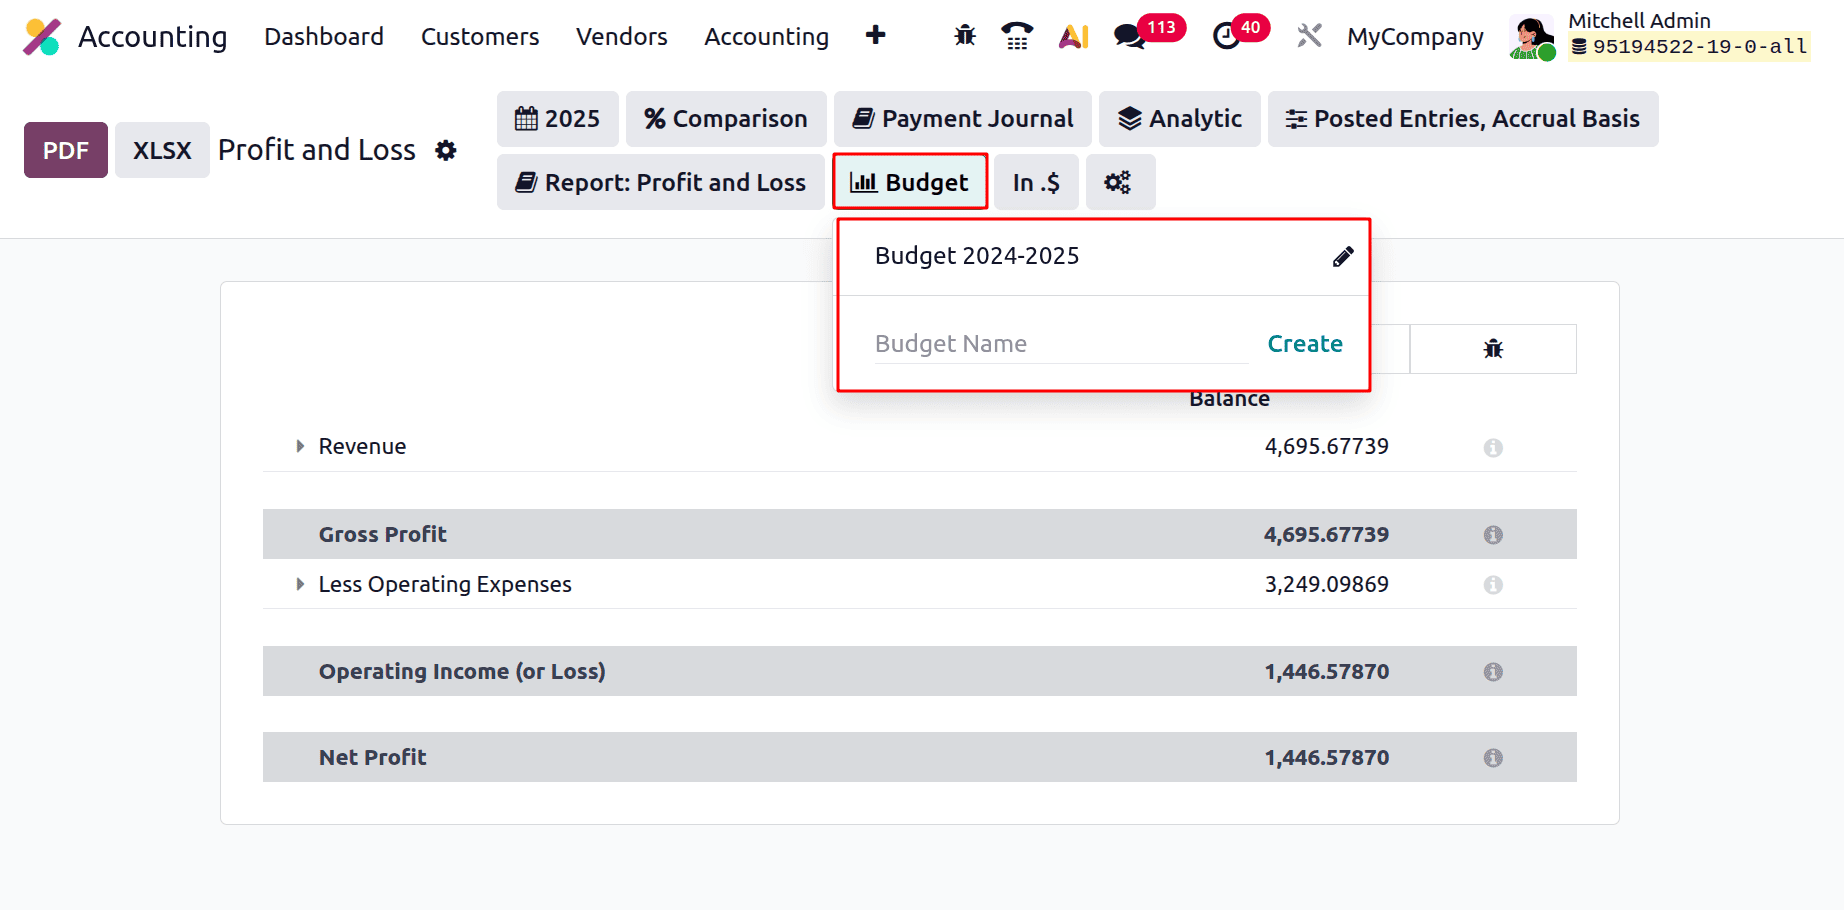
Next is the Budget filter. The report can be filtered based on all the created budgets inside the company. So it is possible by using the Budget filter.
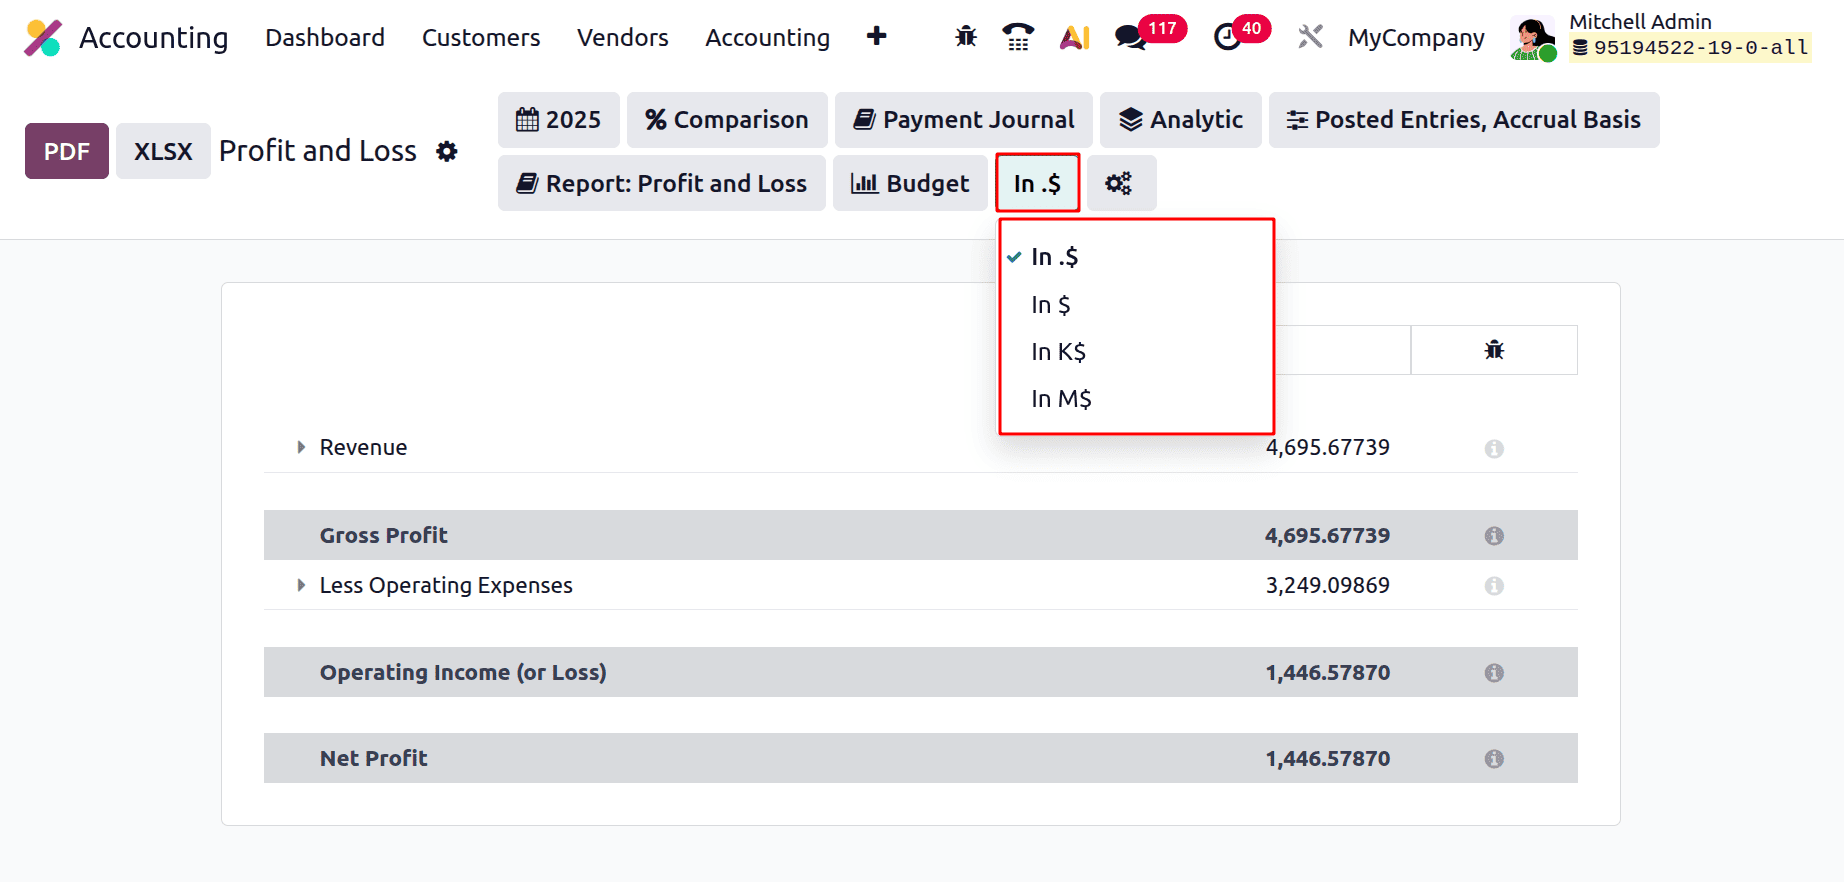
The Profit and Loss report's amounts are displayed in full currency units when they are in $ or In. Large numbers are easier to read in K$ since the sums are shown in thousands. M$ indicates that the sums are shown in millions, giving a high-level overview of financial information. The $ symbol always denotes the currency used by your business, which isn't always US dollars.
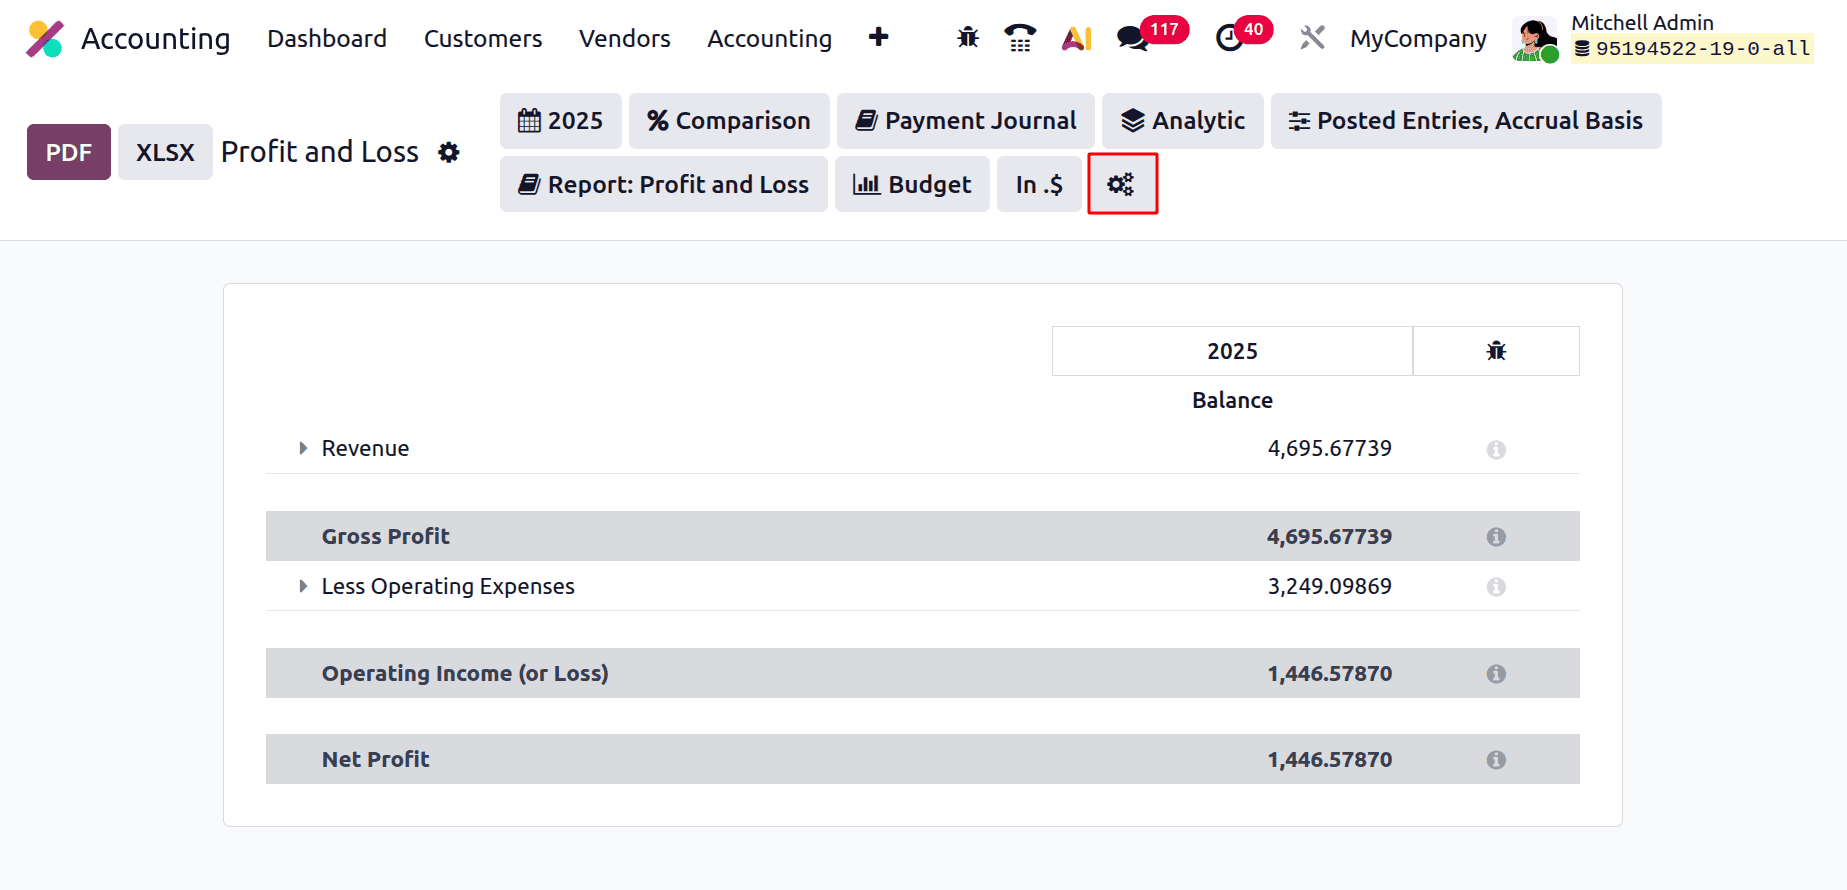
The next icon is to choose the Accounting report. The report will help the user to customize the Profit and Loss report.
Understanding the definitions of significant financial words as they are used in the system is crucial to comprehending the Profit and Loss report in Odoo 19. These key terms are broken down below, along with an explanation of how Odoo tracks, computes, and displays them in the report:
Income: The overall earnings from the company's main business operations, like the sale of goods or services, are referred to as revenue in Odoo 19. Point-of-sale transactions, sales orders, and invoices all automatically record this information. These transactions post entries into designated income accounts, which are then combined and displayed in the P&L report, depending on how your accounting and sales modules are configured.
Gross Profit: The Cost of Goods Sold (COGS) is subtracted from the total revenue in Odoo to determine gross profit. Purchasing data and stock valuation, if real-time inventory valuation is enabled, are used to calculate the COGS number. It provides information about the company's primary profitability before deducting secondary costs like marketing or administration.
Operating Income: The company's earnings from regular business activities are displayed in operating income. It is calculated in Odoo by deducting operating costs from gross profit, including as salary, office rent, and depreciation. These costs are automatically connected to the appropriate expenditure accounts in the Chart of Accounts after being documented by purchase invoices, journal entries, or the employee expense module.
Cost of Sales: This part, which is often referred to as the Cost of Revenue, comprises the direct expenses related to providing goods or services. These are automatically filled in by supplier bills, inventory value layers, and stock movements in Odoo. The costs are recorded in real time if perpetual inventory value is enabled, guaranteeing that the P&L appropriately represents current operating expenditures.
Expenses: All indirect costs necessary to operate the business, like marketing, utilities, employee salaries, and professional services, are included in Odoo expenses. Usually, buy journals or other miscellaneous entries are used to document these in expense accounts. Accurate reporting is ensured by correctly configuring the default accounts and account tags in goods and vendors.
Depreciation: The Asset Management module in Odoo is used to manage depreciation. Odoo automatically creates depreciation entries over the course of a fixed asset's useful life based on the selected depreciation method (e.g., straight-line or falling balance) whenever the asset is produced and verified, such as machinery or furniture. The P&L's depreciation line then shows these planned journal entries.
Net Profit: After all incomes and expenses have been deducted, the ultimate result shown in the profit and loss statement is called net profit. This figure is computed in Odoo using all uploaded entries for the chosen reporting period. It is a crucial metric for assessing performance, choosing investments, or creating future budgets since it shows the company's true profit or loss.
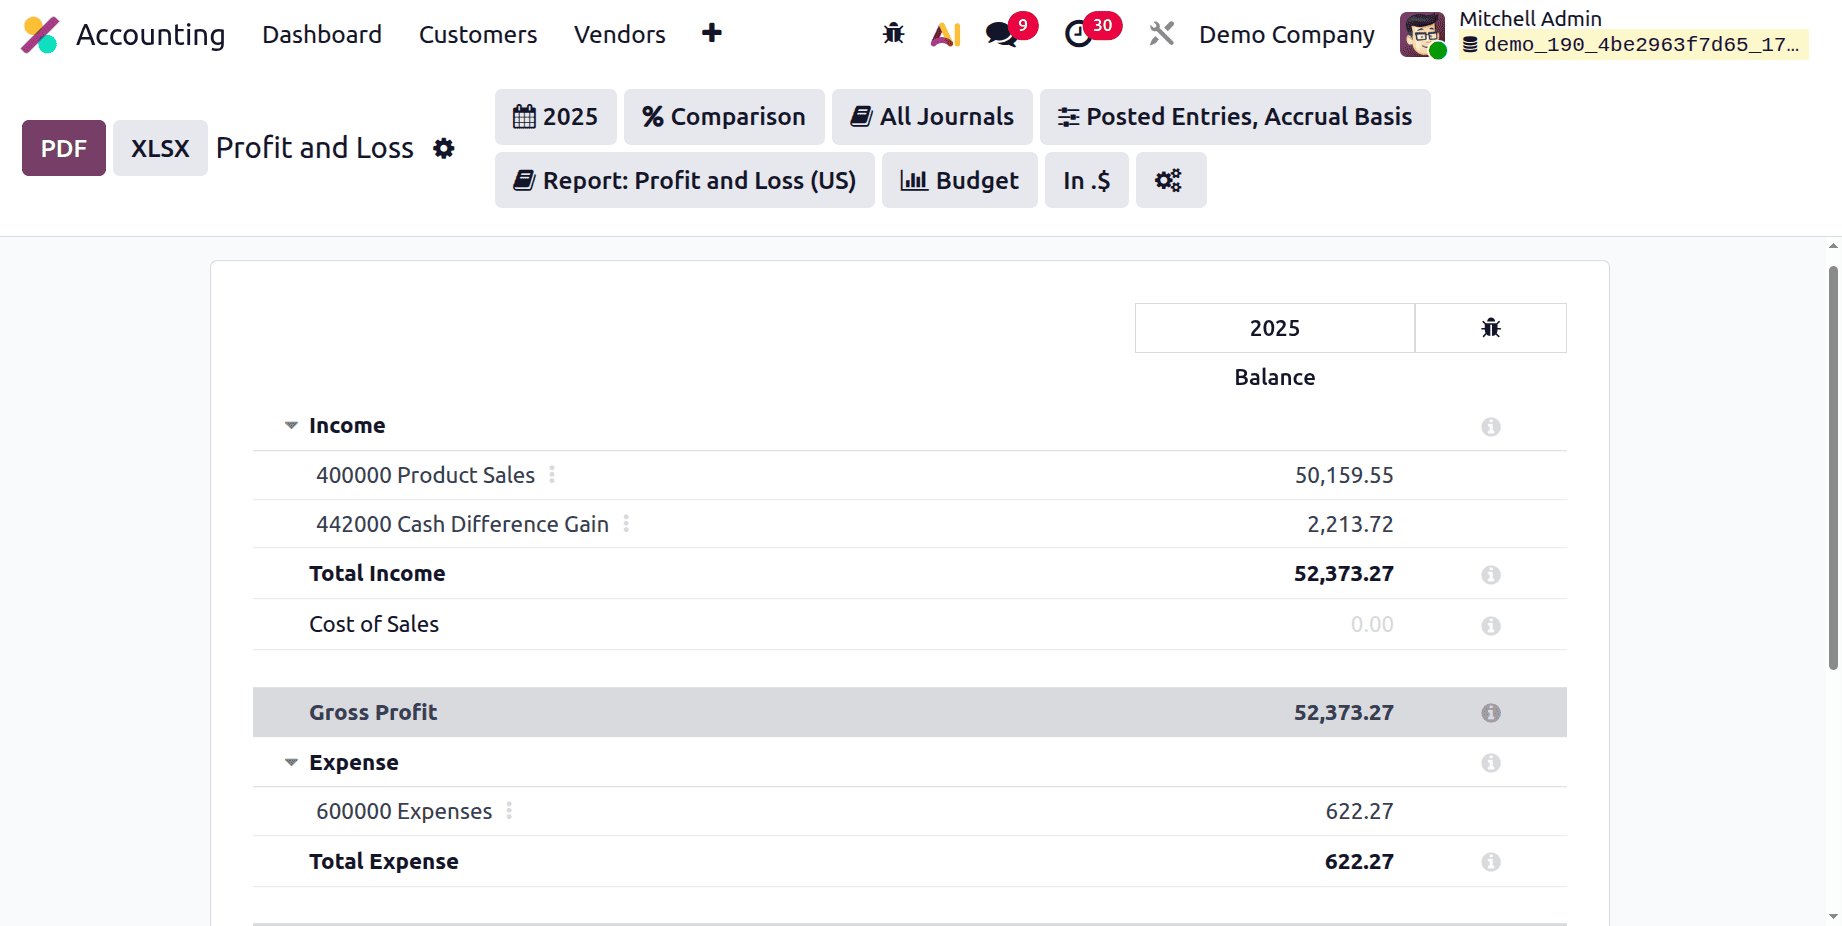
The Profit and Loss report in Odoo 19 has a well-organized, categorized format. Revenue data, which comprises the entire amount of money the company has made from its main business activities, including selling goods or providing services, is shown at the top of the report. The cost of goods sold, which comprises costs directly associated with the manufacturing or acquisition of such goods and services, is then displayed. Odoo determines the gross profit by deducting the cost of products sold from the revenue, providing a quick indication of the operational profitability of the business.
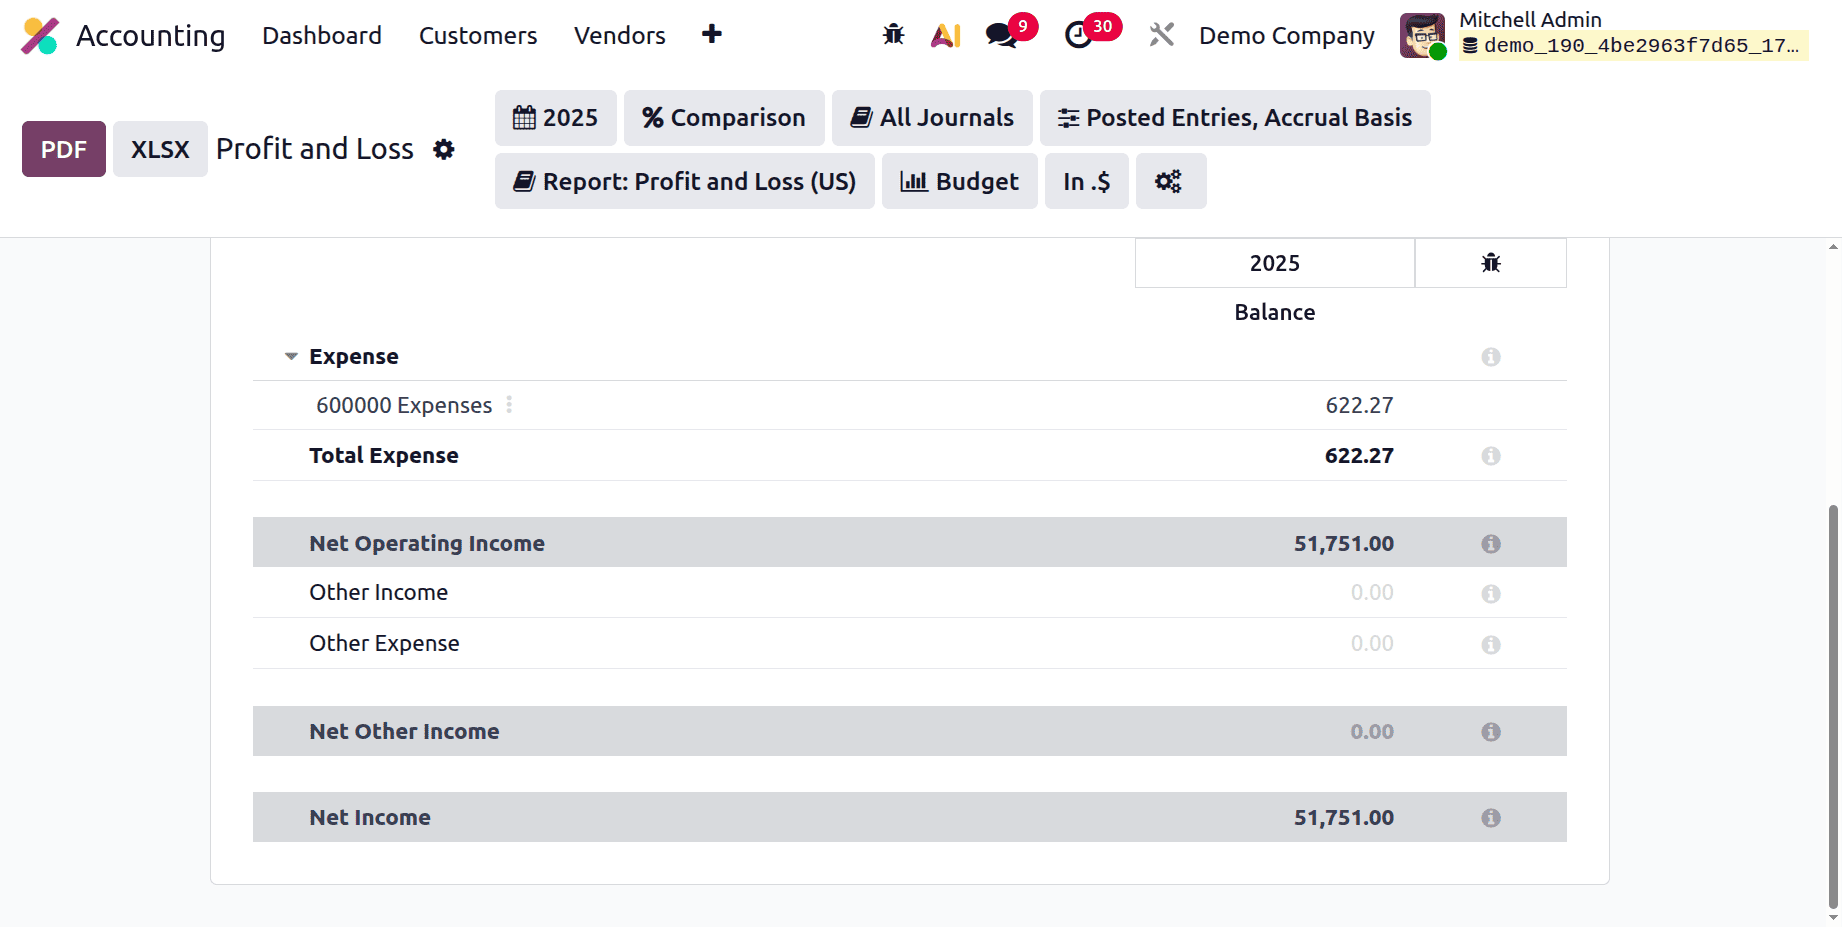
Users can examine the company's operating income further down the report, which is calculated by taking into account regular operating costs, including utilities, office rent, employee pay, and depreciation. These numbers provide information on how well a business is running its internal operations. Interest income and foreign exchange fluctuations are examples of additional revenue or other expenses that are not directly related to the core business.
The most important metric, the net profit or loss, which is determined by deducting all costs from total revenue, is placed at the bottom of the report. In the end, this number indicates if the company is profitable for the chosen time frame.
While enabling the developer mode, the formulas can be visible as shown below.
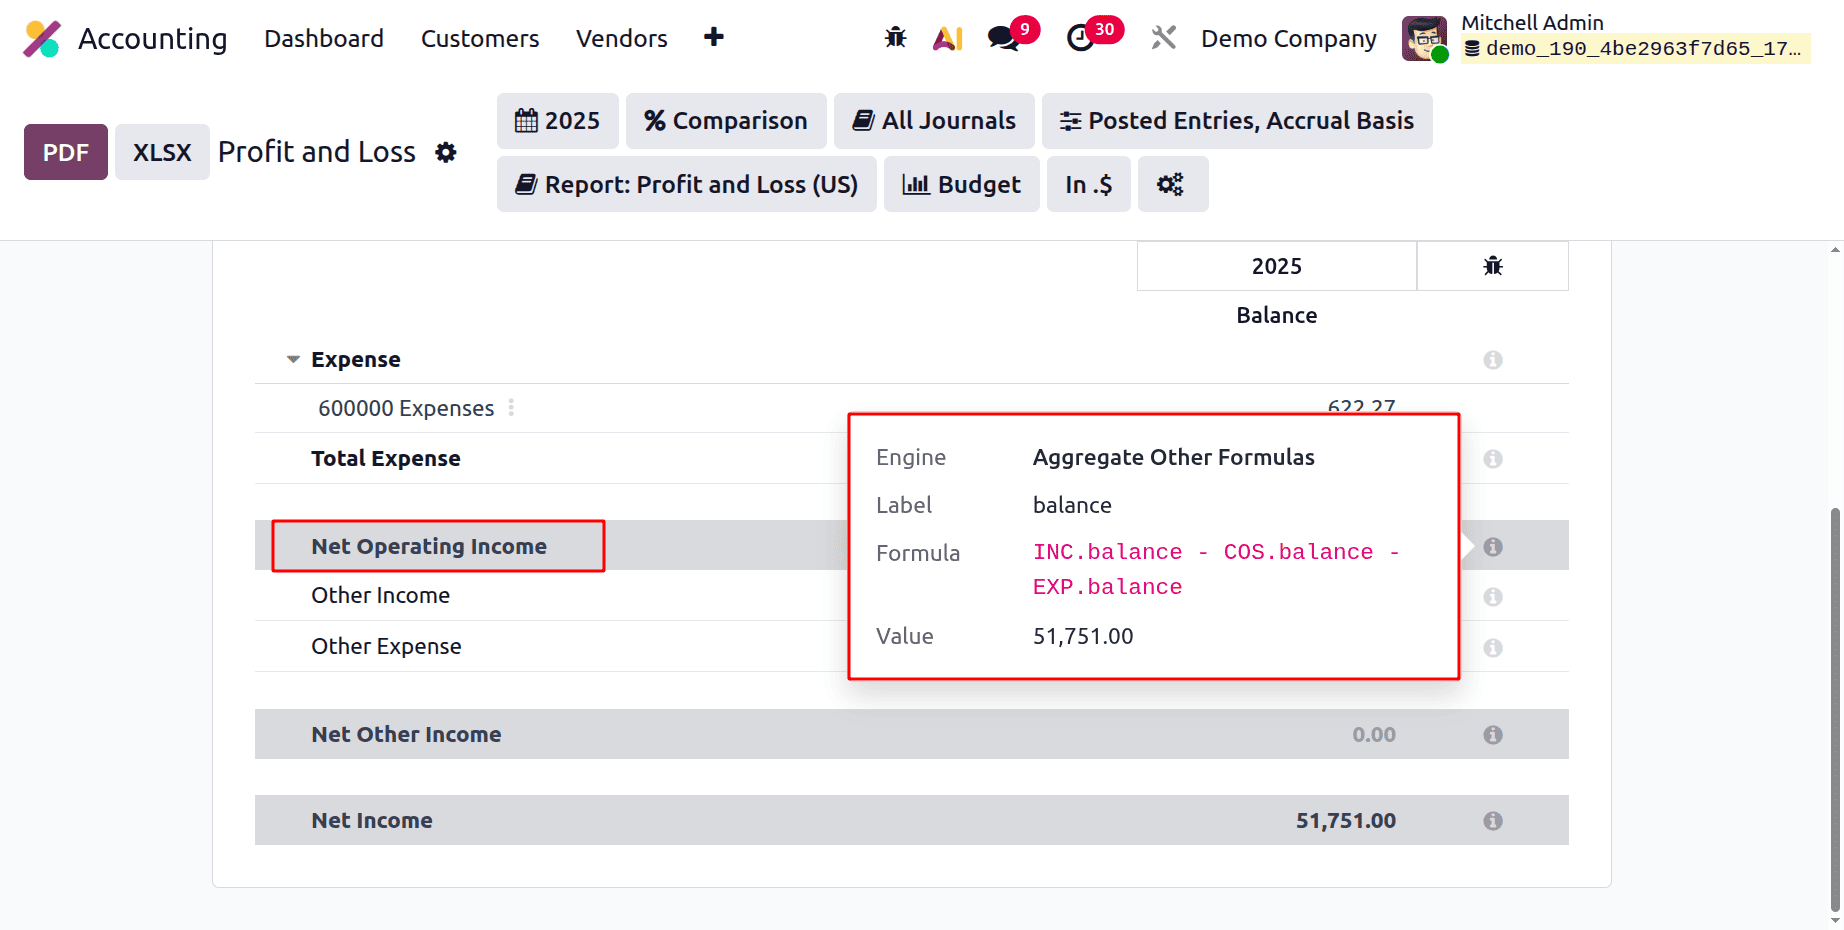
Net Operating Income = INC.balance - COS.balance - EXP.balance
- INC.balance = total income/revenue
- COS.balance = cost of sales (direct costs of producing goods/services)
- EXP.balance = operating expenses (overheads, admin, marketing, etc.)
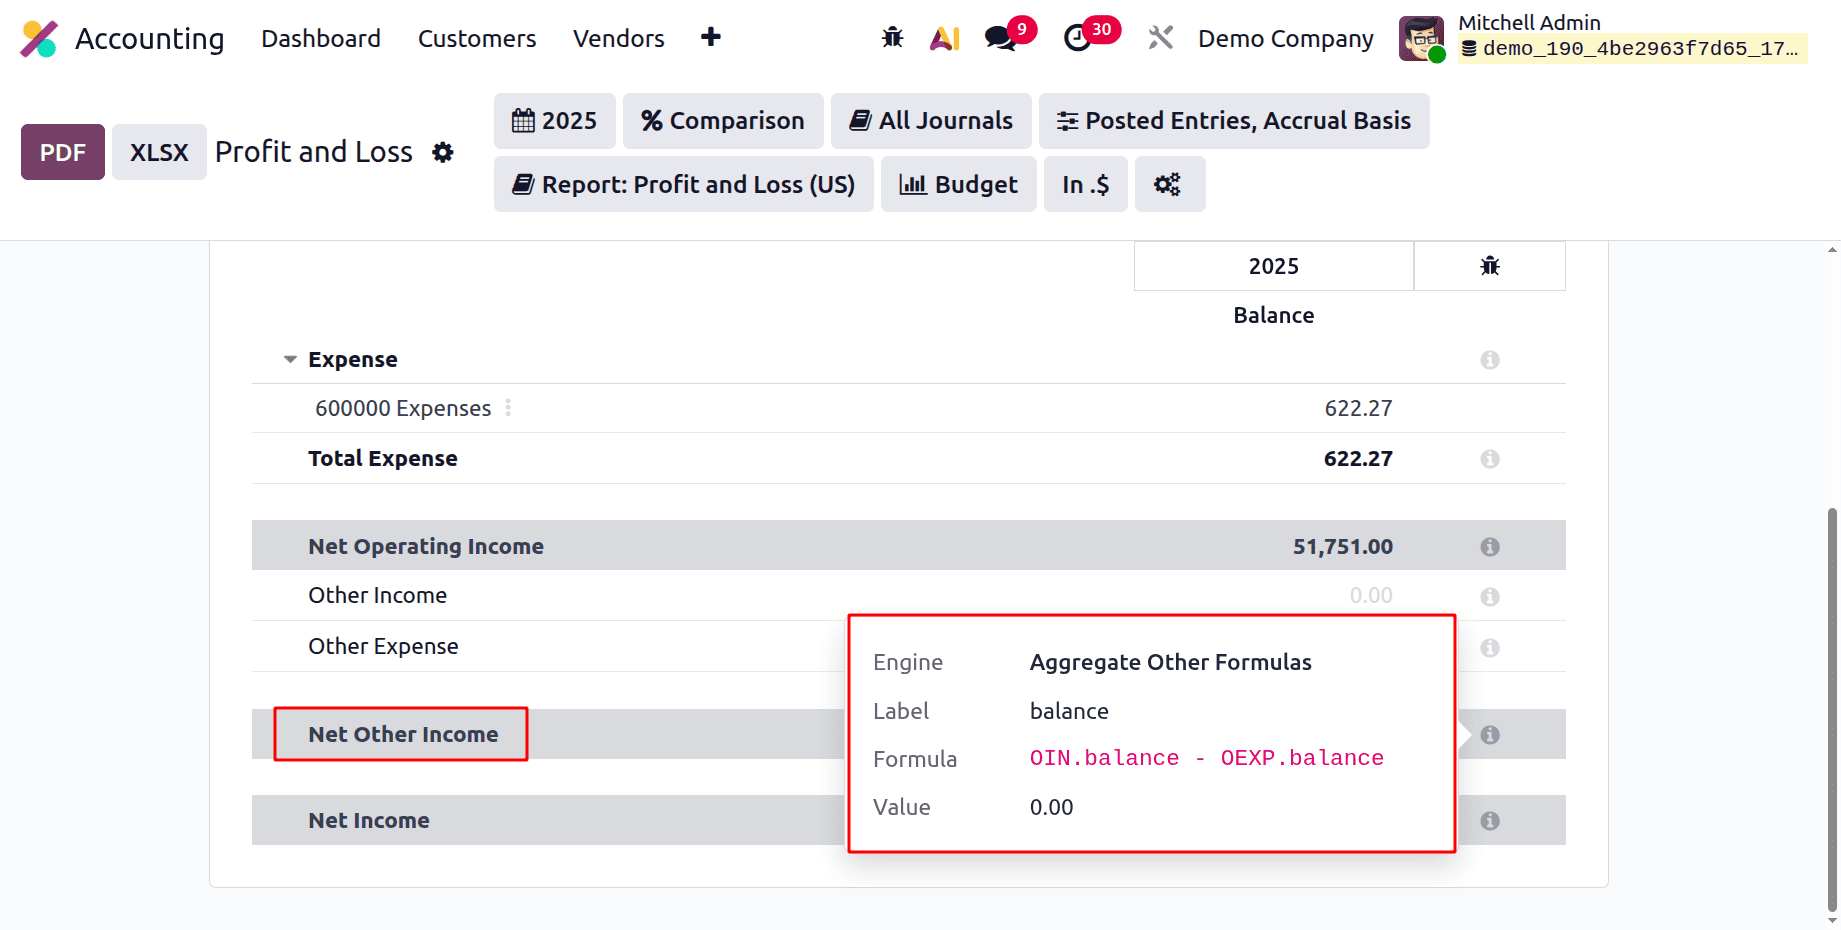
Net Other Income = OIN.balance - OEXP.balance
Where:
- OIN.balance = other income (non-operating income such as interest received, asset sale gains, etc.)
- OEXP.balance = other expenses (non-operating expenses such as interest paid, losses, penalties, etc.)
This amount is typically added to operating profit to arrive at profit before tax.
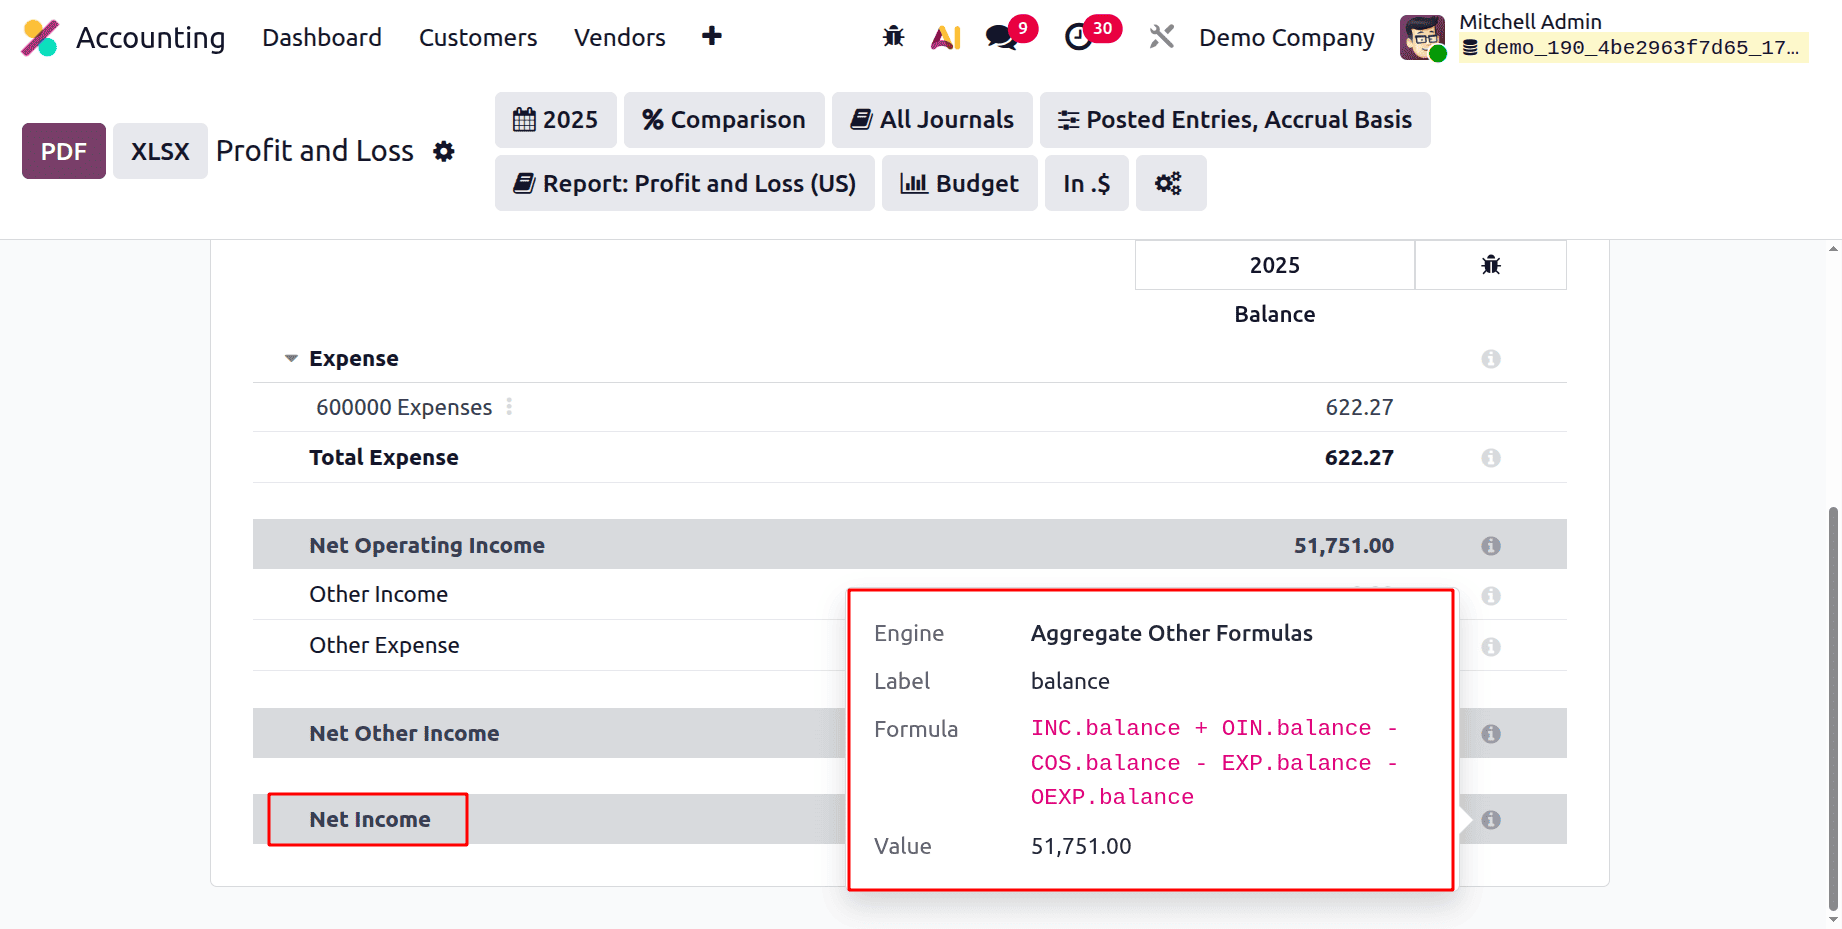
Net Income = INC.balance + OIN.balance - COS.balance - EXP.balance - OEXP.balance
- INC.balance = operating income (revenue)
- OIN.balance = other / non-operating income
- COS.balance = cost of sales
- EXP.balance = operating expenses
- OEXP.balance = other / non-operating expenses
Odoo's Profit and Loss report has several real-world uses. Finance teams use it to be ready for audits, tax returns, and planning, and business managers use it to assess operational effectiveness. The P&L statements are examined by shareholders and investors to evaluate the company's potential for growth and financial sustainability. Additionally, future company strategy planning and resource allocation optimization are based on the insights obtained from these studies.
To sum up, Odoo 19's Profit and Loss report provides a comprehensive, adaptable, and easy-to-use method of tracking a business's financial performance. Odoo gives businesses the tools they need to precisely monitor profitability by generating real-time reports, comparing past data, applying sophisticated filters, and exporting professional papers. Odoo 19's P&L capability provides the visibility and control required for solid financial management, regardless of your goals—improving margins, controlling expenses, or just adhering to financial reporting regulations.
To read more about How to Analyse Company Profit and Loss Reports in Odoo 18 Accounting module, refer to our blog How to Analyse Company Profit and Loss Reports in Odoo 18 Accounting module.