Odoo 18 is the latest version of the open-source ERP platform, offering a fully integrated suite of business applications to manage and automate various organizational processes. With improved usability, performance, and flexibility, it supports a wide range of functions including sales, inventory, accounting, manufacturing, HR, and CRM, all within a modular and unified system. Suitable for businesses of all sizes, Odoo 18 allows for easy customization through built-in tools or advanced development, while ensuring seamless integration, real-time collaboration, and scalability for efficient business management.
In this blog post, we'll delve into Views in the Odoo 18 Helpdesk ticket views.
To support various management styles and improve overall visibility, the module includes a wide range of intuitive ticket views:
- List View: Displays tickets in a structured table format for quick overview and sorting.
- Kanban View: Shows tickets as cards grouped by stage, ideal for tracking progress visually.
- Activity View: Highlights scheduled activities and follow-ups for each ticket.
- Pivot View: Provides a customizable summary table for analyzing ticket data using dimensions and measures.
- Graph View: Presents ticket statistics through bar, line, or pie charts for visual insights.
- Cohort View: Analyzes ticket resolution trends over time to measure team performance and efficiency.
In the Helpdesk module, tickets are organized under the "Tickets" menu, where users can access both "My Tickets" and "All Tickets" views. The "My Tickets" section specifically displays only those tickets assigned to the currently logged-in user, allowing helpdesk agents to easily focus on their own workload. On the other hand, the "All Tickets" view provides access to all helpdesk tickets in the system, depending on user access rights, enabling managers or team leads to monitor and manage the overall ticket flow.
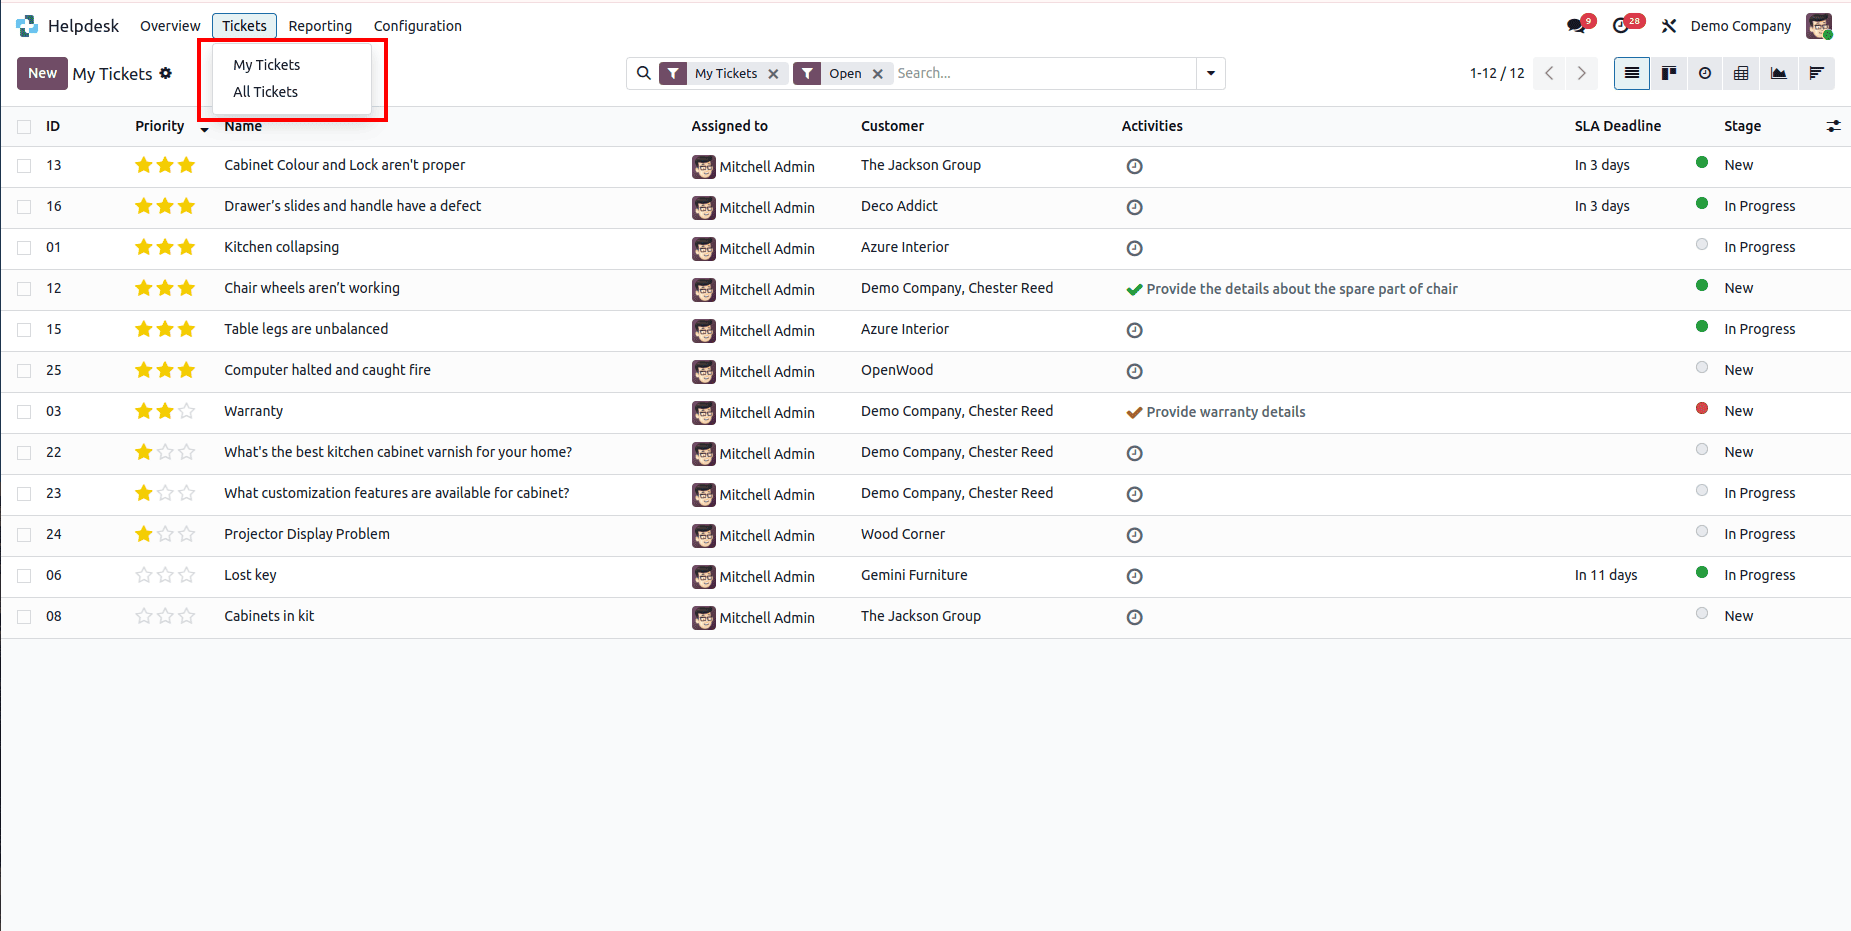
MY TICKETS
Both "My Tickets" and "All Tickets" sections in the Helpdesk module provide access to the same set of views as described above. Let us first examine the views available under the "My Tickets" section.
1. LIST VIEW
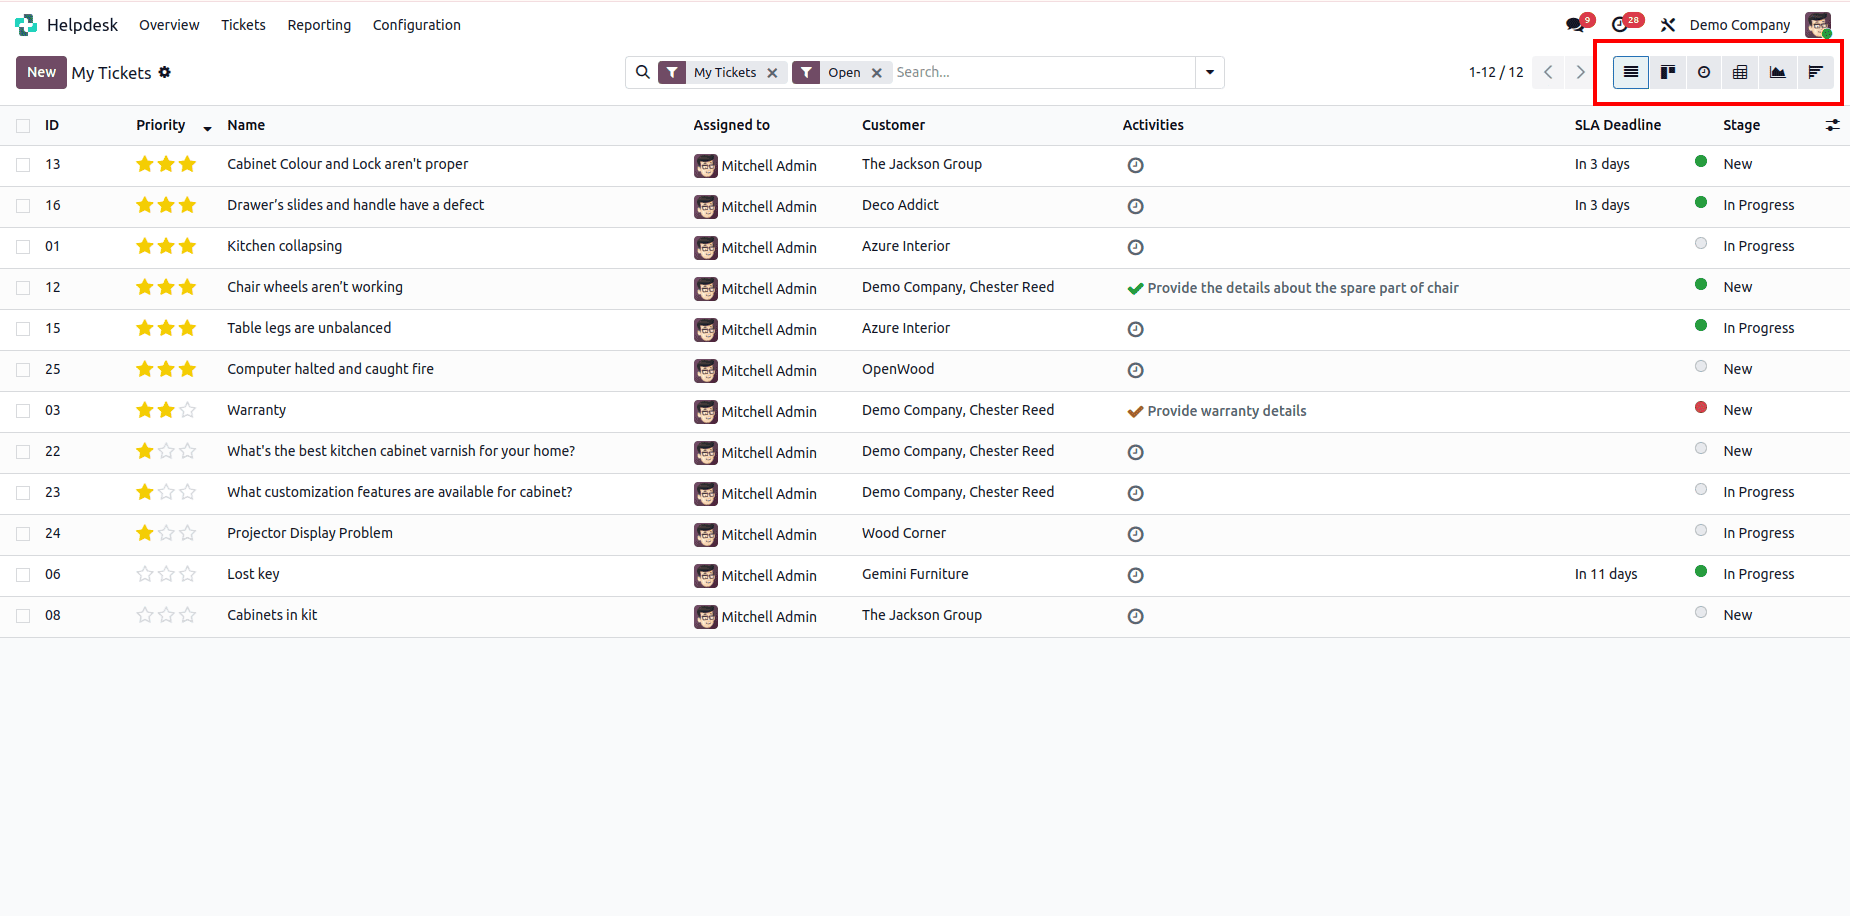
The List View in the Helpdesk module, when accessed through the "My Tickets" section, provides the current user with a structured and detailed overview of their assigned tickets in a tabular format. By default, this view is filtered to display only "My Tickets" and "Open Tickets", helping users stay focused on their active responsibilities. It presents key information such as Priority, Ticket Name, Assigned To, Customer, Scheduled Activities, SLA Deadline, and Stage, offering quick access to relevant details at a glance. With support for sorting, grouping, and filtering, the list view enables users to efficiently manage and prioritize their tickets based on urgency, upcoming deadlines, or progress status.
2. KANBAN VIEW
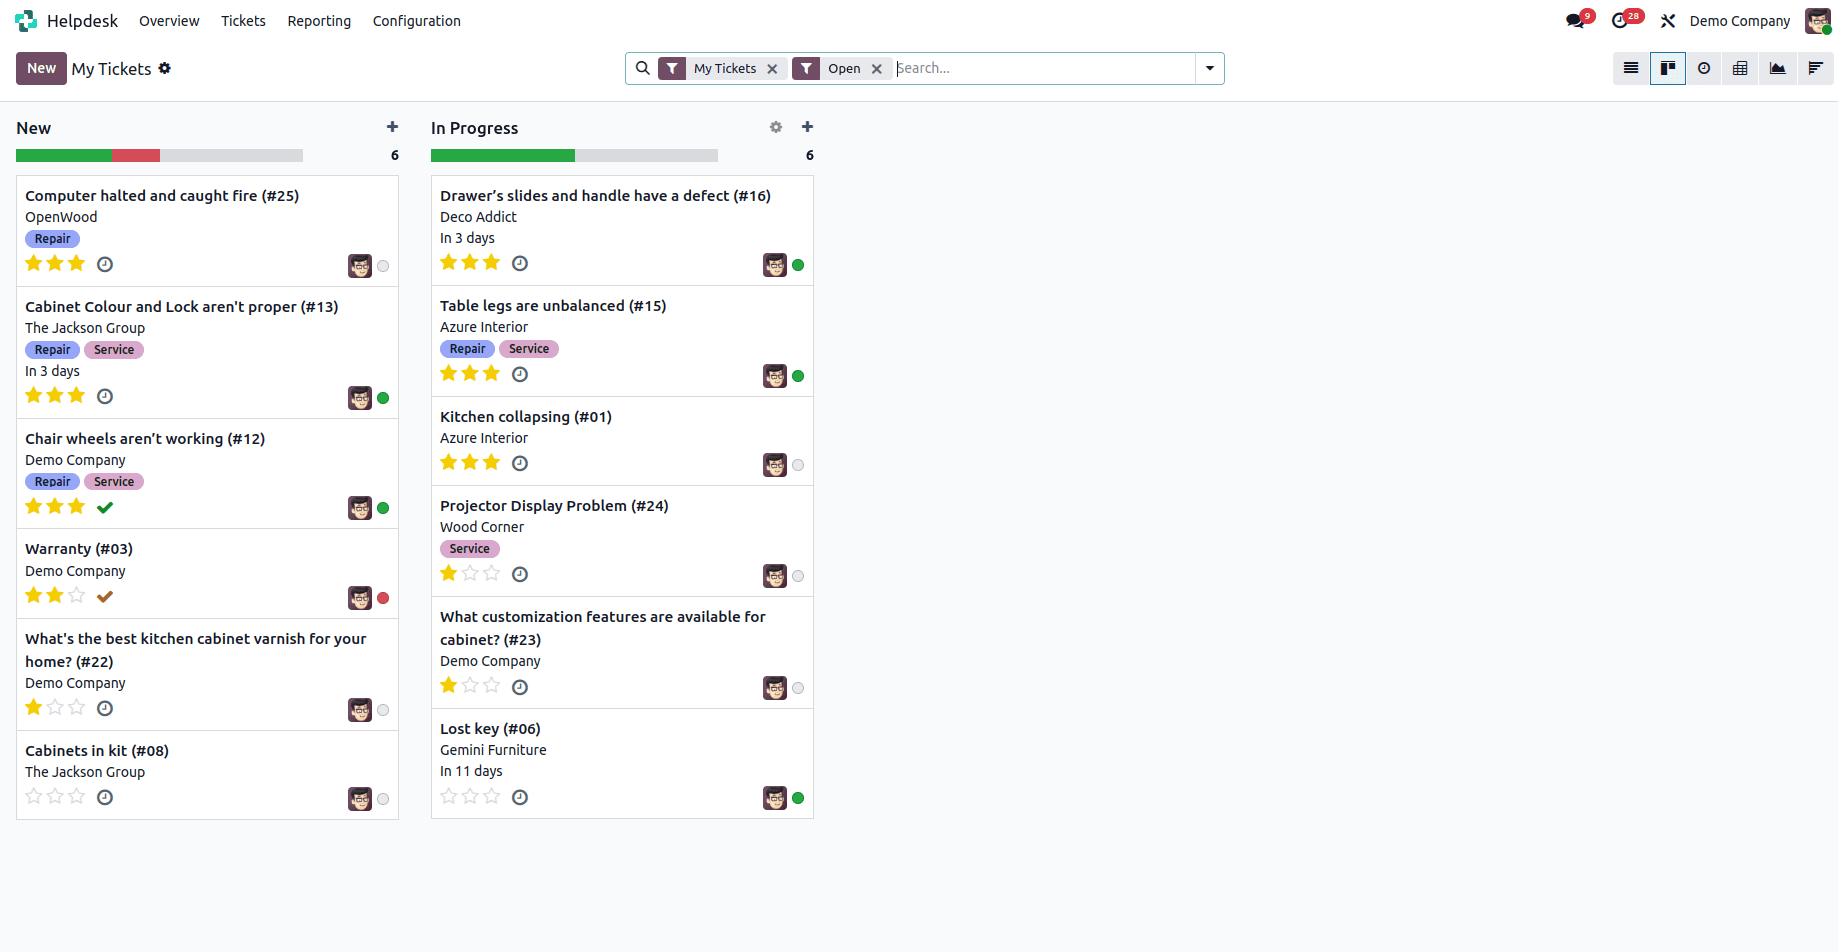
The Kanban View in the Helpdesk module, when accessed through the "My Tickets" section, offers a visually intuitive way for users to manage their own assigned tickets by displaying them as cards grouped under various stages such as "New", "In Progress", and other custom workflow stages. This layout gives the current user a clear overview of the status of their tickets and supports easy tracking of progress. A key feature of this view is the ability to drag and drop tickets between stages, allowing users to update ticket statuses with minimal effort. Each card displays essential information including the ticket name, customer, tags, deadline, assigned person, and any scheduled activities, helping users efficiently assess and manage their individual workload. The Kanban view in this context is especially useful for agents who rely on a visual, stage-based workflow to organize their support tasks.
3. ACTIVITY VIEW
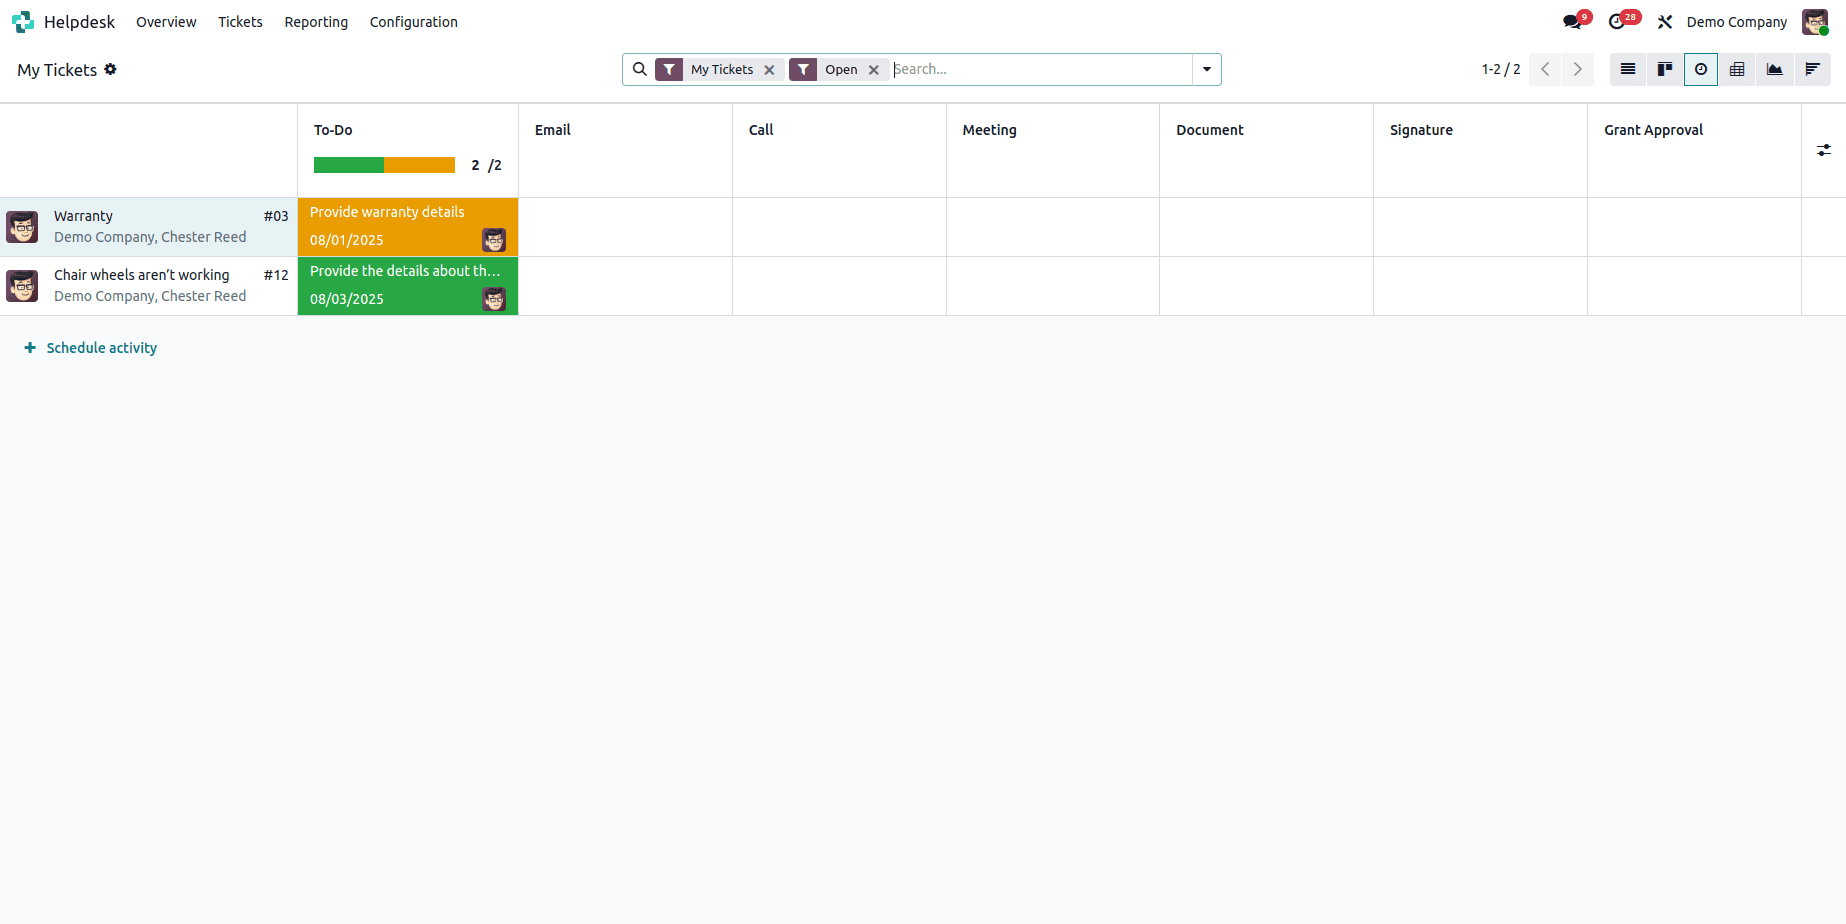
The Activity View in the Helpdesk module, when accessed through the "My Tickets" section, provides a focused interface for the current user to manage and track scheduled activities related to their assigned tickets. Activities are grouped by ticket name, making it easy for users to identify pending tasks and take necessary follow-up actions. Common activity types include To Do, Email, Call, Meeting, Document, Signature, and Grant Approval, covering a wide range of customer service needs. Each activity is color-coded based on its status—overdue, due today, or planned, enabling the user to quickly assess priorities. This view is particularly helpful for helpdesk agents to stay organized, meet deadlines, and ensure efficient handling of their own support tickets.
4. PIVOT VIEW
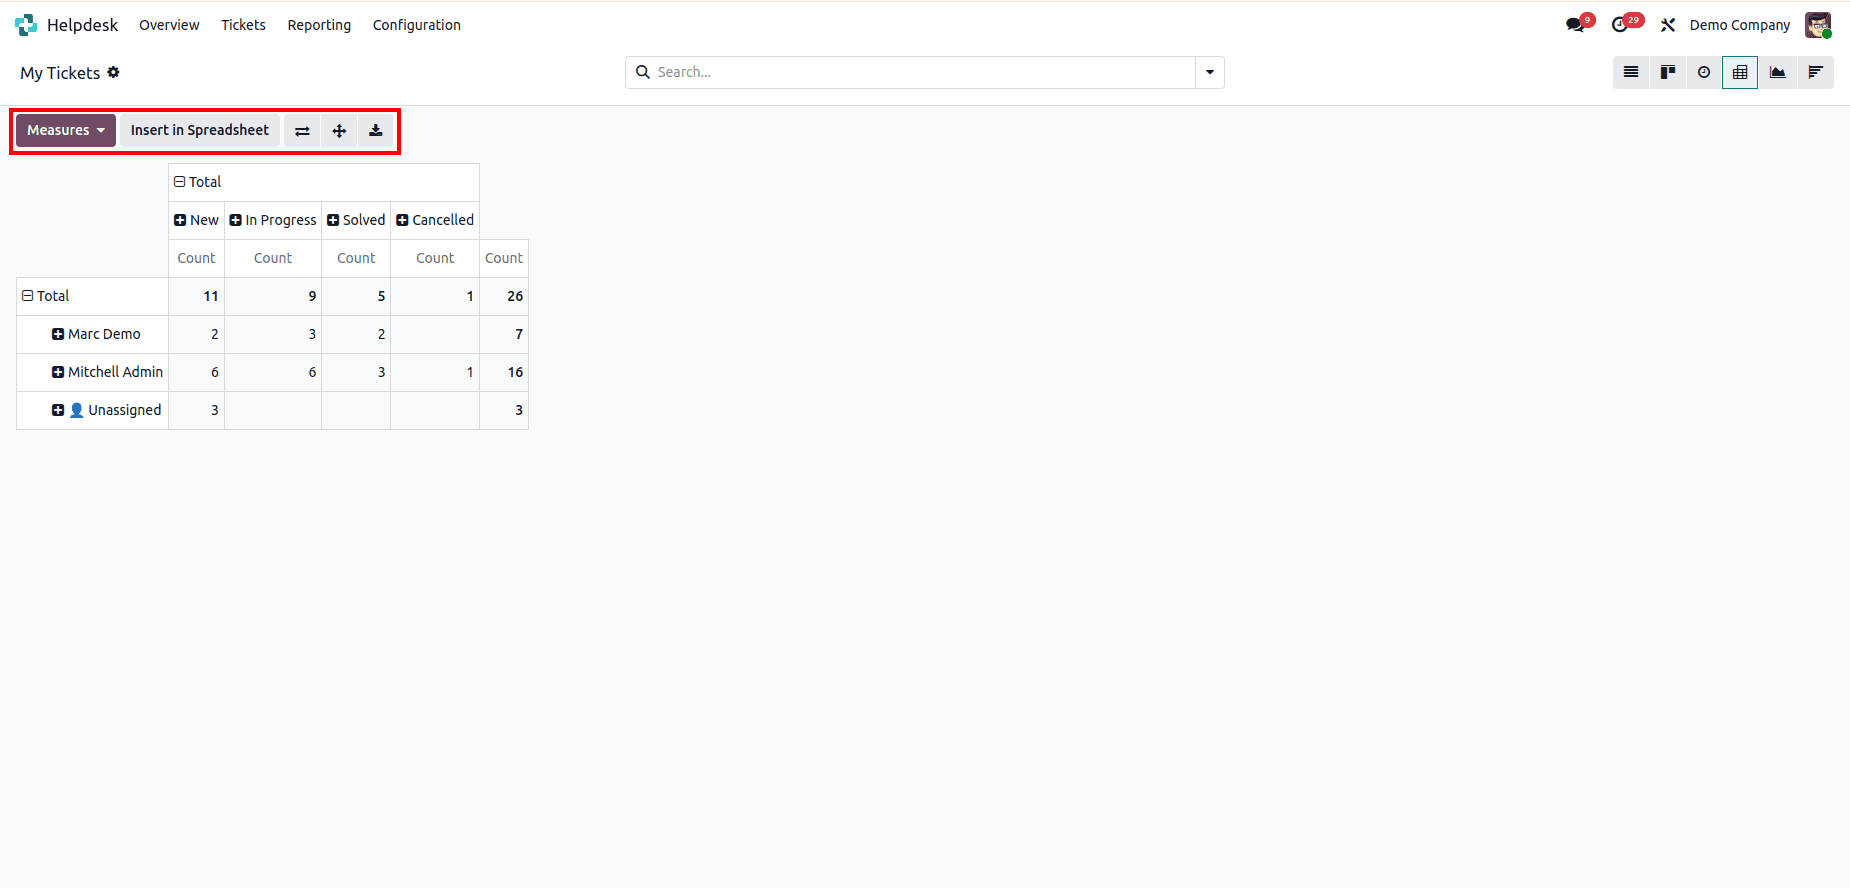
The Pivot View in the Helpdesk module, when accessed through the "My Tickets" section, offers a dynamic and customizable way for users to analyze data related specifically to their own assigned tickets. It provides two adjustable axes where the current user can add fields such as Assigned To, Helpdesk Team, Stage, Status, SLA, Tags, Priority, and Company to generate personalized reports. This flexibility enables users to gain meaningful insights into their individual workload and ticket handling performance.
Users can apply measures to calculate totals, averages, and other relevant metrics, making it easier to evaluate how their time and efforts are distributed across different tickets. This is particularly helpful for tracking personal performance, prioritization, and SLA adherence.
Additional features such as flipping axes, expanding all rows, downloading data in XLSX format, and inserting the pivot view into a spreadsheet further enhance its utility, allowing users to create detailed, data-driven summaries of their own support activities.
5. GRAPH VIEW
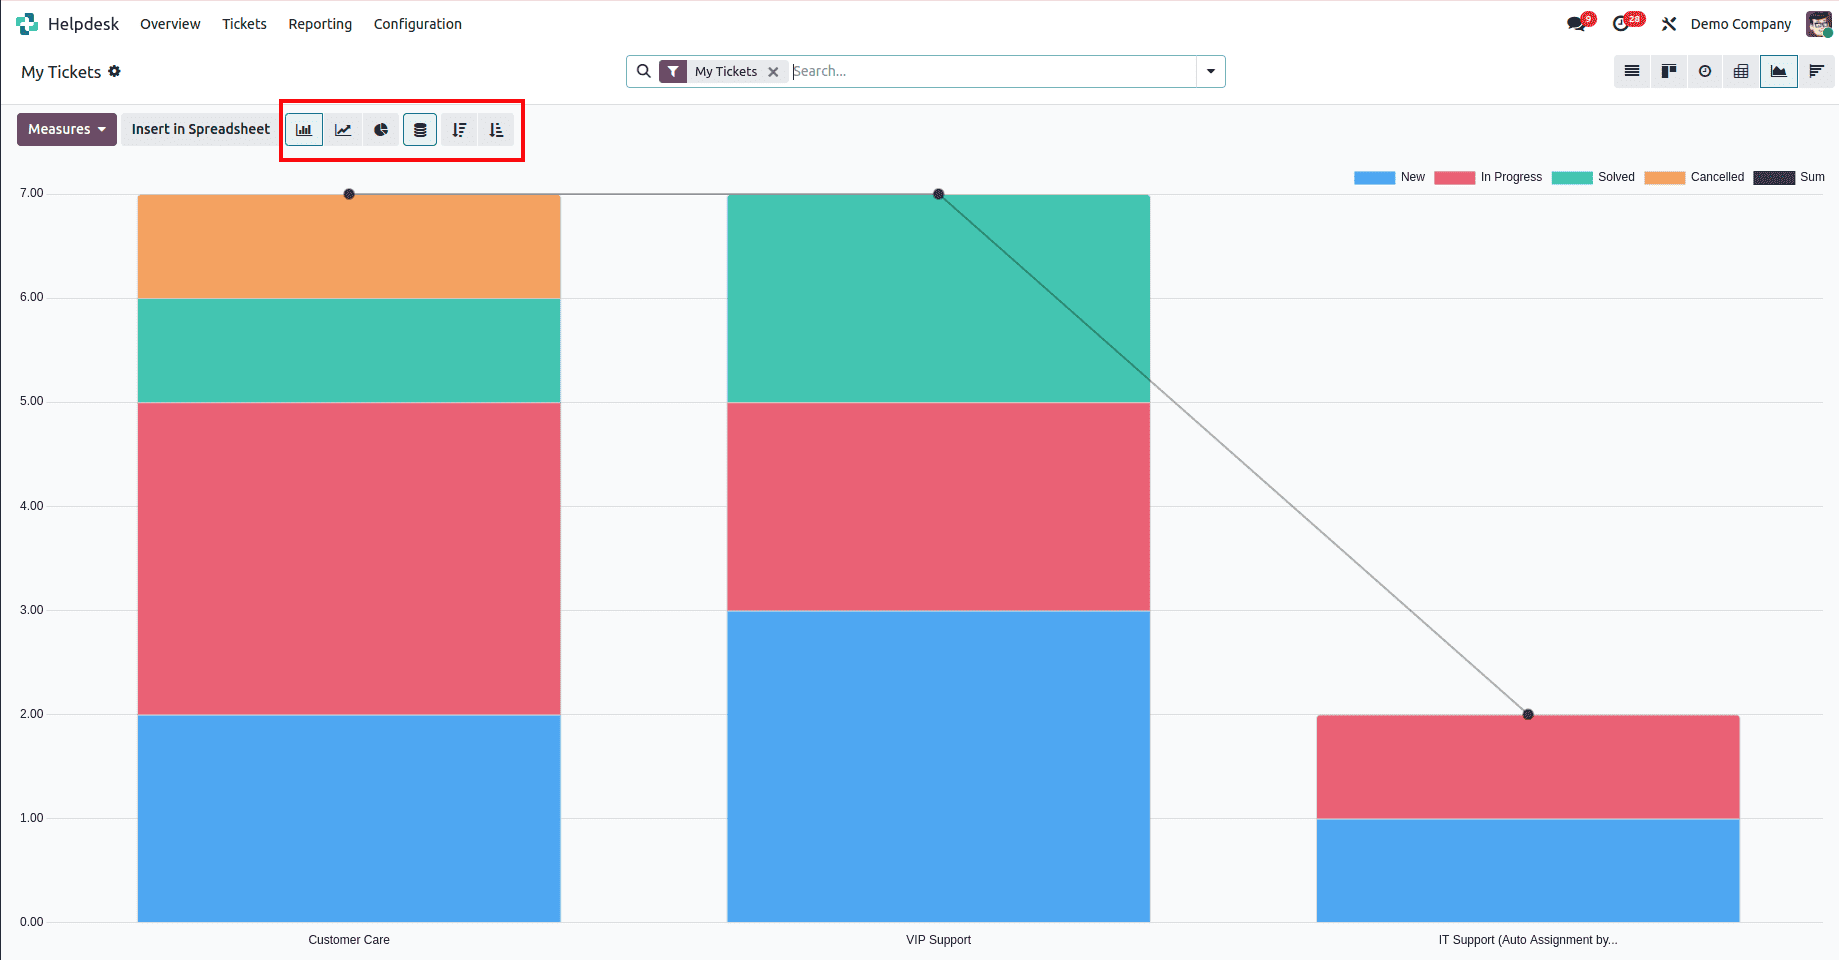
The Graph View in the Helpdesk module, when accessed through the "My Tickets" section, serves as a visual dashboard that offers a clear and concise overview of ticket data specifically related to the current user. It presents information using line, bar, and pie charts, helping users monitor their own ticket volume, resolution time, SLA performance, and workload distribution. Features like stacked bars, ascending/descending sorting, and color-coded segments enhance visual clarity and usability. Users can select from various measure options such as Ticket Count, Assigned Hours, Resolution Time, and SLA Deadline Compliance to gain insights into their personal performance. The view also supports filtering, grouping, and custom date ranges, allowing users to conduct in-depth analysis of their helpdesk activities and trends over time.
6. COHORT VIEW
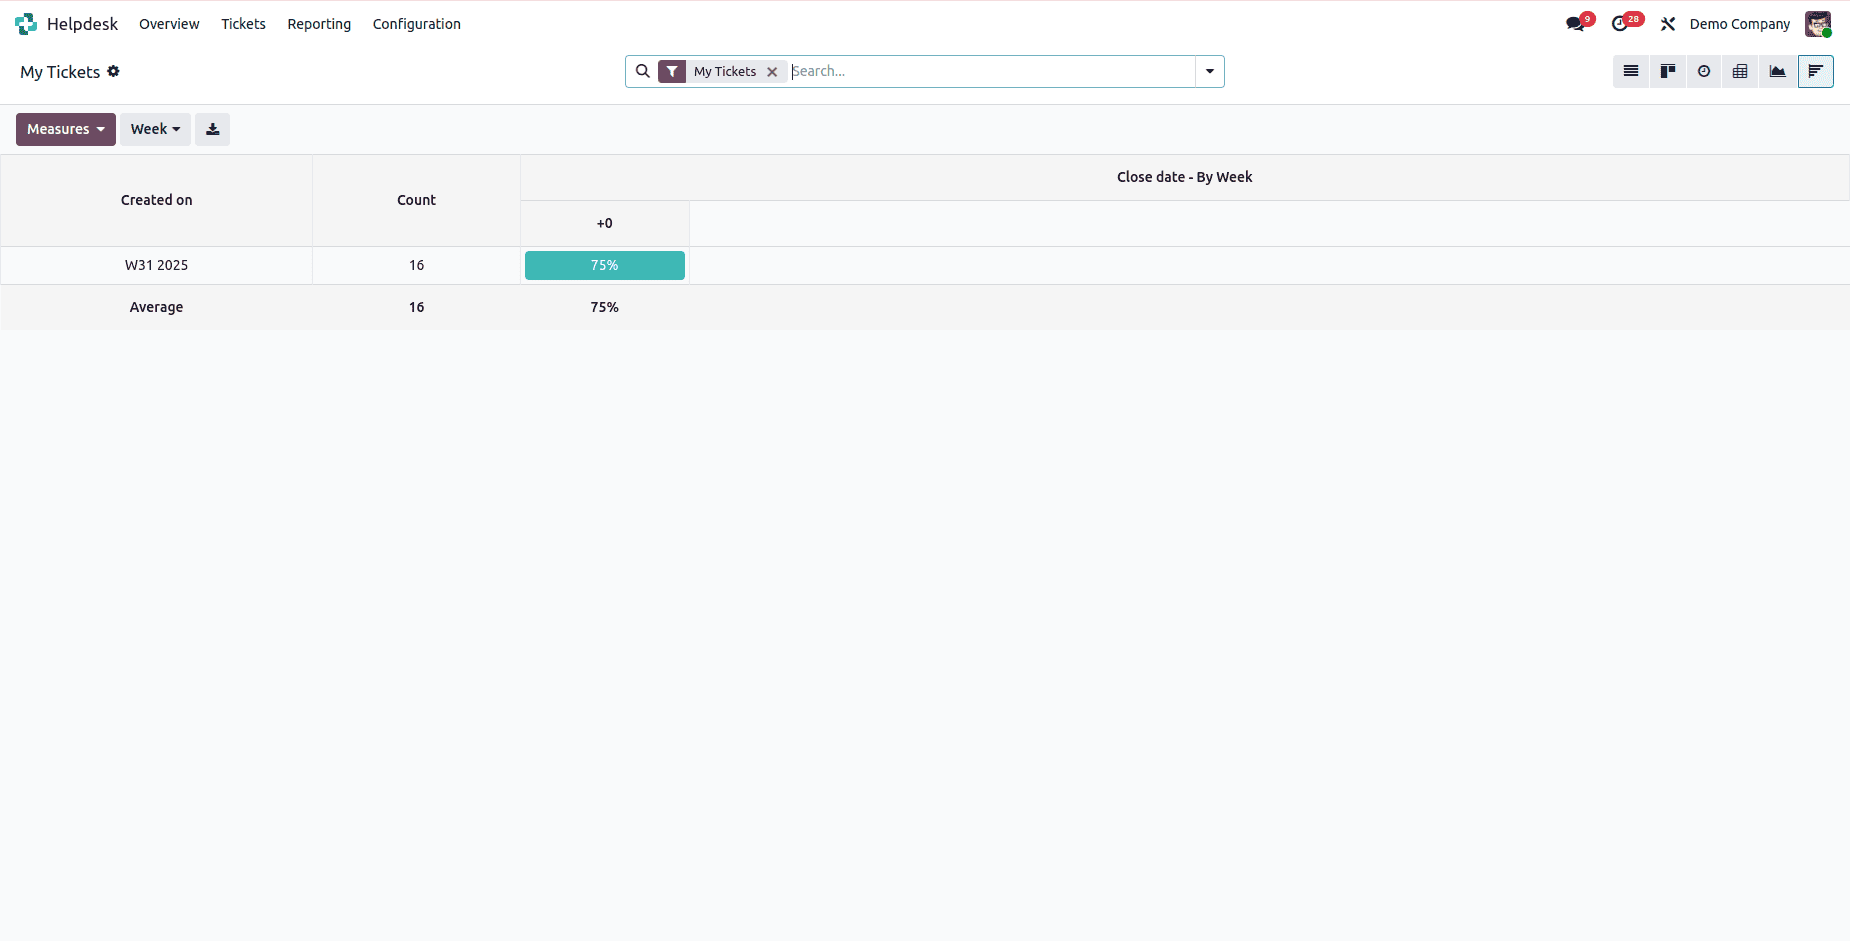
The Cohort View in the Helpdesk module, when accessed through the "My Tickets" section, is designed to analyze the life cycle of tickets specifically assigned to the current user over a defined time period. It groups tickets by their creation date—daily, weekly, or monthly—and tracks their progress, showing how many have been resolved or remain open after a certain number of days. This view provides valuable insights into the user's ticket resolution patterns, response efficiency, and overall personal performance, helping them identify areas for improvement and monitor the impact of their workflow over time. The Cohort View is particularly useful for agents who want to understand how effectively they are managing and closing their assigned support requests across different time frames.
ALL TICKETS
Now, let us examine the different views under the “All tickets” section. The views are similar. This just contains the data of all the users.
1. LIST VIEW
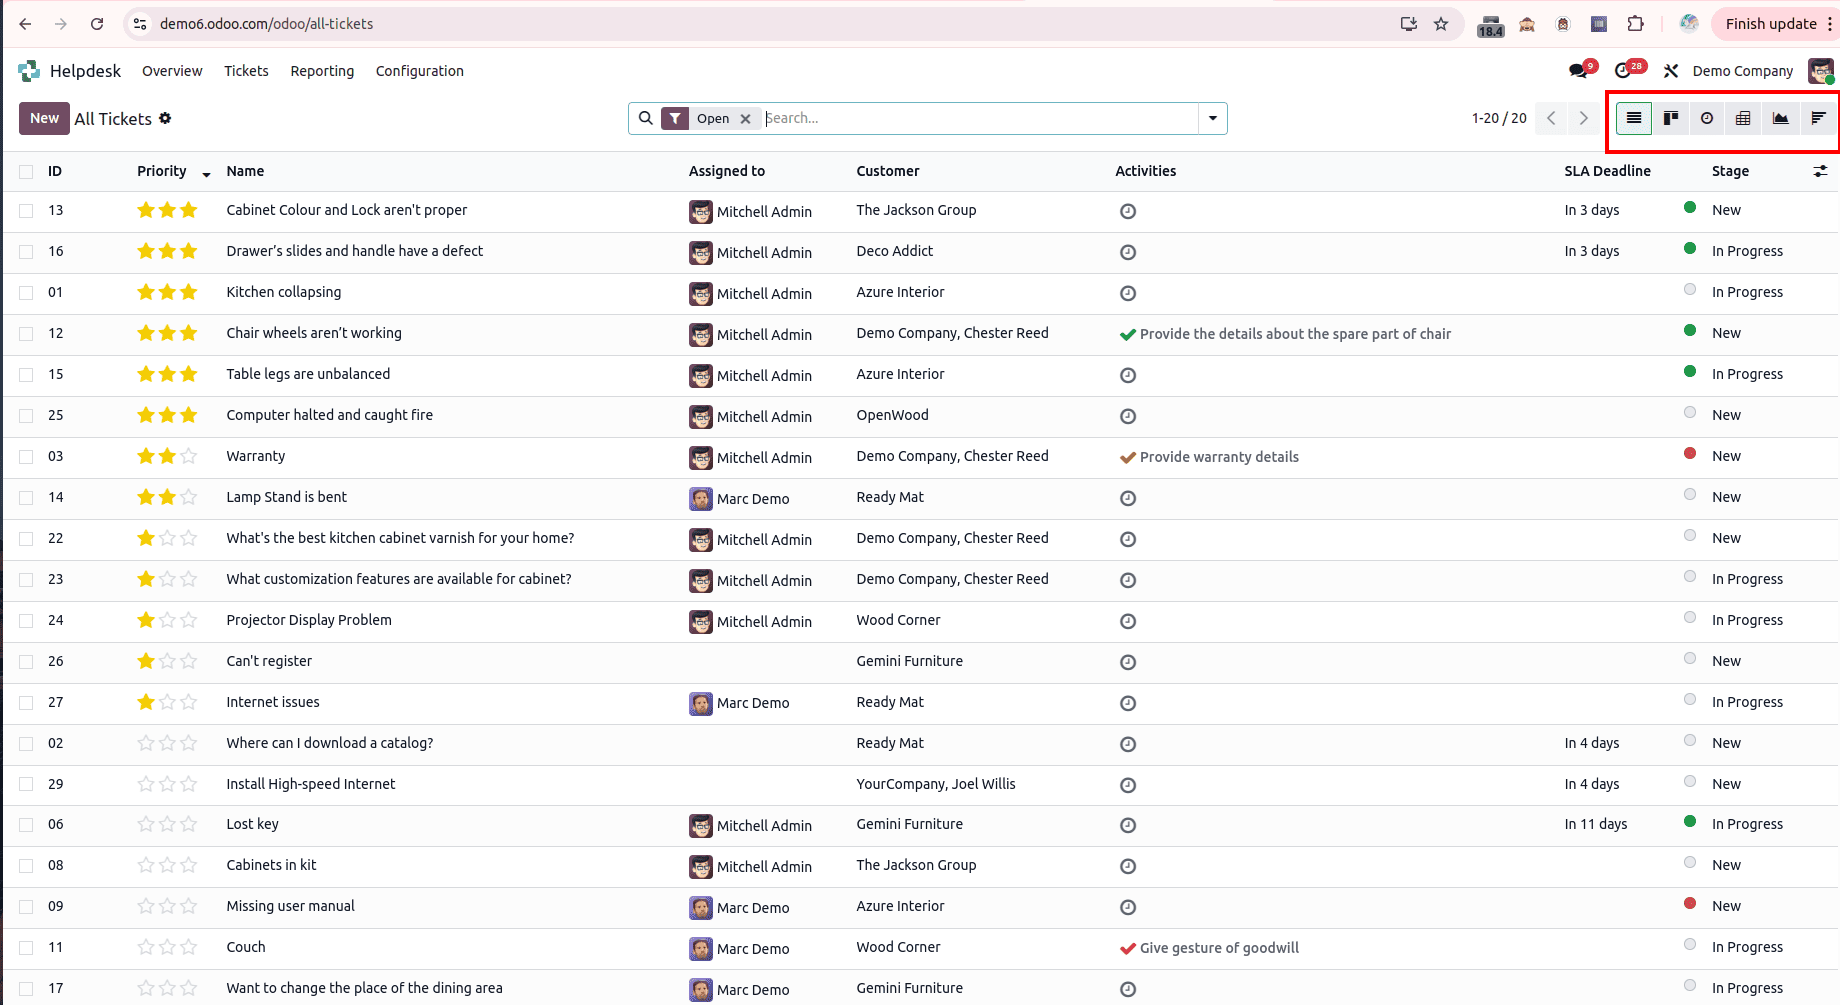
The List View in the Helpdesk module, when accessed through the "All Tickets" section, provides users with a comprehensive overview of all helpdesk tickets across the system in a tabular format. Unlike the "My Tickets" view, this section displays tickets regardless of assignment, allowing broader visibility into the helpdesk workload. It includes key details such as Priority, Ticket Name, Assigned To, Customer, Scheduled Activities, SLA Deadline, and Stage, offering quick access to essential information. The view supports sorting, grouping, and filtering, enabling users, especially managers or team leads, to monitor ticket distribution, track progress, and manage support operations more effectively.
2. KANBAN VIEW
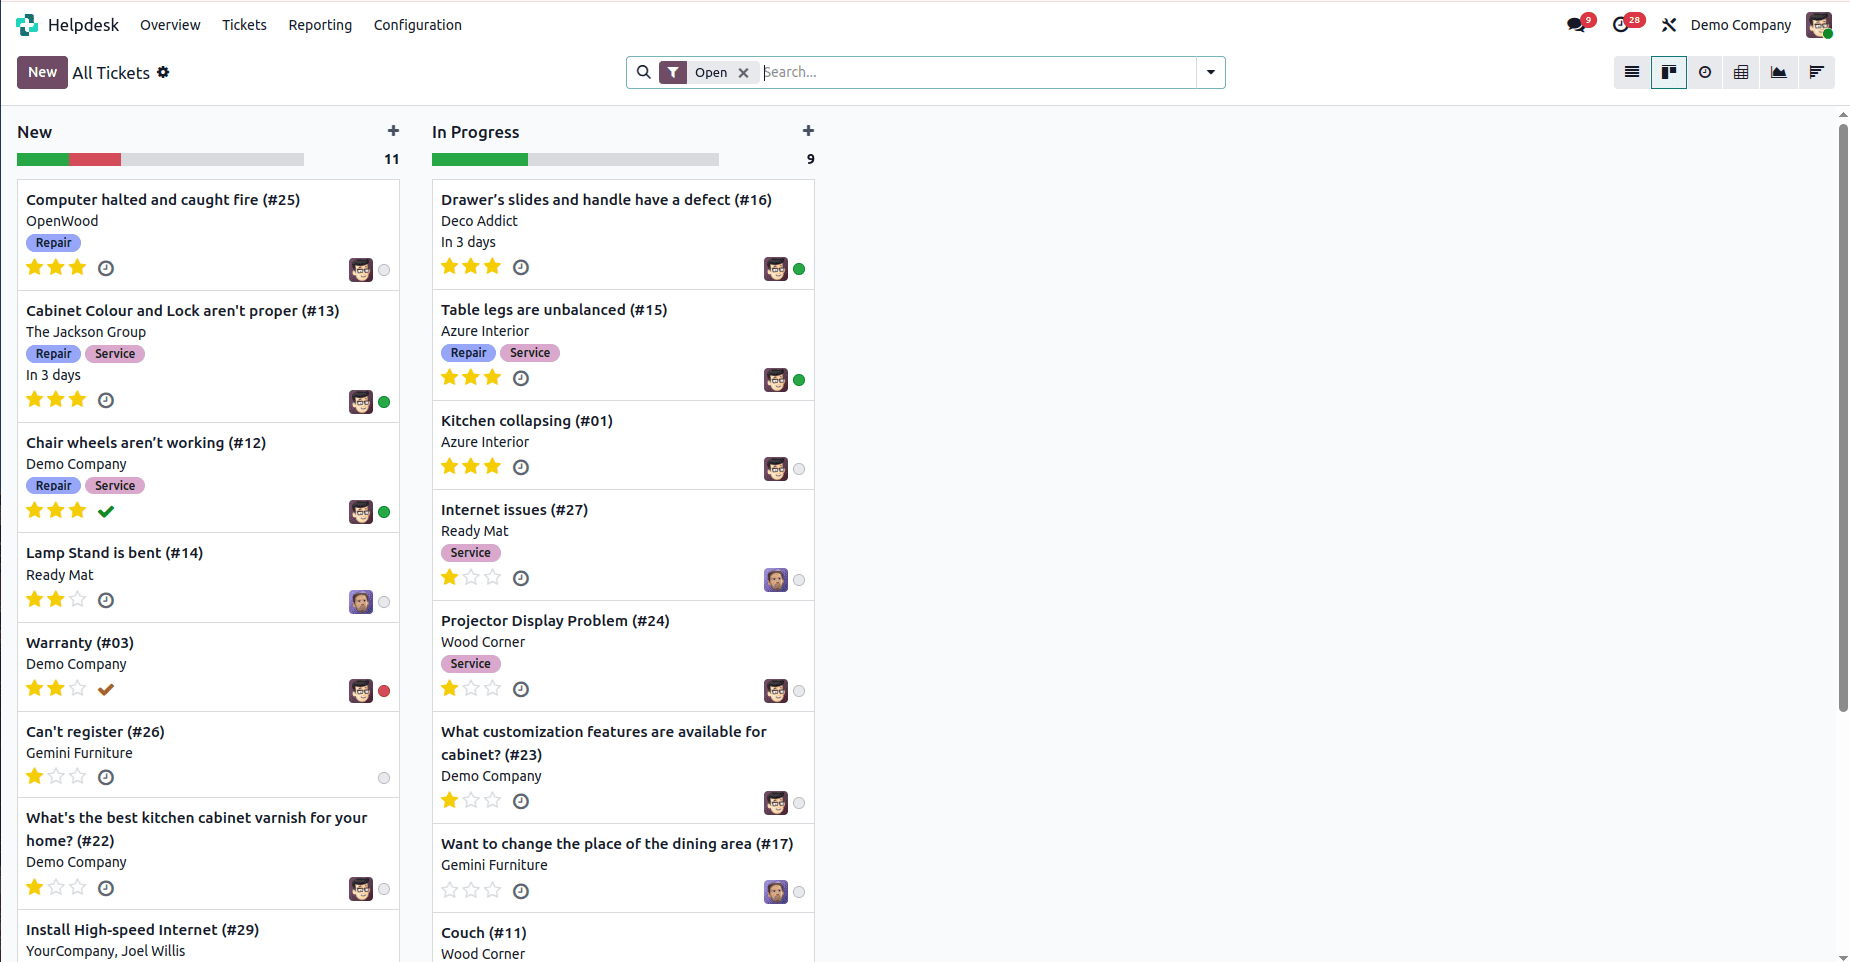
The Kanban View in the Helpdesk module, when accessed through the "All Tickets" section, provides a visually organized interface for managing all helpdesk tickets across the system. Tickets are displayed as cards grouped under various stages such as "New", "In Progress", and other custom workflow stages, giving users a clear overview of the overall ticket pipeline. This view supports drag-and-drop functionality, allowing tickets to be easily moved between stages to reflect their current status. Each card presents key information, including the ticket name, customer, tags, deadline, assigned person, and any scheduled activities, enabling users to monitor and manage the broader ticket workload effectively. The Kanban view in the "All Tickets" section is particularly valuable for managers and team leads who need to oversee ticket distribution, track progress, and ensure timely resolution across the support team.
3. ACTIVITY VIEW
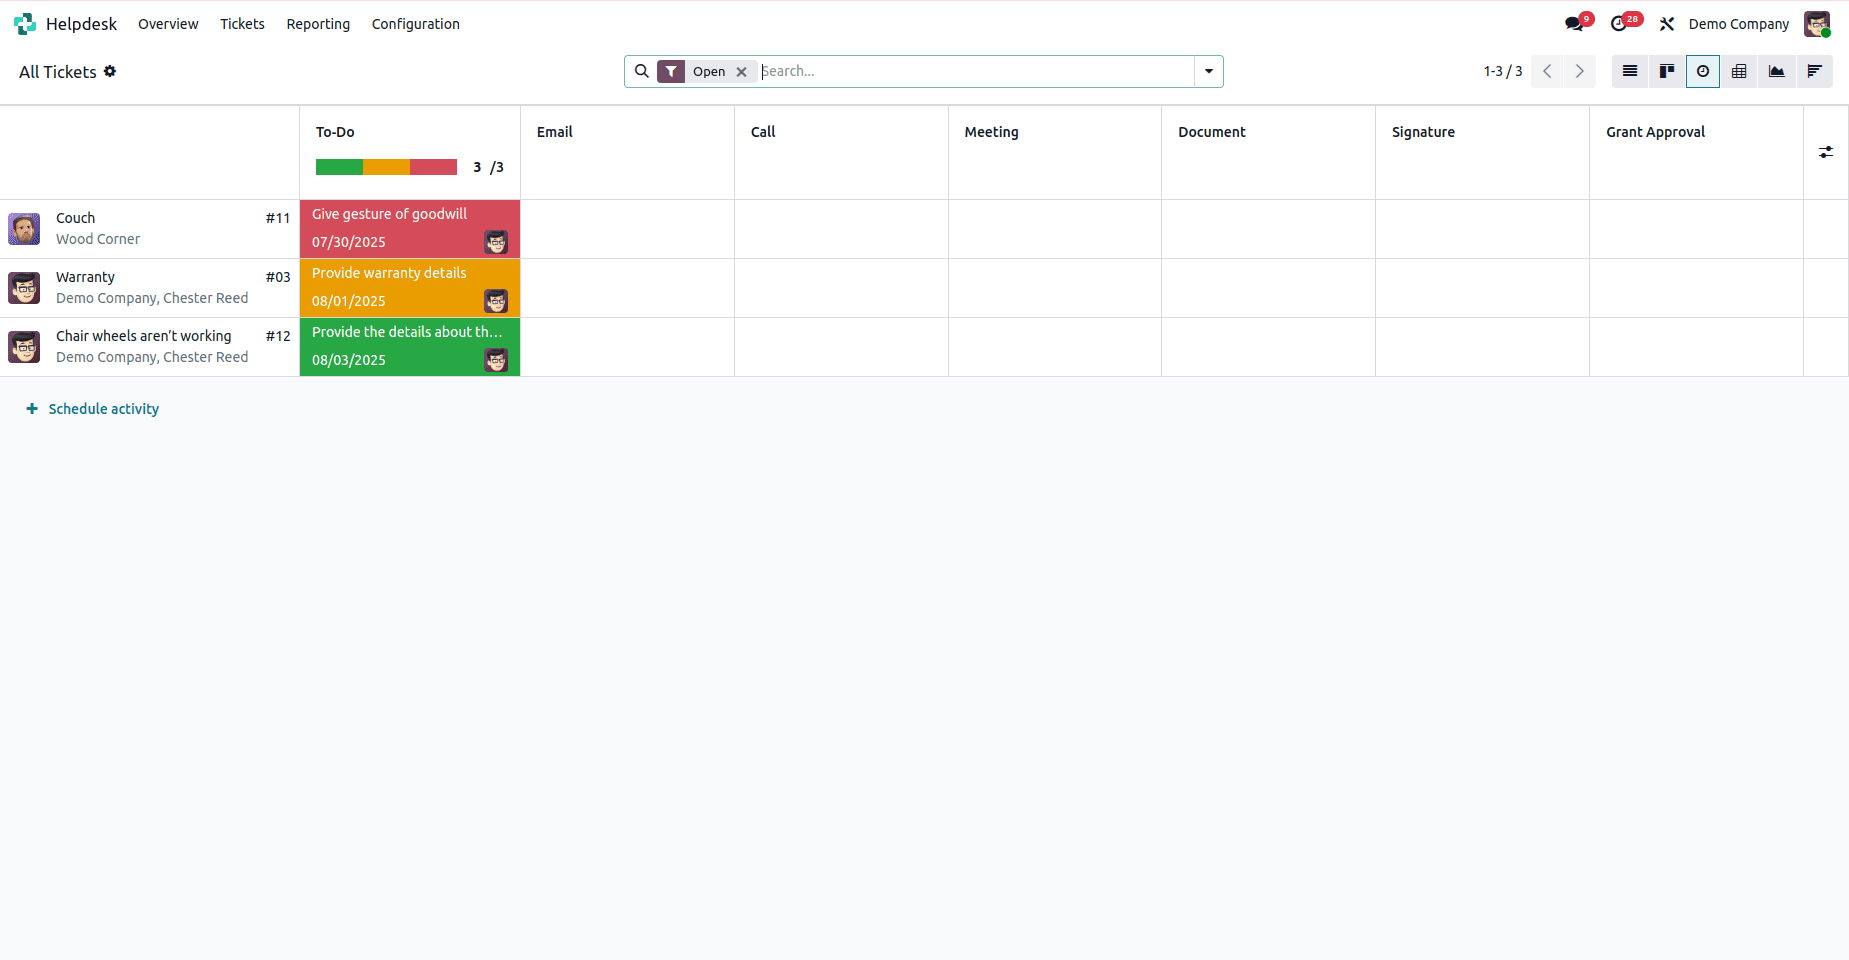
The Activity View in the Helpdesk module, when accessed through the "All Tickets" section, provides a centralized interface for managing and tracking scheduled activities across all helpdesk tickets in the system. Activities are grouped by ticket name, allowing users, especially managers or team leads, to easily monitor pending tasks and ensure timely follow-ups by any team member. Typical activity types include To Do, Email, Call, Meeting, Document, Signature, and Grant Approval, offering a comprehensive overview of support-related actions. Each activity is color-coded based on its status, overdue, due today, or planned, helping users quickly identify priorities. This view is especially useful for overseeing team performance, ensuring deadlines are met, and maintaining consistent customer service across all active tickets.
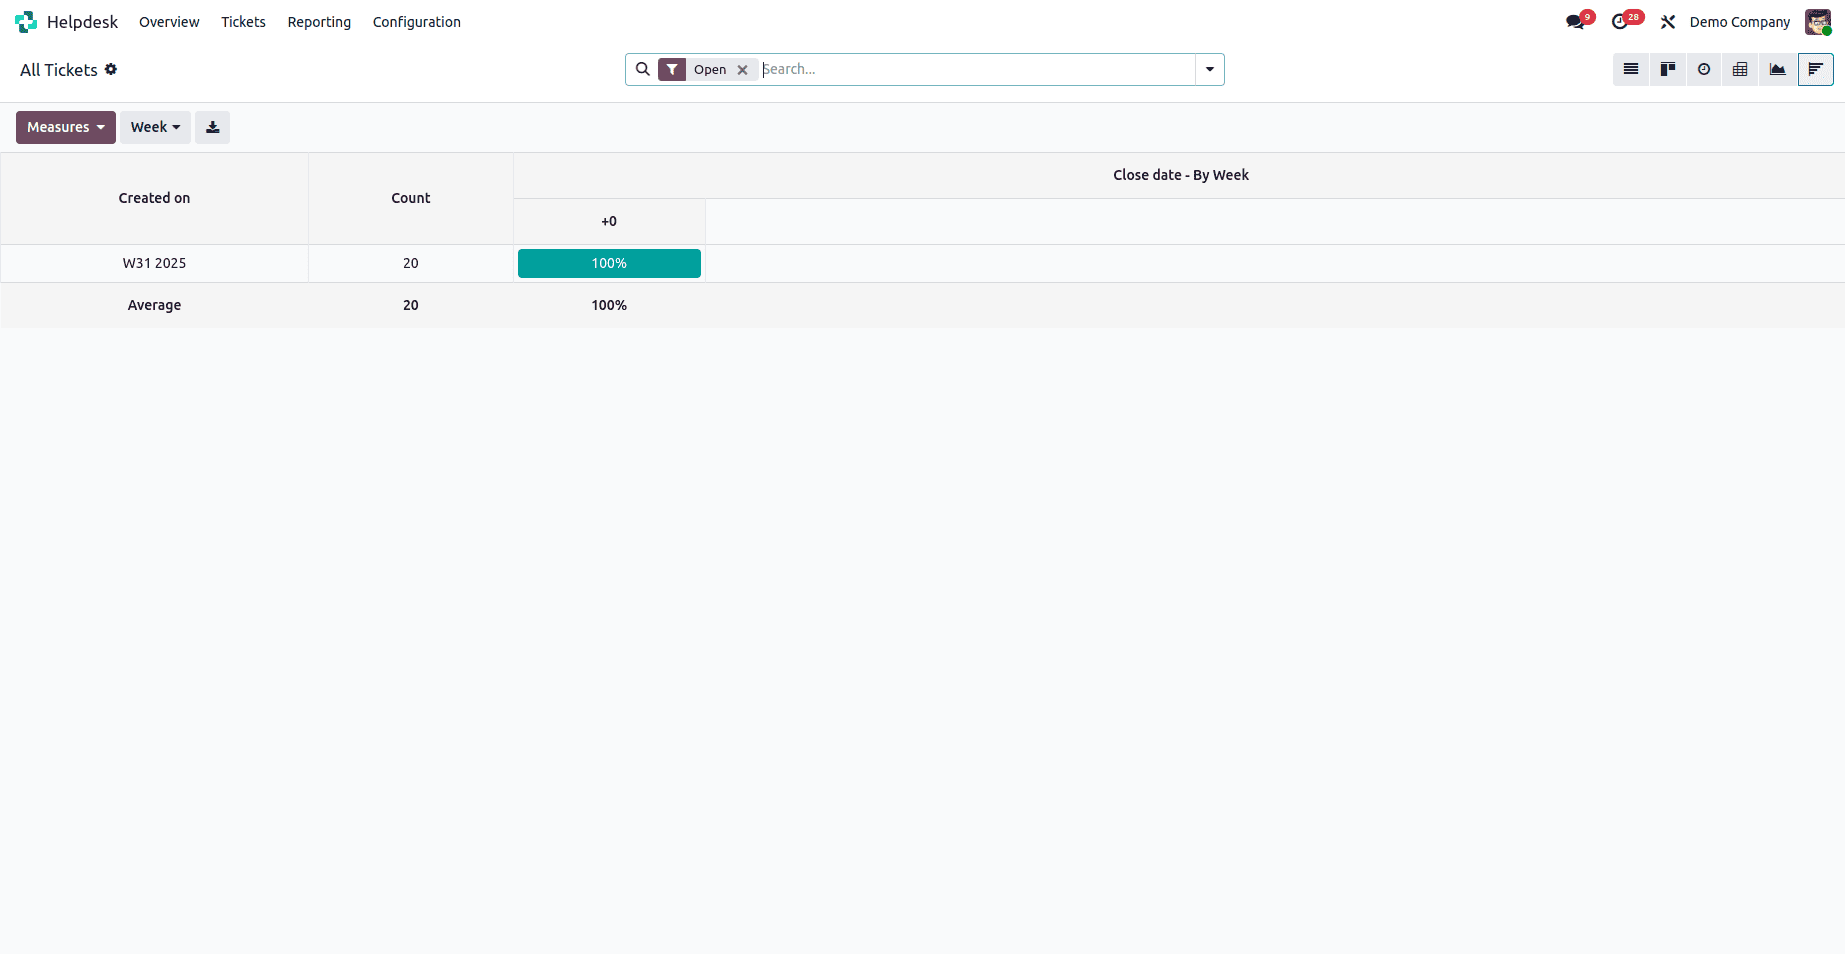
4. PIVOT VIEW
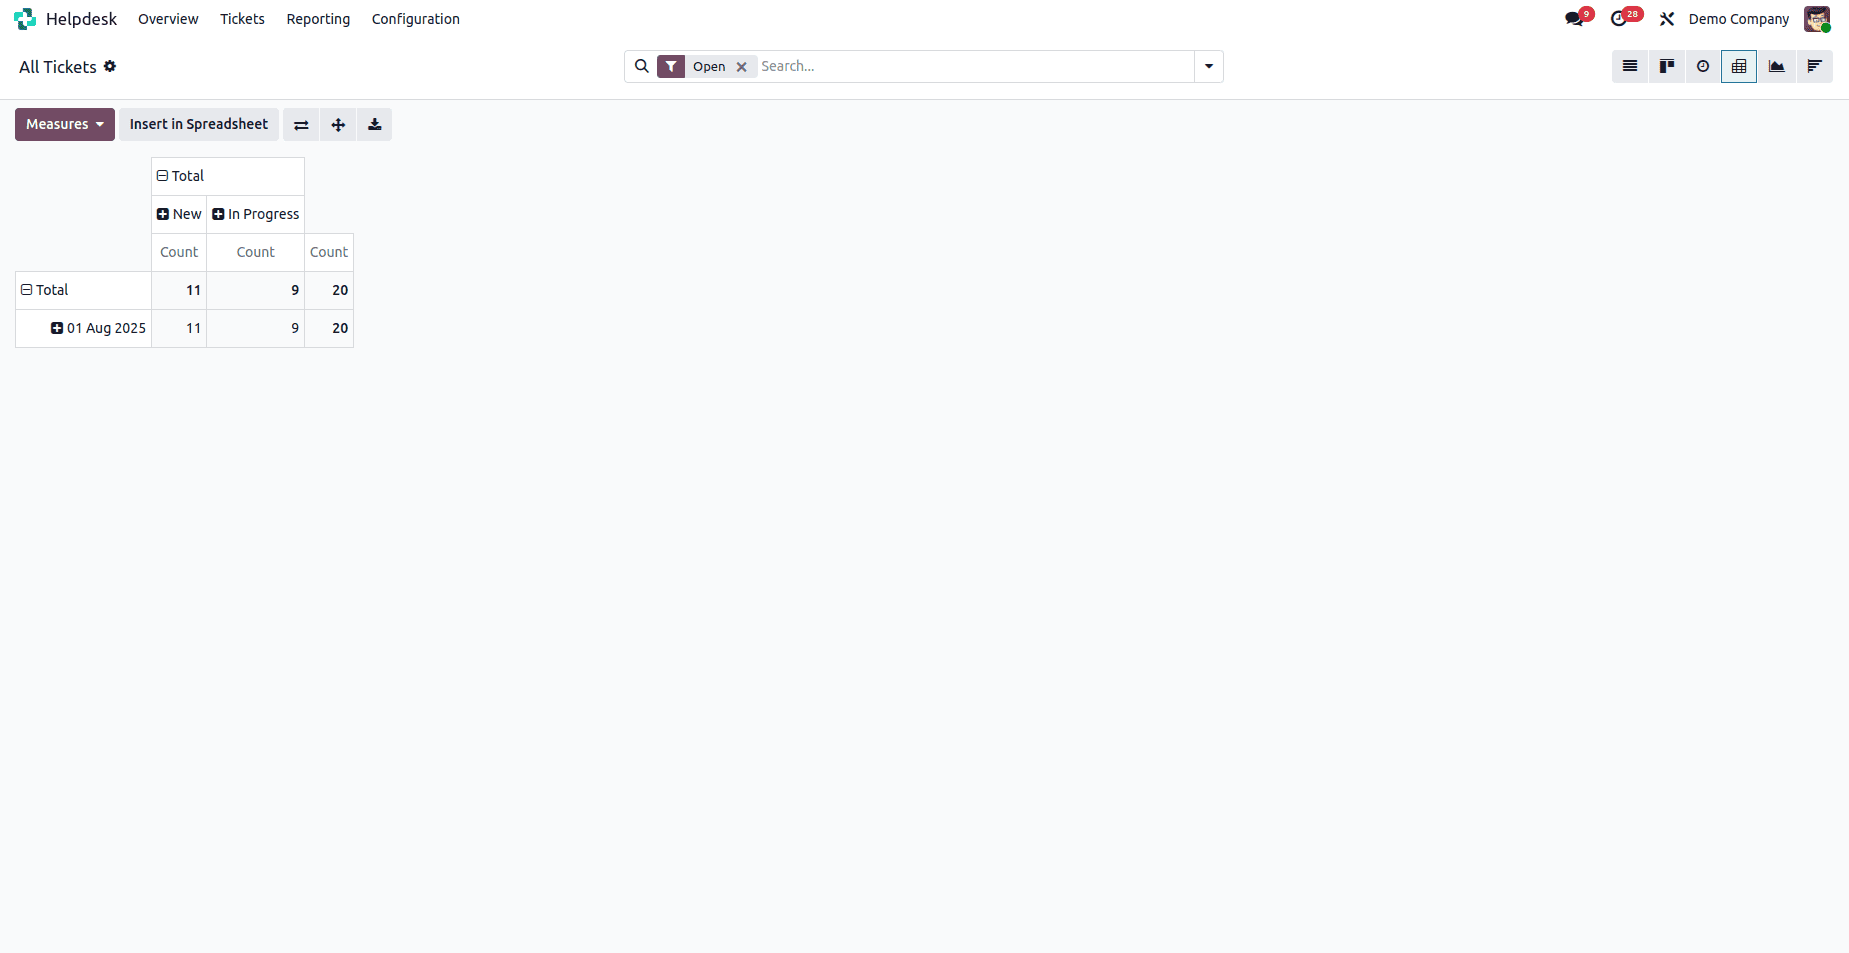
The Pivot View in the Helpdesk module, when accessed through the "All Tickets" section, provides a powerful and customizable tool for analyzing ticket data across the entire helpdesk system. It features two adjustable axes where users can add fields such as Assigned To, Helpdesk Team, Stage, Status, SLA, Tags, Priority, and Company to create comprehensive reports tailored to specific business requirements.
Users can apply measures to calculate totals, averages, and other key performance metrics, enabling a deeper understanding of how time and resources are utilized across all tickets. This is particularly useful for tracking overall team performance, workload distribution, and SLA compliance.
The view also includes advanced options like flipping axes, expanding all rows, downloading data as an XLSX file, and inserting the view into a spreadsheet, making it an essential tool for managers and team leads engaged in reporting, performance monitoring, and strategic planning.
5. GRAPH VIEW
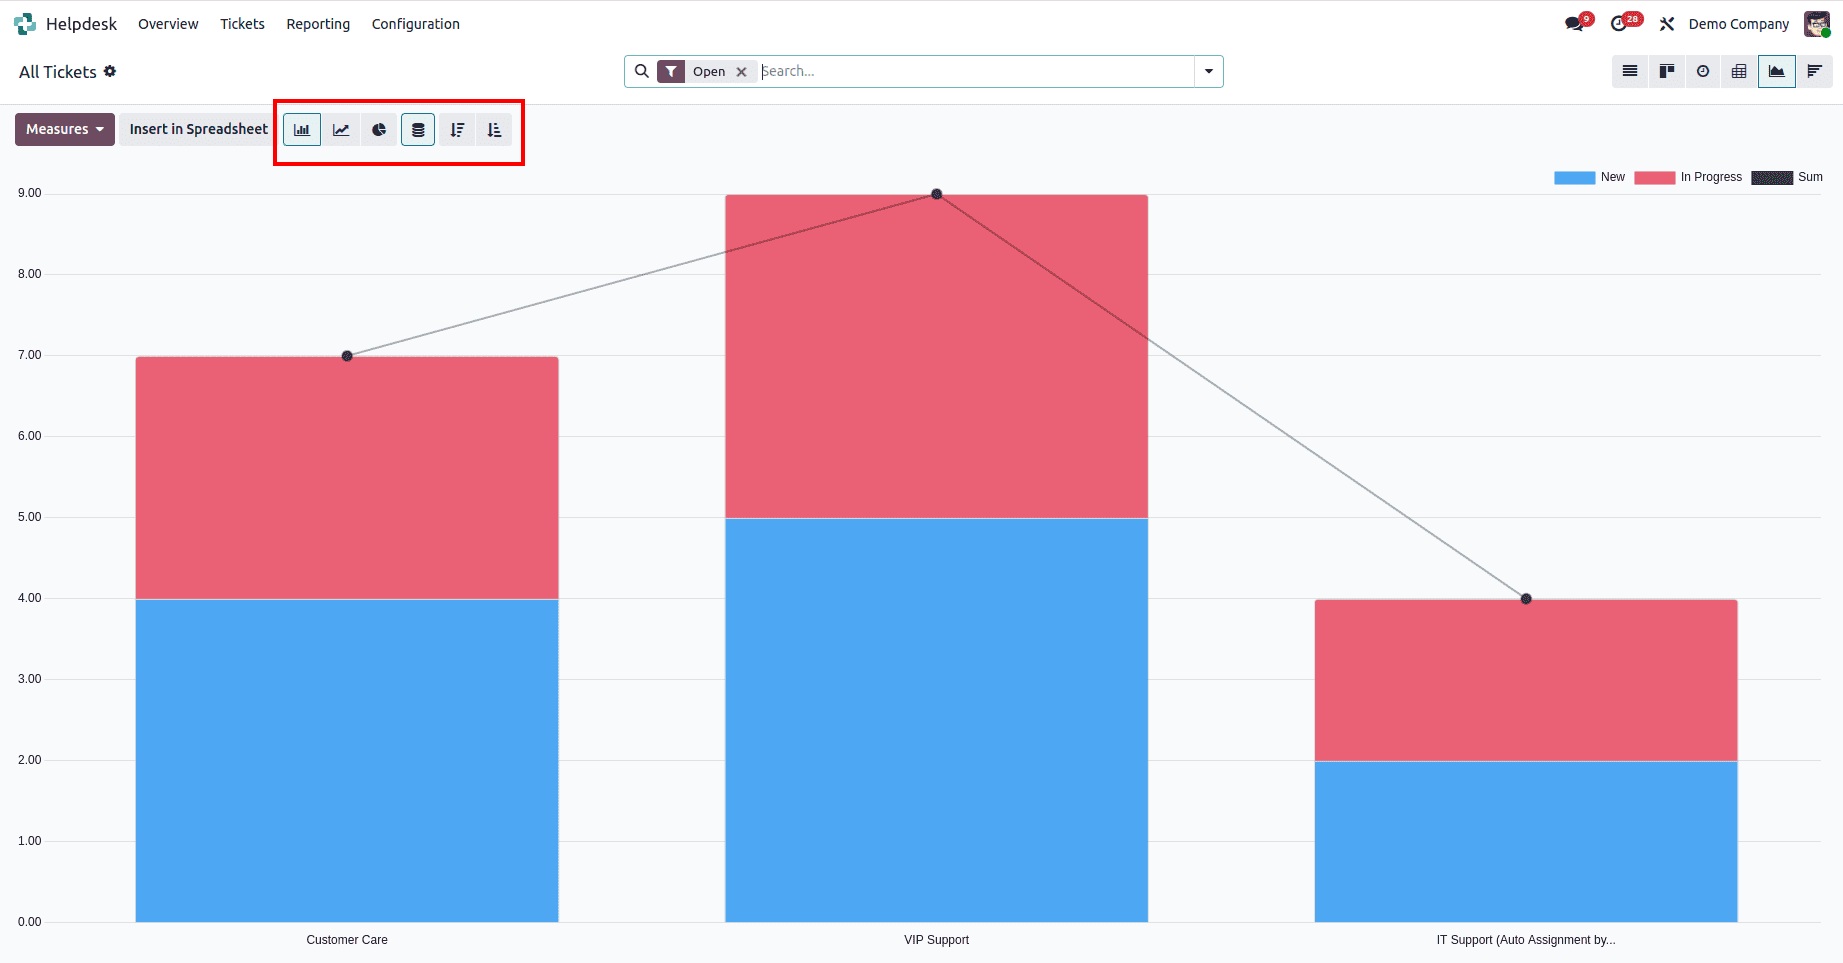
The Graph View in the Helpdesk module, when accessed through the "All Tickets" section, functions as a comprehensive visual dashboard that presents a clear overview of ticket data across the entire helpdesk system. It utilizes line, bar, and pie charts to help users monitor key metrics such as ticket volume, resolution time, SLA performance, and workload distribution. Enhanced features like stacked bars, ascending/descending sorting, and color-coded segments improve readability and data interpretation. Users can choose from various measure options including Ticket Count, Assigned Hours, Resolution Time, and SLA Deadline Compliance to evaluate overall team performance. The view also supports filtering, grouping, and selection of custom date ranges, enabling detailed analysis of helpdesk trends and operational efficiency at a broader level.
6. COHORT VIEW
The Cohort View in the Helpdesk module, when accessed through the "All Tickets" section, is designed to analyze the life cycle of all tickets in the system over a defined time period. It groups tickets by their creation date, daily, weekly, or monthly, and tracks their progress over time, indicating how many have been resolved or remain open after a certain number of days. This view offers valuable insights into overall ticket resolution patterns, response efficiency, and team performance, helping managers and team leads identify bottlenecks, measure improvement, and evaluate the impact of operational changes. The Cohort View is particularly useful for understanding how efficiently the support team handles incoming requests over extended periods.
The Helpdesk module in Odoo 18 offers a comprehensive set of views, List, Kanban, Activity, Pivot, Graph, and Cohort, that empower support teams to manage, monitor, and analyze their ticketing workflows with efficiency and clarity. Whether it's an individual agent tracking their own tasks through the "My Tickets" section or a manager overseeing the broader support operation via "All Tickets," each view serves a distinct purpose, providing both operational control and analytical insight. With its intuitive interface, real-time tracking capabilities, and flexible reporting tools, Odoo 18 Helpdesk ensures that businesses can deliver timely, organized, and high-quality customer support.
To read more about How to Manage Website Helpdesk in Odoo 18, refer to our blog How to Manage Website Helpdesk in Odoo 18