In modern web applications, performance is not just about backend logic. Frontend performance is equally important. No matter how optimized your server-side code is, a slow or unresponsive user interface can ruin the overall experience.
In Odoo 19, the frontend is very dynamic and uses JavaScript frameworks, QWeb templates, and real-time interactions. A lot happens in the browser, from loading dashboards to rendering views and handling user actions. When something feels slow, such as delayed clicks, laggy forms, or slow page loads, it’s usually a frontend issue.
This is where Frontend Profiling becomes essential.
Frontend profiling helps developers understand how the UI works during execution. It shows what causes delays, which components are heavy, and how to optimize rendering. Instead of guessing why the interface feels slow, profiling provides clear insights supported by data.
1. What is Frontend Profiling?
Frontend profiling is the process of checking how your application works in the browser.
It focuses on things like:
- Page load time
- JavaScript execution
- Rendering performance
- Network requests
- UI responsiveness
In Odoo 19, this means keeping an eye on how views load, how widgets work, and how well the front end talks to the back end.
2. Understanding Odoo 19 Frontend Architecture
It's important to know what you're looking at before you start profiling.
Odoo’s frontend is built using:
- Owl (Odoo Web Library) for component-based UI
- QWeb templates for rendering views
- JavaScript services and registries for handling logic
- RPC calls to communicate with the backend
Performance can be affected by any of these layers. Profiling helps you figure out what part is making things go slower.
3. Using Browser Developer Tools
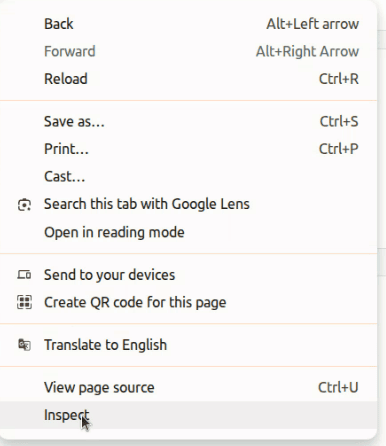
Your browser's DevTools (Chrome, Firefox, etc.) are the best tool for profiling the front end. To do this, inspect the view using the browser's developer tools.
Performance Tab
You can record and look at how things work at runtime on the Performance tab.
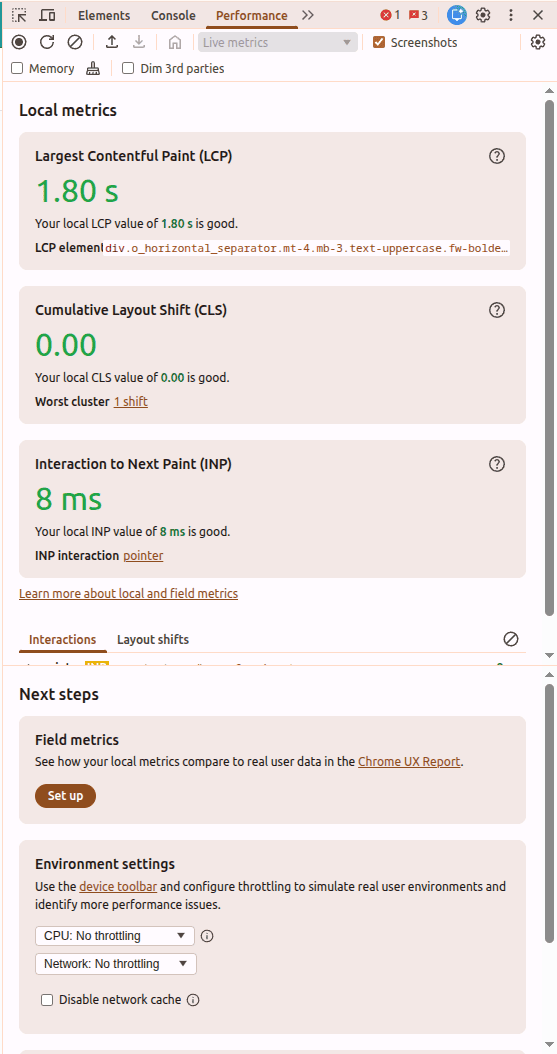
You can:
- While using Odoo, you can record a session.
- Check how long it takes for scripts to run
- Find out what is causing rendering delays and repaint problems.
This helps you pinpoint slow UI updates or heavy computations.
Network Tab
The Network tab shows all the requests that have been made between the front end and the back end.
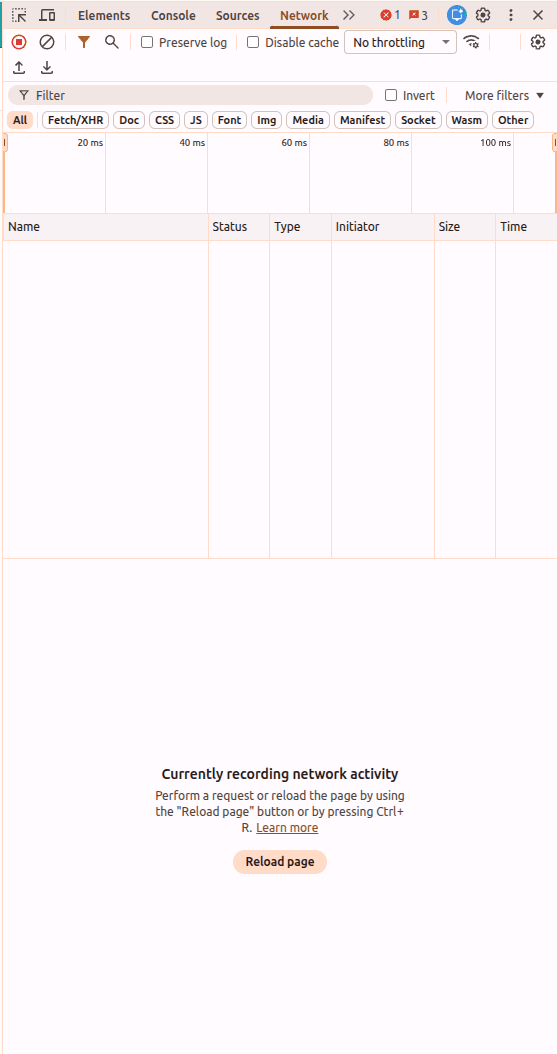
You can analyze:
- Slow API (RPC) calls
- Large payload sizes
- Repeated or unnecessary requests
If a form takes a long time to load, profiling might show that there is more than one RPC call instead of one optimized one.
Memory Tab
This helps track memory usage in the browser.
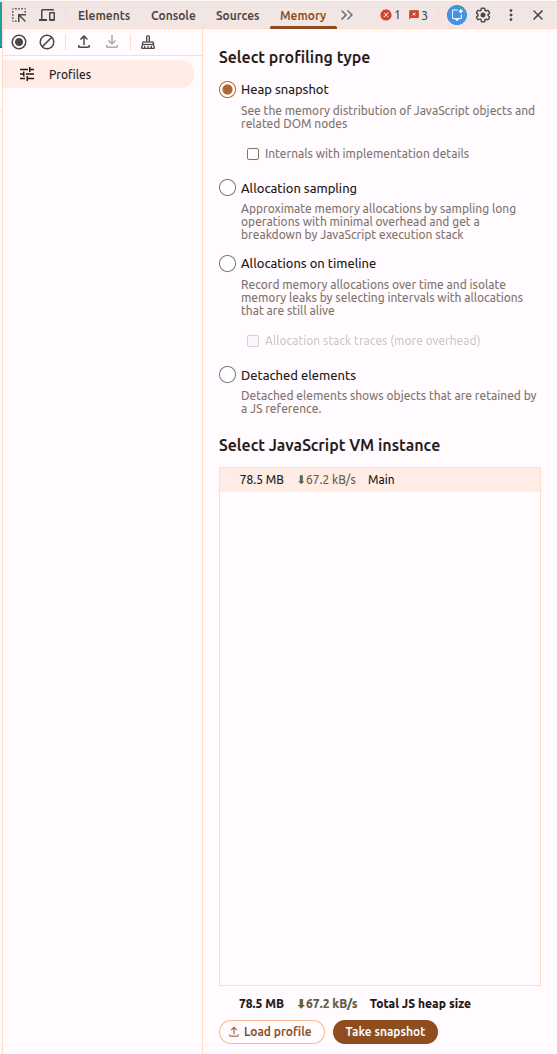
Useful for detecting:
- Memory leaks
- Unreleased components
- Excessive data is stored in the frontend
4. Identifying Common Frontend Bottlenecks
Excessive RPC Calls
Making too many backend calls can slow down the UI.
// Inefficient approach
for (let record of records) {
    await this.rpc('/get_data', { id: record.id });
}
Better approach:
// Optimized batch call
await this.rpc('/get_bulk_data', { ids: records.map(r => r.id) });
Cutting down on the number of RPC calls makes the system much more responsive.
Heavy Rendering
Rendering a lot of data at once can make the UI freeze.
For example:
- Large lists
- Complex dashboards
- Multiple widgets loading together
Solution:
- Use pagination
- Lazy loading
- Conditional rendering
Unnecessary Re-renders (Owl Components)
When the state changes in Owl, components re-render. Bad state management can cause updates that aren't needed.
// Avoid frequent unnecessary updates
this.state.value = newValue;
Instead, make sure that updates only happen when they are needed and that there are no unnecessary state changes.
5. Measuring Load and Interaction Time
Frontend profiling also consists of analyzing essential performance indicators:
- Time to Interactive (TTI) – when the UI becomes usable
- First Contentful Paint (FCP) – when content first appears
- Total Blocking Time (TBT) – time the UI is blocked
These metrics give you an idea of how users feel about your app.
6. Debugging with Odoo Developer Mode
Odoo has a Developer Mode that lets you check how the front end works.
With it, you can:
- Analyze views and templates
- Debug assets (JS/CSS)
- Track component structure
This is especially useful when working with custom modules.
7. Optimizing Assets (JS & CSS)
Large or unoptimized assets can slow down frontend performance.
Best practices:
- Minify JS and CSS
- Remove unused code
- Use asset bundling
- Enable caching
Odoo’s asset management system helps combine and optimize files for better performance.
8. Continuous Monitoring
It's not a one-time job to keep the frontend running well.
As your application grows:
- More data is loaded
- More components are added
- More interactions are introduced
Regular profiling ensures performance stays consistent over time.
Frontend optimization for Odoo 19 is as crucial as backend performance. Even if all processes run smoothly in the background, a sluggish front end may cause significant frustration among users.
Through frontend profiling methods, programmers can:
- Detect UI constraints
- Minimize redundant computations
- Streamline rendering processes
Rather than making conjectures based on guesswork, profiling enables developers to gain deeper insight into how the front end operates. As a result, more efficient interfaces will be created.
To read more about Overview of Advanced OWL Components In Odoo 19, refer to our blog Overview of Advanced OWL Components In Odoo 19.