In every business, the relationship between the company and customers should be maintained in order to have success. CRM, Customer Relationship Management helps in maintaining and improving the relationship between customers and the company. Long before the current methodologies came into existence, businessmen used manual methods of generating leads and obtaining customers. These processes limited the accessibility of customers due to many barriers. With the development of technology, companies started using software which to a distance eradicated the previous barriers.
CRM software is now widely used in companies to generate leads and opportunities. Odoo ERP, the total solution for running your business, comes with a CRM tool that integrates other modules of the system, maintaining the workflow of the company. The Odoo CRM helps you in generating leads, scheduling activities with them and converting them into potential customers. With lead enrichment functionality, the generated lead’s contacts are obtained and stored.
The follow-ups on the leads can be done easily with Odoo CRM. The Marketing team and the Sales team can plan strategies to convert the leads into customers. With CRM’s tools, the needs and requirements of the customers can be understood and products and services can be tailored accordingly. Sales quotations and rentals can be sent to the customers based on their received information and can easily convert them into sales orders.
Apart from achieving sales and attaining more, Odoo CRM allows you to have an analytical report of the processes taking place in the CRM module. These reports will help you in making future decisions regarding the management of customers. Also, the status of the sales team, salesperson, partnership and forecasted opportunities are obtained through this.
Here, in this blog, let us look at the reporting feature of Odoo CRM and its contribution to the development of customer relationships.
Dashboard
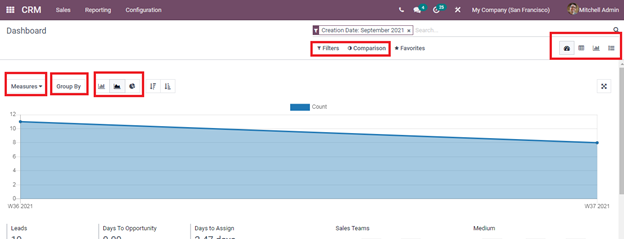
To view, the analytical report of the dashboard activities click on the Dashboard option from the Reporting tab. The graphical representation of the reports is visible on the screen. You can add certain measures to view their reports. These measures include Automated Probability, Bounce, Days to Assign, Days to Close, Days to Convert, Exceeded Closing Days, Expected Revenue, Probability, Prorated Revenue and Count.
The reports can be grouped based on Salesperson, Sales Team, City, Country, Company, Assigned Partner, Campaign, Medium, Source, Creation Date and Closed Date. You can also add a custom group and view their report. The report can be viewed in Dashboard, Pivot, Graph, List, Bar Chart, Line Chart and Pie Chart. The results can be filtered using Filters such as My Activities, Unassigned, My Assigned Partners, Lost, Creation Date, Closed Date, Late Activities, Today Activities, Future Activities, Archived and custom filters as per the requirement. The generated reports can be compared on the basis of their Creation period. It can be done on the basis of the Previous Period of the Previous Year.
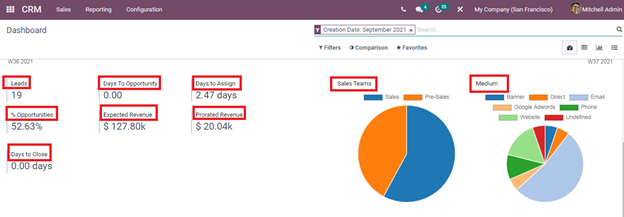
The total number of Leads, Days to Opportunity, Days to Assign, Percentage of Opportunities, Expected Revenue, Prorated Revenue and Days to Close are shown. This will help in analyzing the total Leads generated and the revenue generated. A comparison with the Expected Revenue and the Prorated Revenue generated from the total leads. The percentage of Opportunities obtained from the total Leads can also be examined.
The graphical report of the Sales Teams with Sales and Pre Sales along with the Medium used by the sales team to obtain the leads are shown. The undefined and defined medium used to develop the leads is clearly marked and this helps in identifying the best medium that can be used in future.
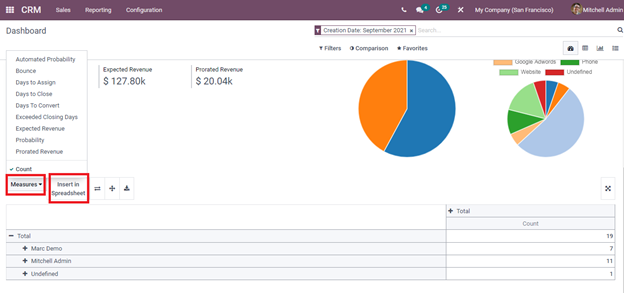
The report generated can be transferred into the spreadsheet by selecting the Insert in Spreadsheet option. You can select the measures that have to be added in the report from the Measures option.
Forecast
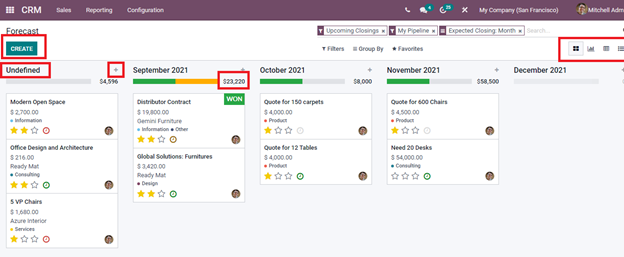
To view the analytical report of the upcoming closings and expected closing based on the months, click on the Forecast option from the Reporting tab. Opportunities forecasted to be closing in the upcoming months can be viewed in Kanban state. Opportunities that don't specify the Expected Closing Date are categorized under the Undefined. The Prorated Revenue obtained from the opportunities is shown next to each month. The report can be viewed in Kanban, Graph, Pivot and in List. A new Opportunity entry can be added by clicking on the plus symbol (+) located next to the stages displayed. Enter details such as the name of the Organization or Company, Opportunity, Email, Phone, Expected Revenue and the Priority of the opportunity. Press ADD to add the detail to the stage. By clicking on the Edit you can add more details to the created Opportunity.
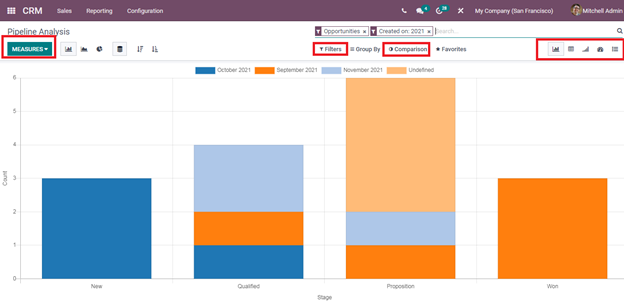
Pipeline
Select the Pipeline option from the Reporting to view the analytic report of the opportunities created. The graphical representation of the pipelines based on different stages is displayed. The report can be generated based on the Measures provided. You can apply Filters such as My Pipeline, Won, Lost, Created On and Archived and generate reports based on these filters. The generated report can be compared on the basis of the created date. It can be on the basis of the Previous Period of the Previous Year. The report can be viewed in Graph, Pivot, Cohort, Dashboard and in List. By viewing in Cohort you can have daily and weekly reports also.
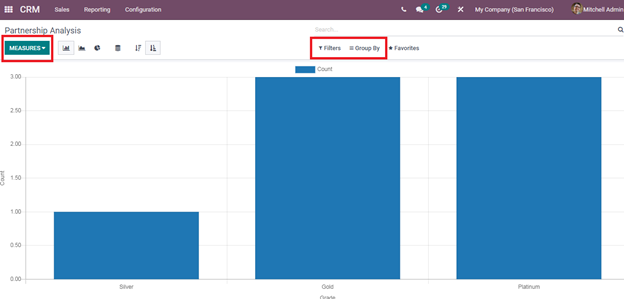
Partnerships
To review the partnership analysis click on the Partnership option from the Reporting tab. Reports based on the Number of Opportunities, Turnover and Count can be seen. The generated report can be viewed in Bar Chart, Line Chart and in Pie Chart. You can add Filters such as Partnership Date, Latest Partner Review and Customised Filter to display the required report. You can also use the Group By option to view the reports on the basis of groups such as Salesperson, Sales Team, Partner, Date Partnership, Date Review and Customised Group.
With the Odoo CRM reporting feature, you can have a clear picture of the status of the company and its relationship with the customers. The comparison of the reports helps in analyzing the success rate of the company’s activities. By analyzing the reports generated with Odoo CRM, the company can take decisions for future actions in maintaining the leads and opportunities of the company.