Odoo 18’s subscription reporting provides valuable information about revenue patterns, customer behavior, and subscription performance. Businesses can monitor client retention, churn rates, renewal estimates, and recurring revenue (MRR) using easy-to-use dashboards and configurable reports. Decision-makers can enhance client satisfaction, mitigate risk, and optimize strategy with the aid of these analytical tools. Odoo 18 offers powerful tools for effectively tracking and analyzing data, regardless of the number of subscriptions you’re managing, from a few to thousands. By facilitating data-driven decision-making, this feature helps companies expand and ensure and maintain their competitiveness in the subscription.
Firstly, select the Subscription module from the Odoo 18 dashboard.
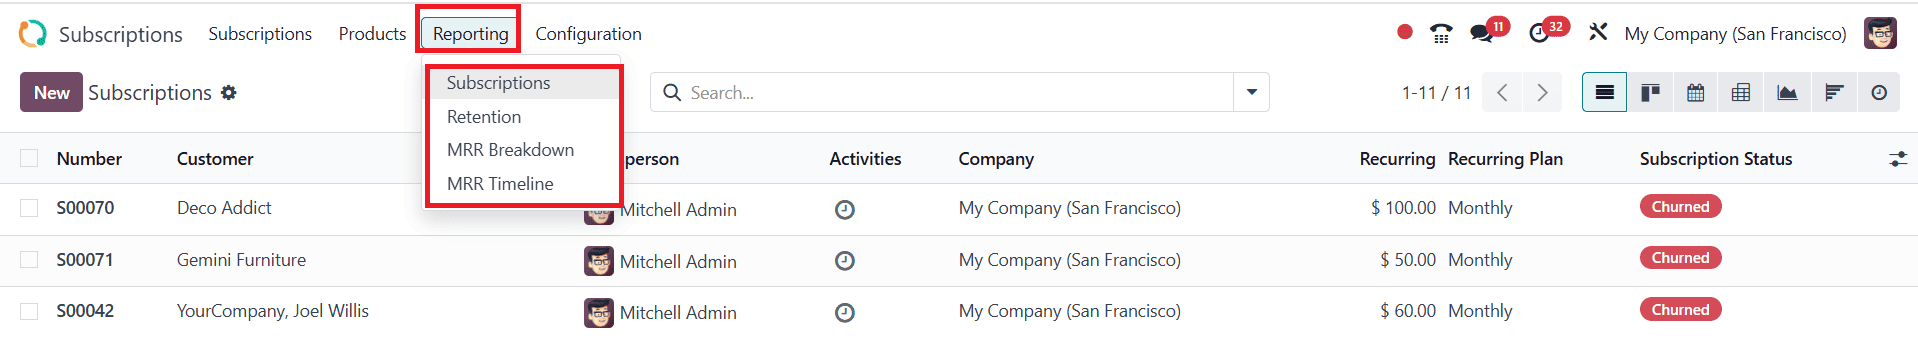
Navigate to the Subscription > Reporting. You can see four types of reporting, such as,
- Subscription
- Retention
- MRR Breakdown
- MRR Timeline
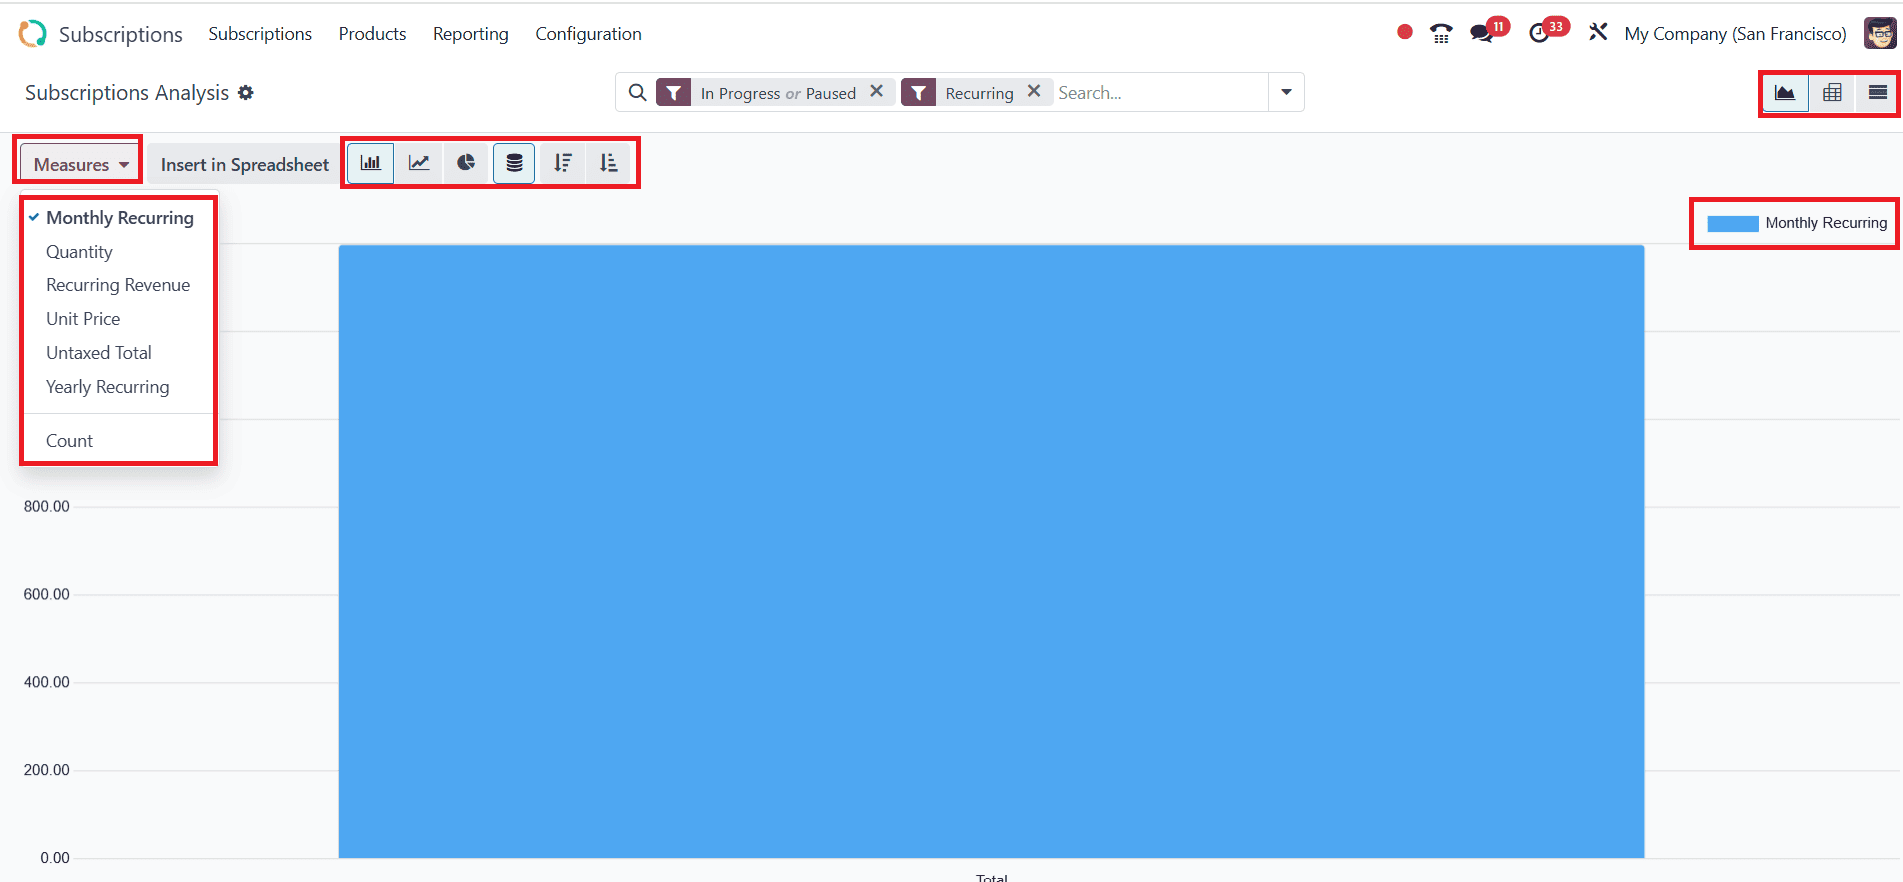
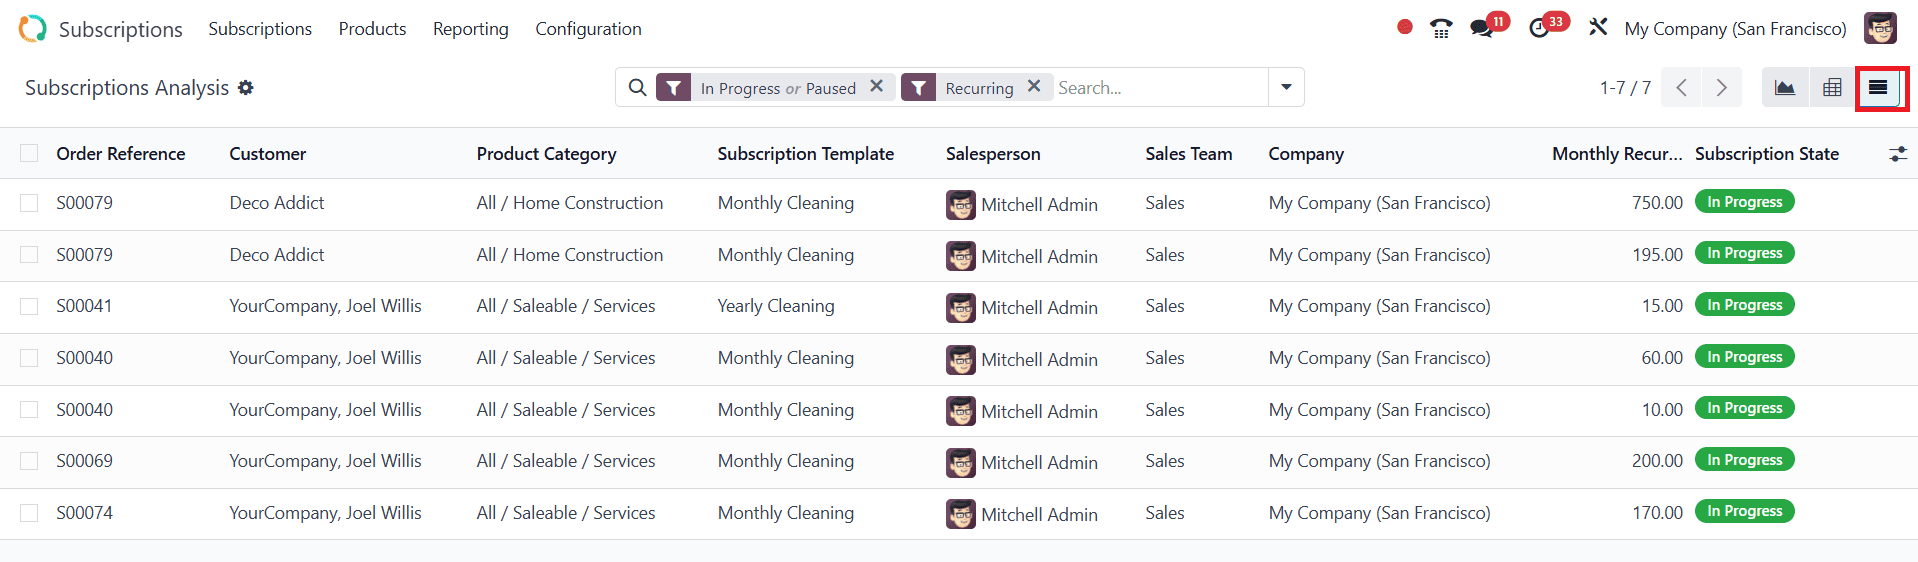
Subscriptions Analysis:
To access Subscriptions Analysis, navigate to the Reporting> Subscriptions Analysis. There are three types of views in subscription analysis: Graph View, List View, and Pivot View. In the graph view, the data is arranged as a Bar chart, a Line chart, and a Pie chart. You can also use visual options such as Stacked, Cumulative, Ascending, and Descending. Under the Measures drop-down menu option, you choose options such as Monthly Recurring, Quantity, Recurring Revenue, Unit Price, Untaxed Total, Yearly Recurring, and Count.
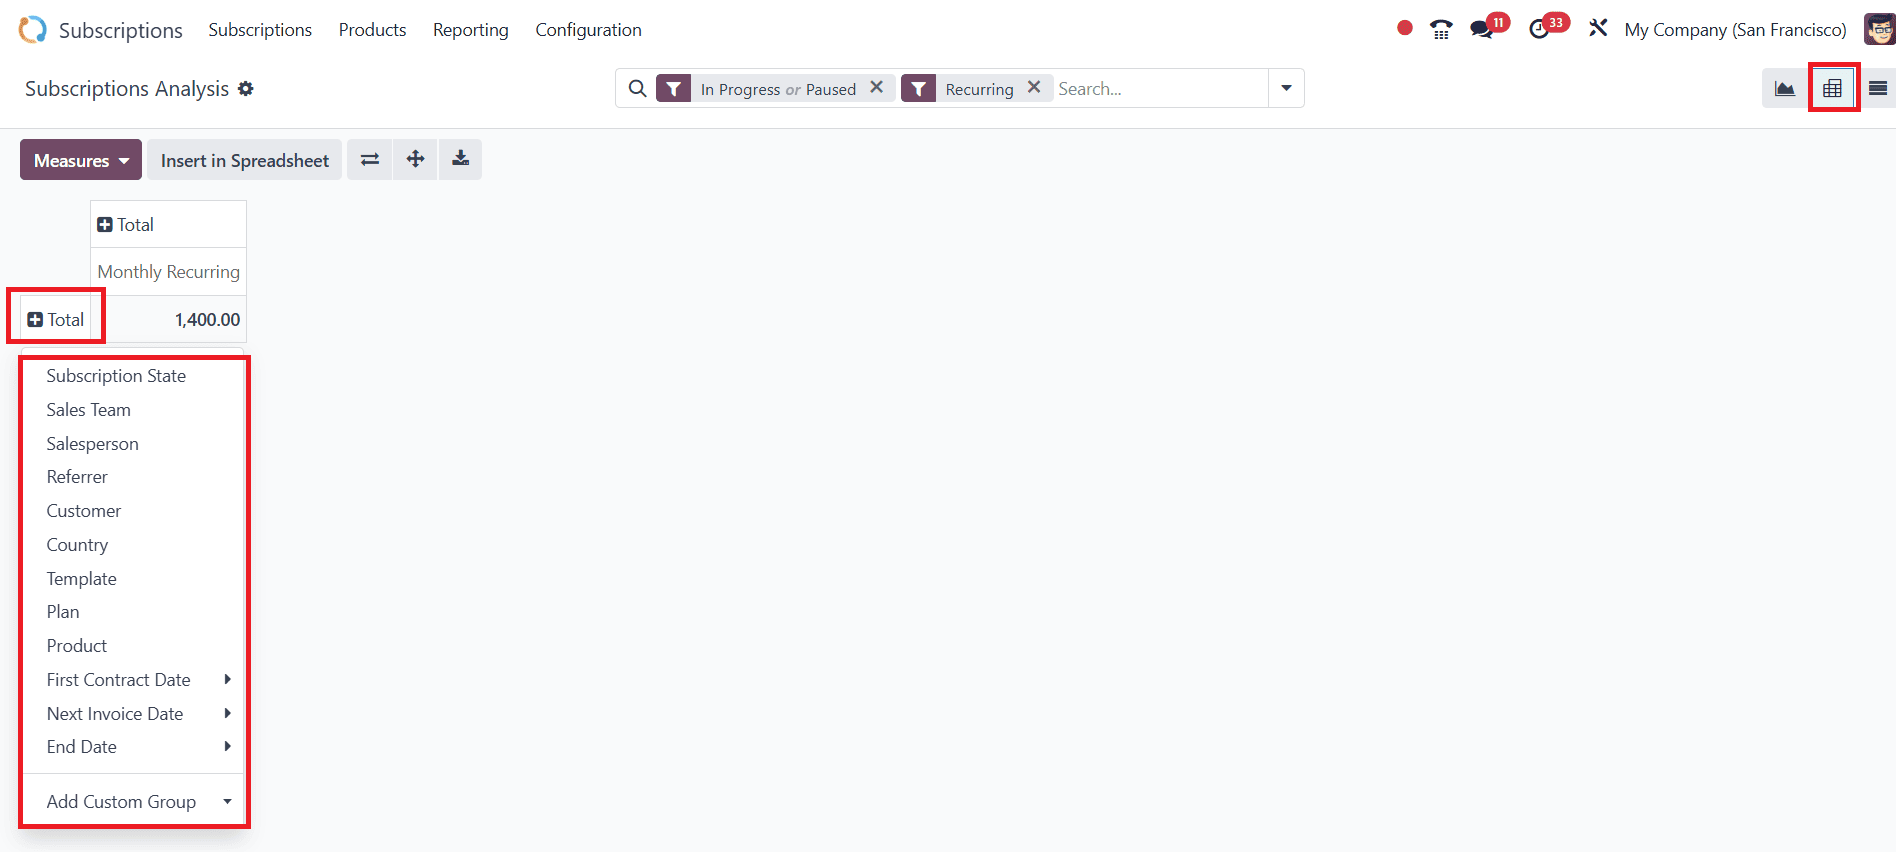
In the Pivot view, you can group the data by using options such as Subscription State, Sales Team, Salesperson, Referrer, Customer, Country, Template, Plan, Product, First Contract Date, Next Invoice Date, End Date, and Add Custom Group.
In the List view, you can see that the data is arranged by Order Reference, Customer, Product Category, Subscription Template, Salesperson, Sales Team, Company, Monthly Recurrence, and Subscription State.
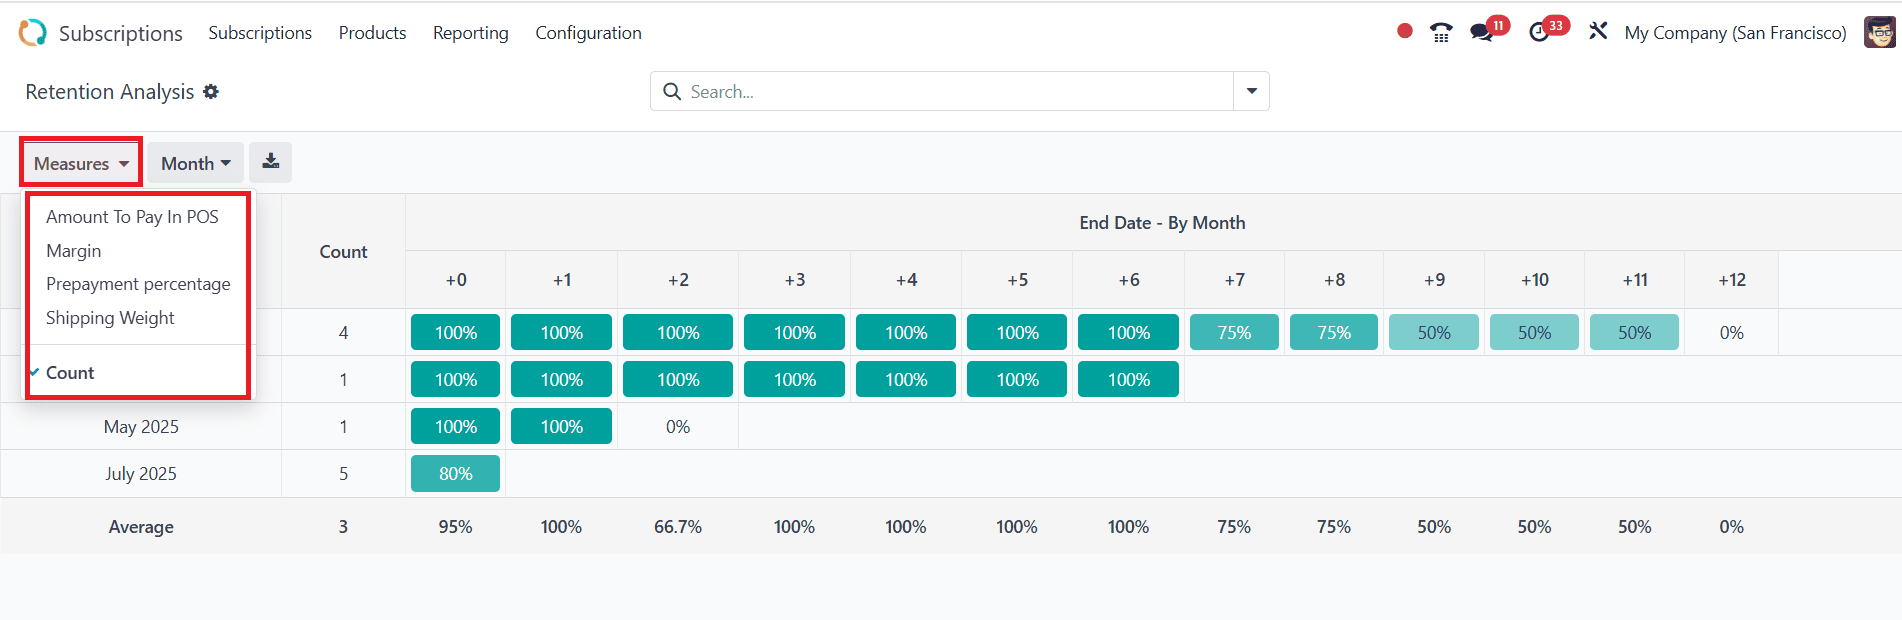
Retention Analysis:
To get retention analysis, go to the Reporting > Retention Analysis. Here, the data is arranged in a data chart format. Under the Measures drop-down option, you can select options such as Amount to Pay in POS, Margin, Prepayment percentage, Shipping Weight, and Count.
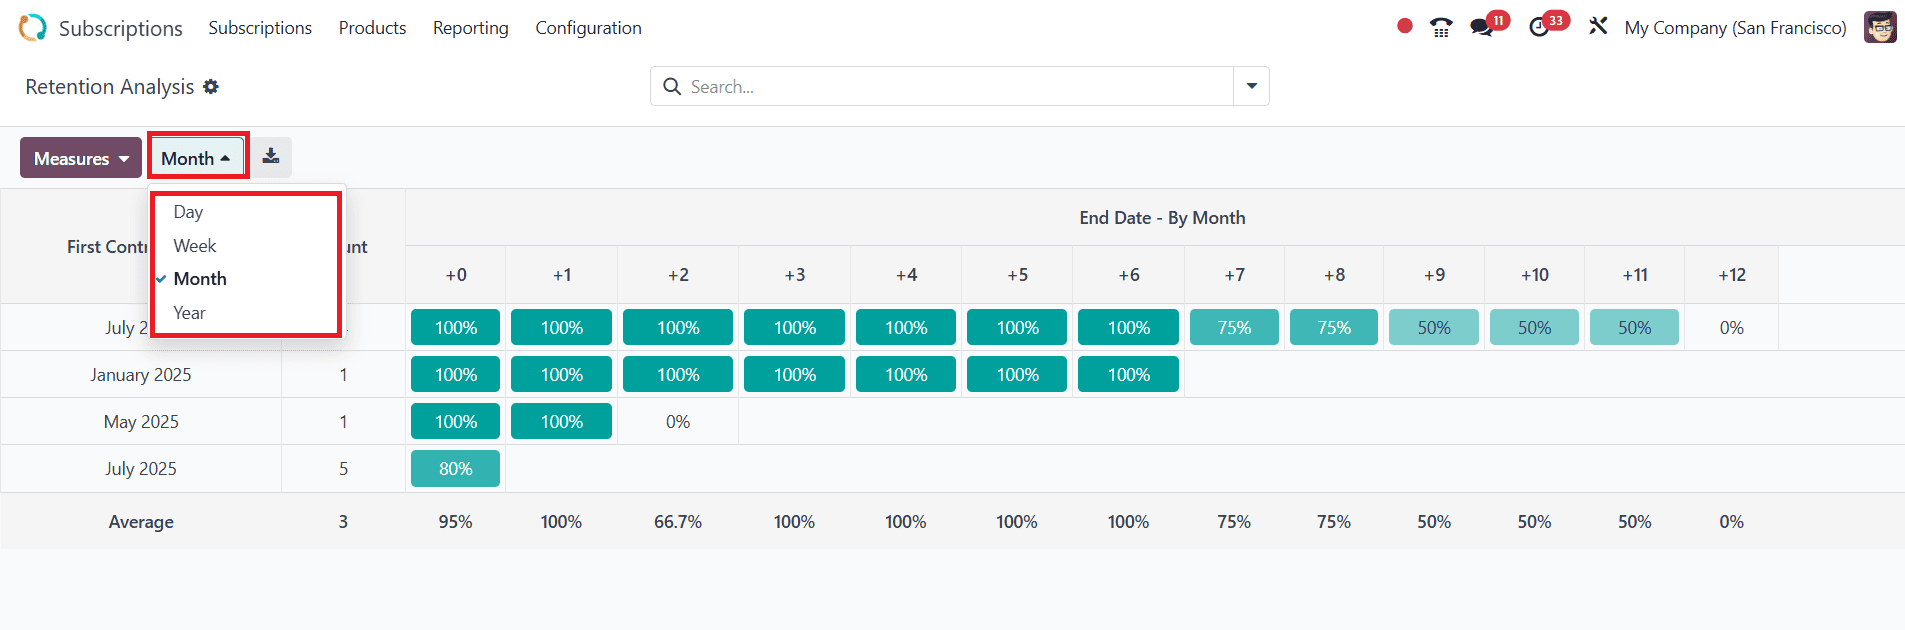
You can also organize the data by different time periods. By clicking on the drop-down option, you can select options such as Day, Week, Month, and Year.
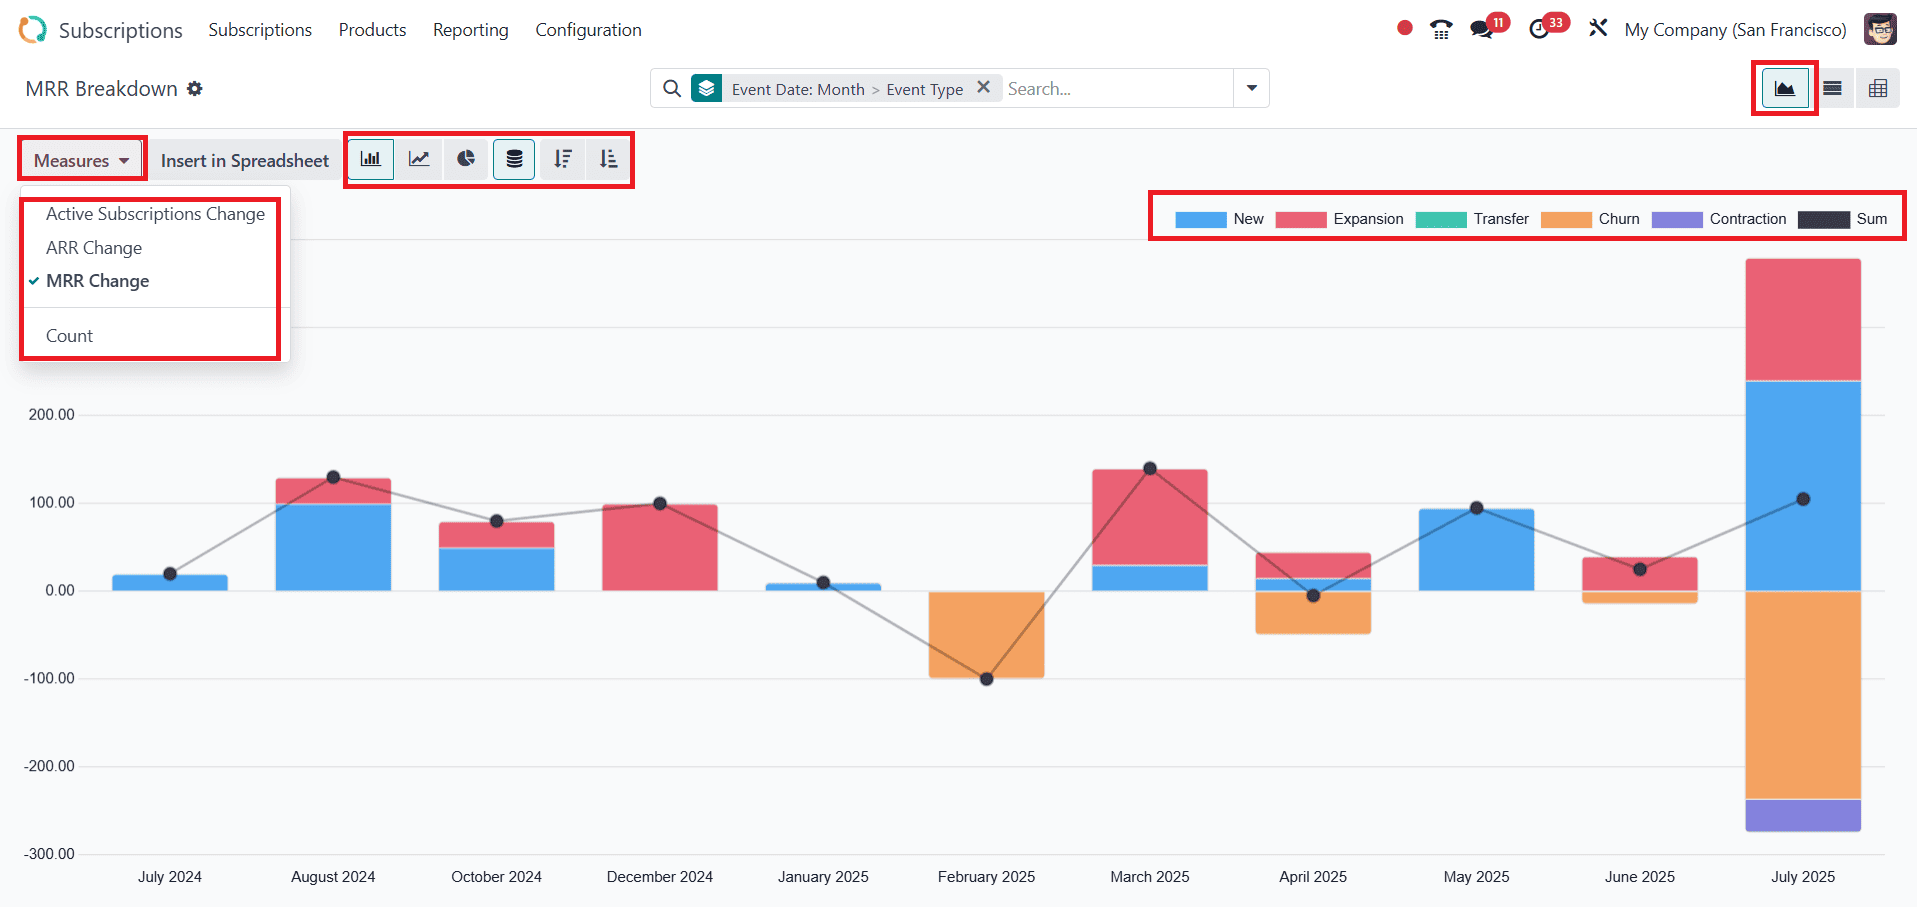
MRR Breakdown:
To get the MRR Breakdown, go to the Reporting > MRR Breakdown. Here, the graph is arranged as Graph view. You can also use visual options such as Stacked, Cumulative, Ascending, and Descending. Under the Measures drop-down menu, you can choose options such as Active Subscription Change, ARR Change, MRR Change, and Count.
The categories of New, Expansion, Transfer, Churn, Contraction, and Sum organize the graph.
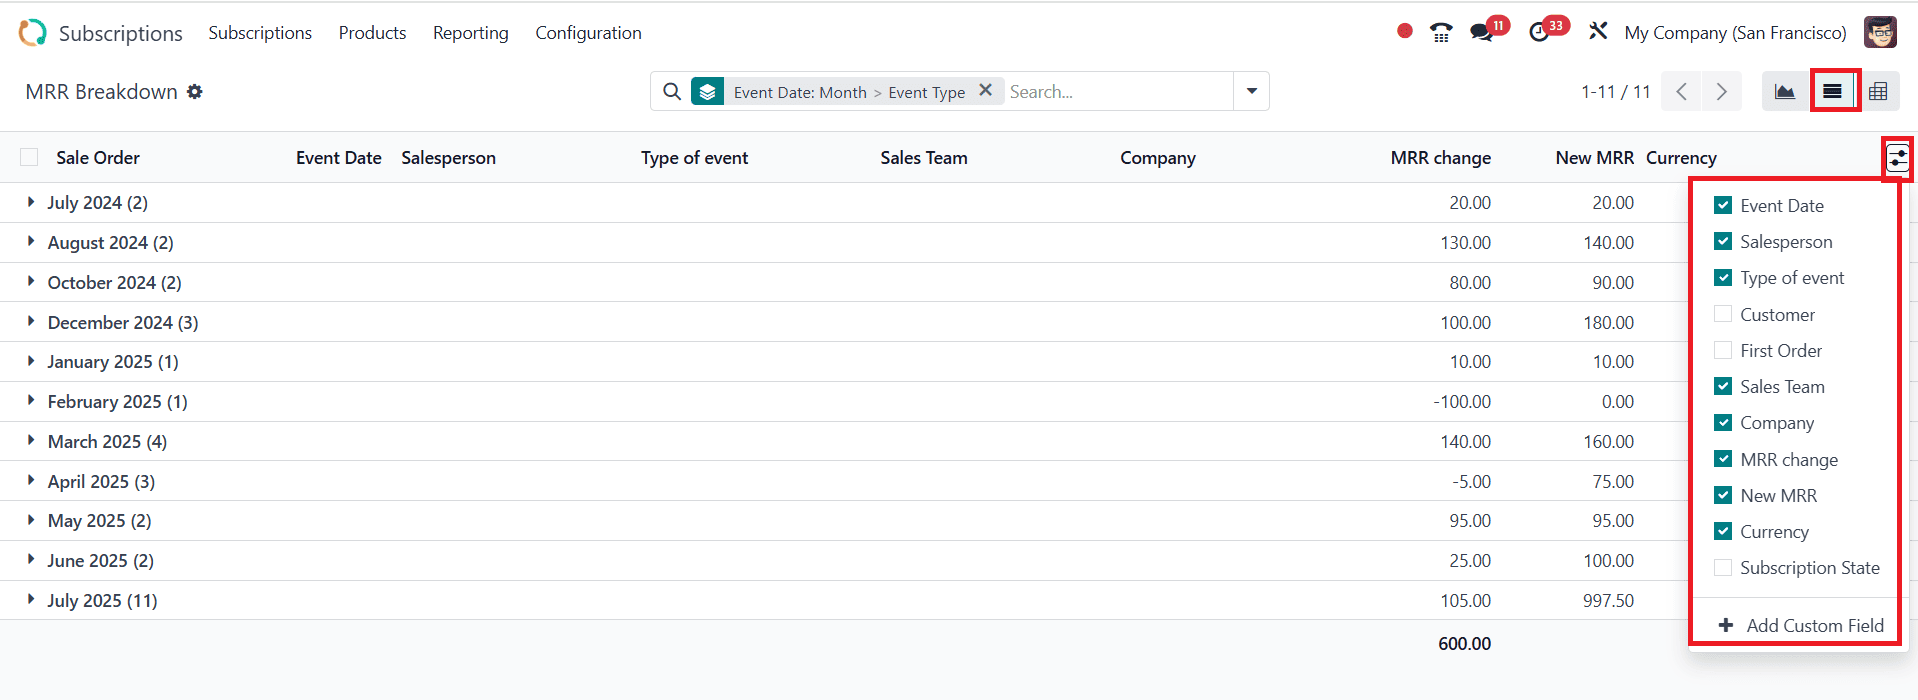
In List view, the data is arranged based on Sales Order, Event Date, Salesperson, Type of Event, Sales Team, Company, MRR change, New MRR, and Currency. You can also add new options by clicking on the dotted line on the right side of the screen, as shown below:
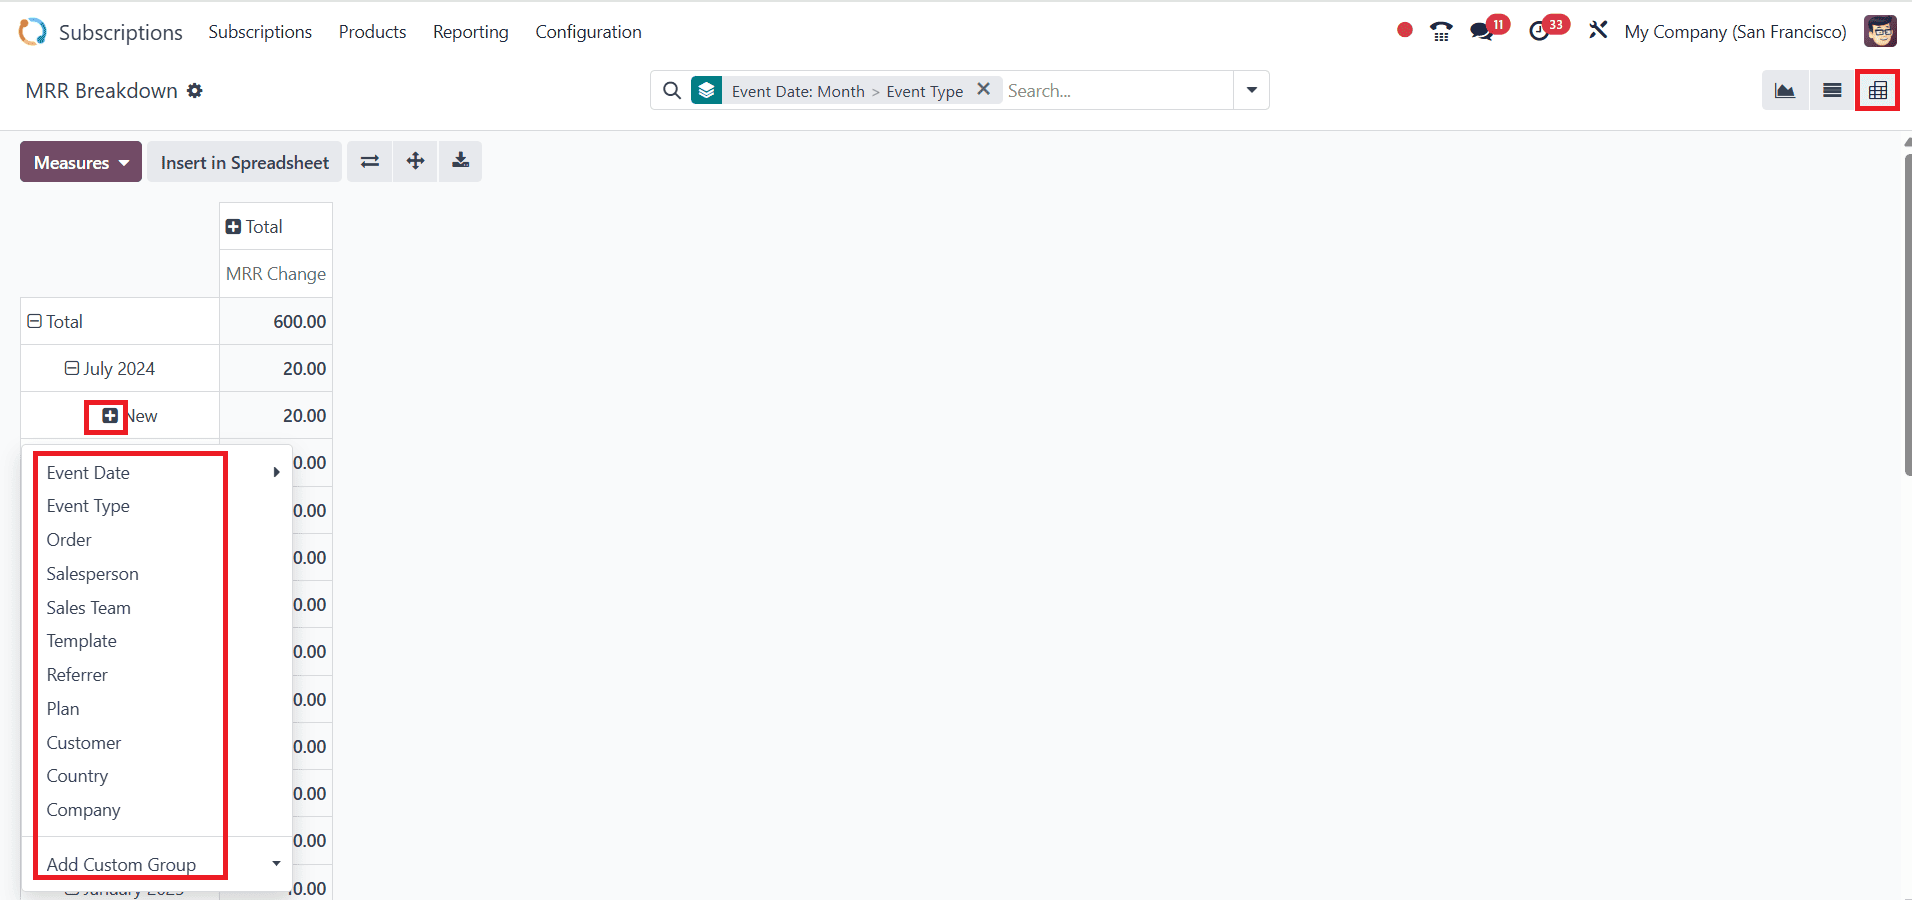
In the Pivot view, you can group the data using options such as Event Date, Event Type, Order, Salesperson, Sales Team, Template, Referrer, Plan, Customer, Country, Company, and use the Add Custom Group feature.
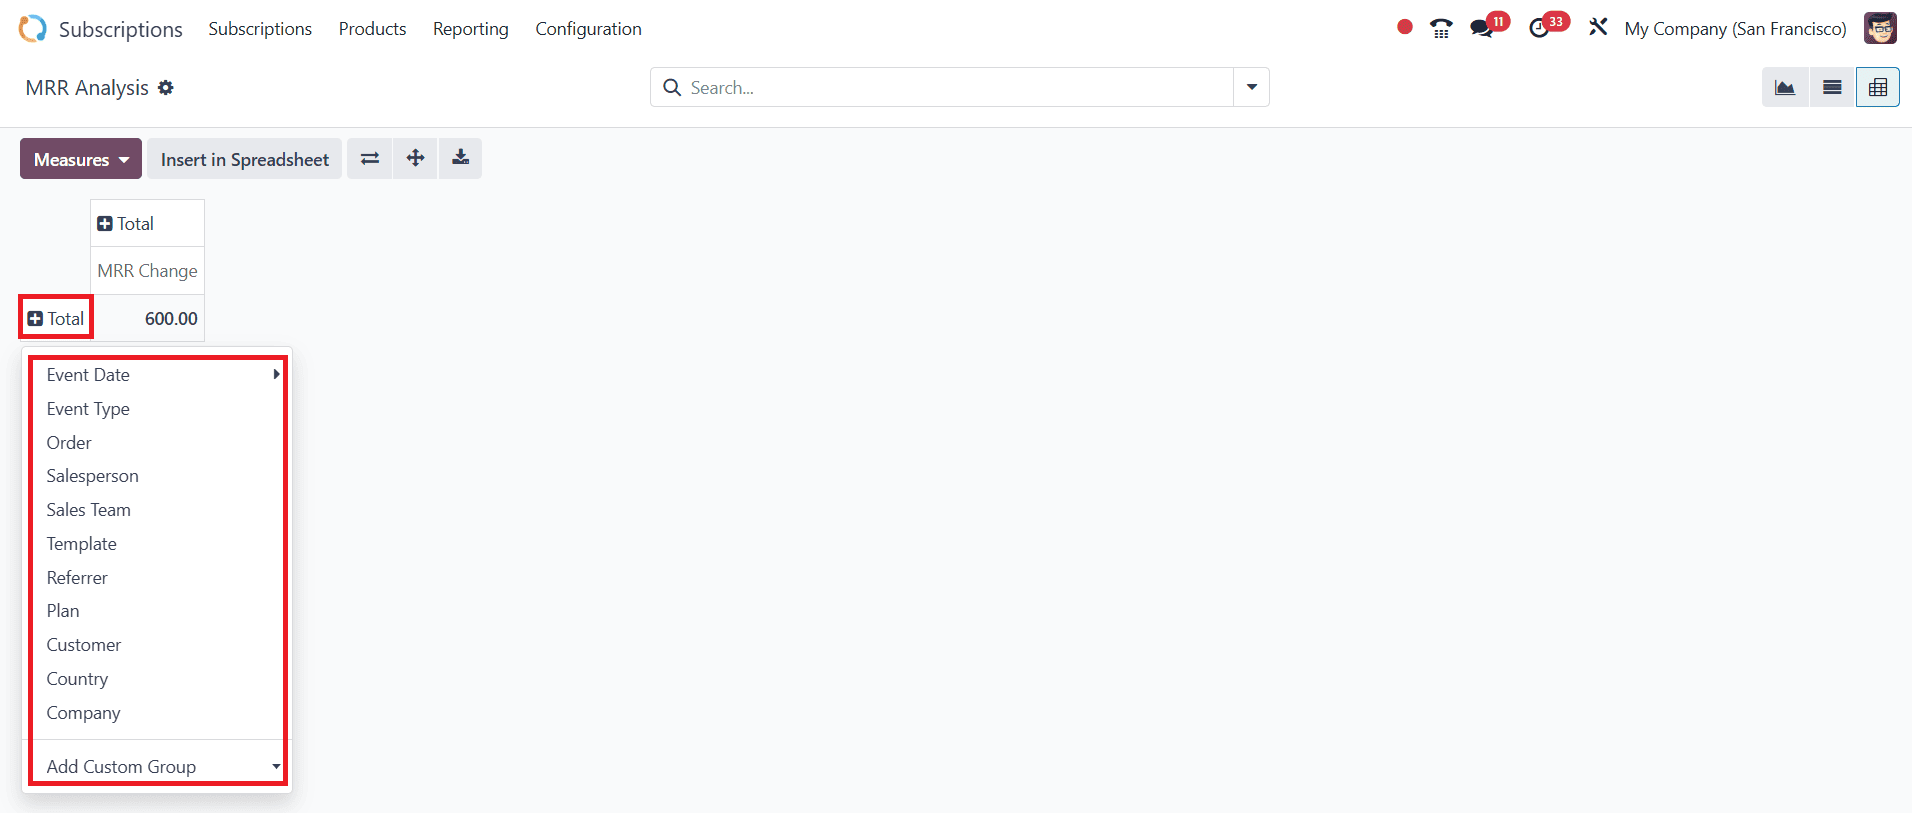
MRR Analysis:
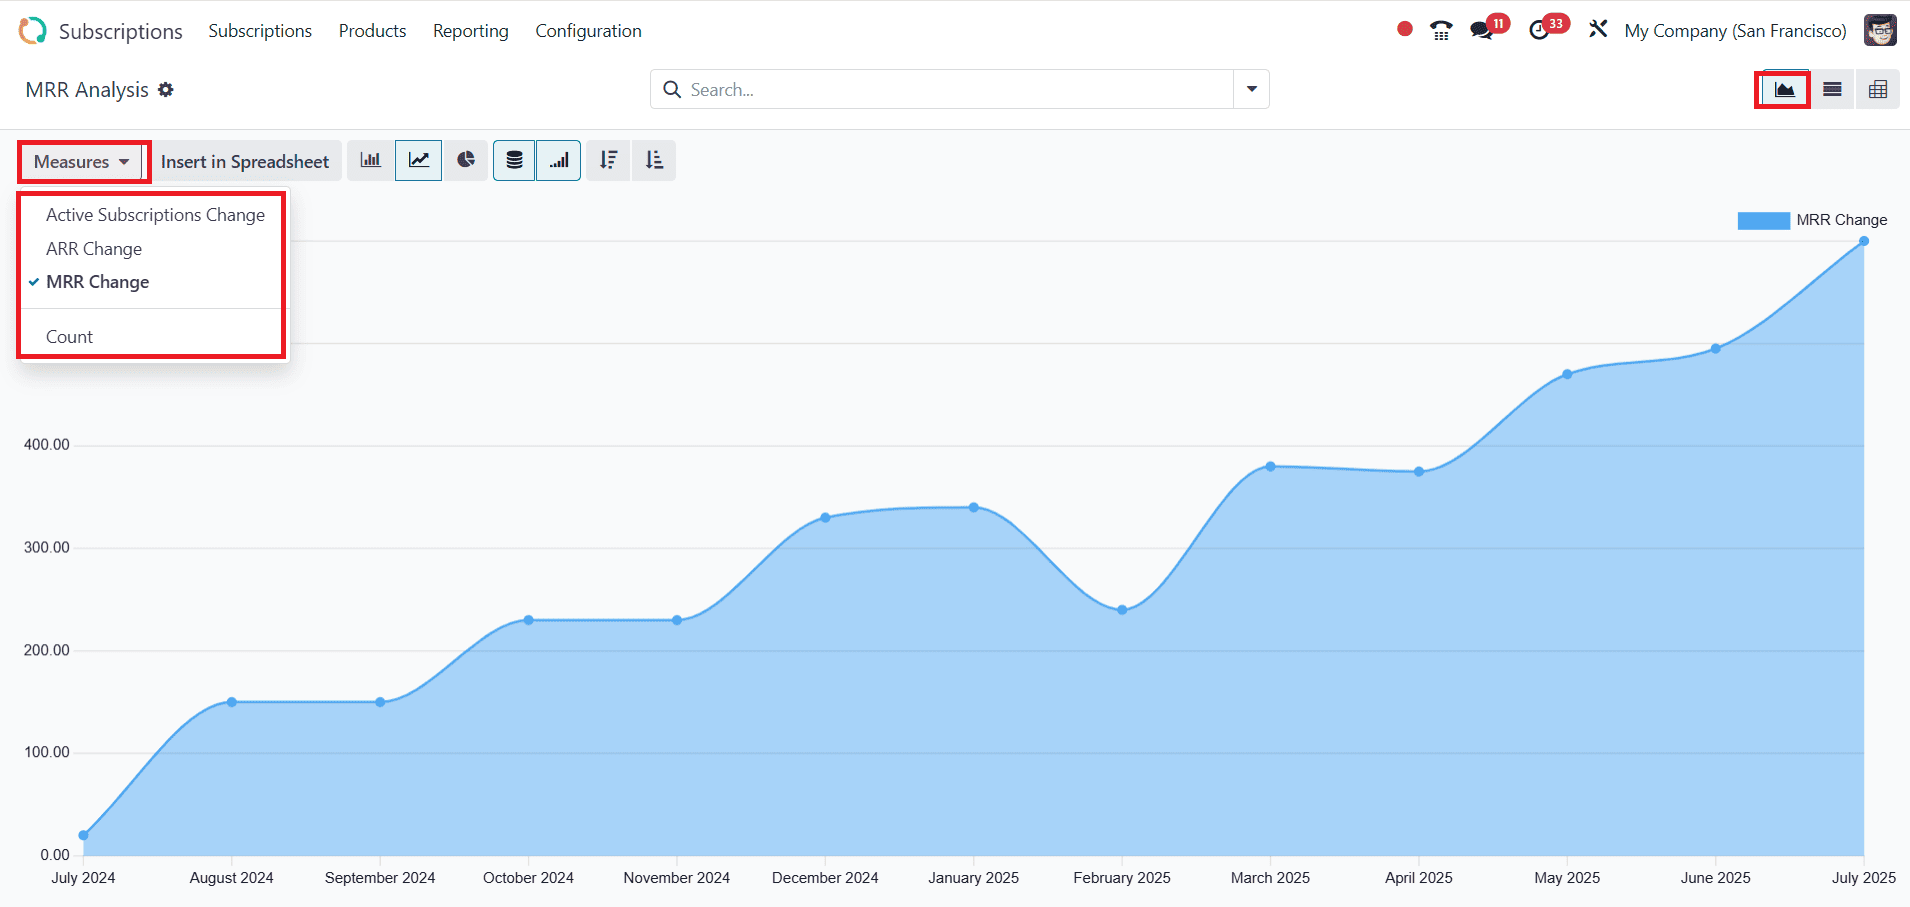
To access MRR Analysis, go to the Reporting > MRR Analysis. You can also use visual options such as Stacked, Cumulative, Ascending, and Descending. Under the Measures drop-down menu, you can choose options such as Active Subscription Change, ARR Change, MRR Change, and Count.
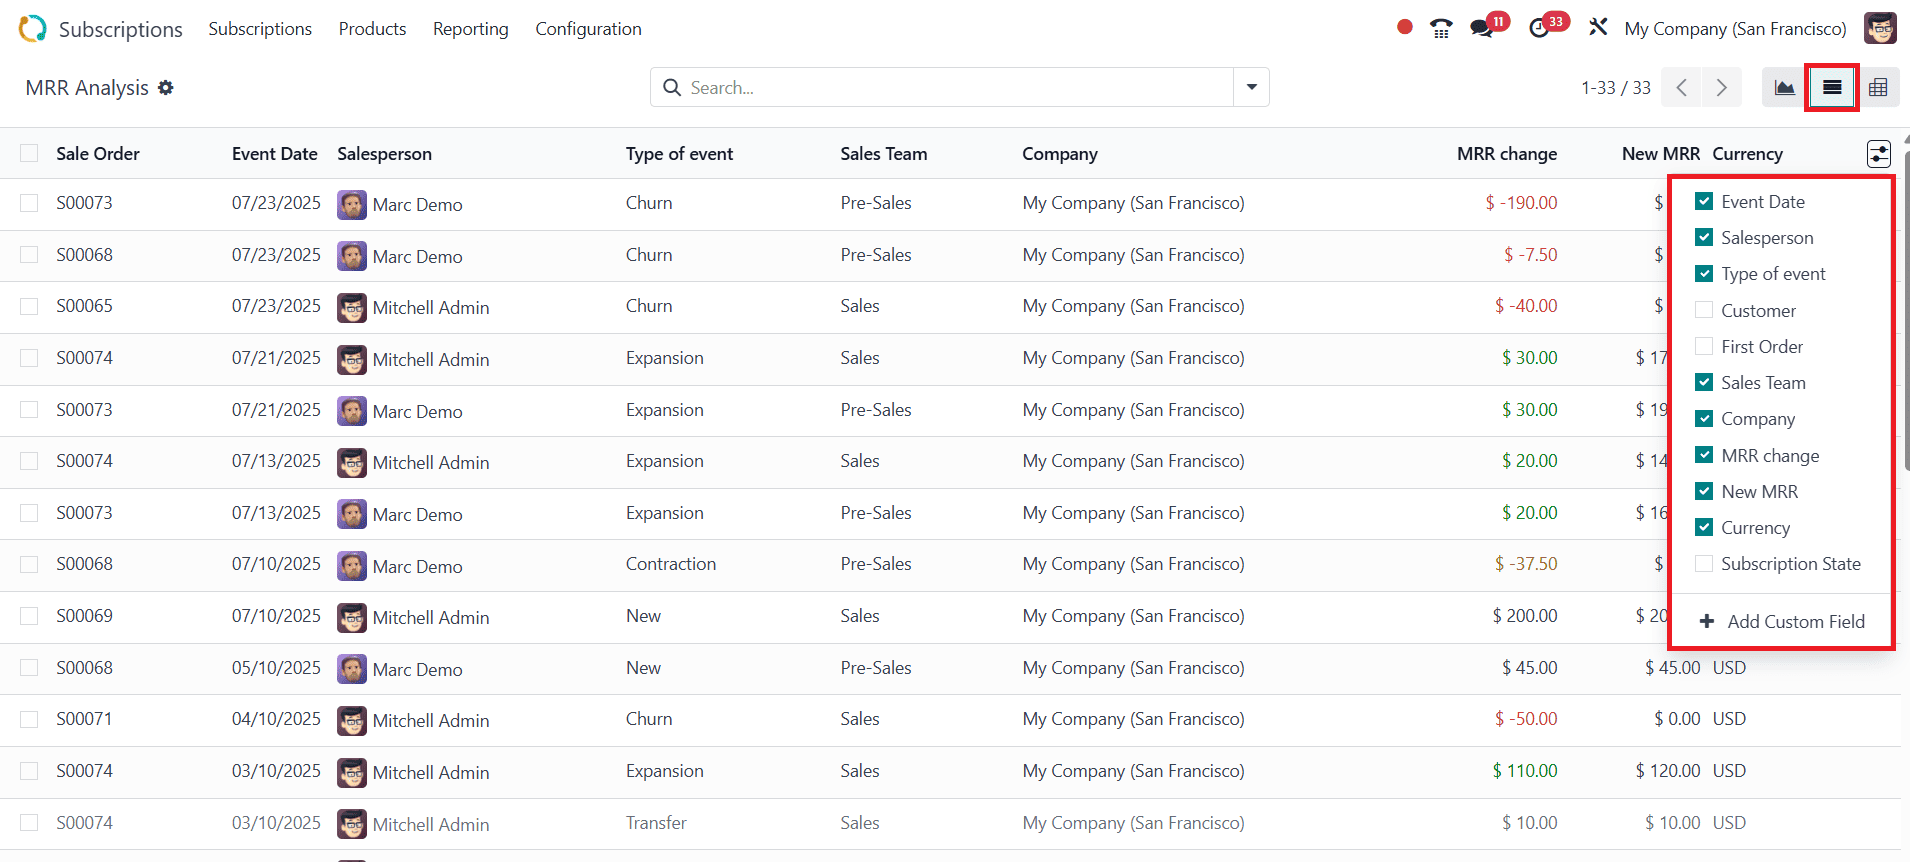
In List view, the data is arranged based on Sales Order, Event Date, Salesperson, Type of Event, Sales Team, Company, MRR change, New MRR, and Currency. You can also add new options by clicking on the dotted line on the right side of the screen, as shown below:
In the Pivot view, you can group the data using options such as Event Date, Event Type, Order, Salesperson, Sales Team, Template, Referrer, Plan, Customer, Country, Company, and use the Add Custom Group feature.
Conclusion:
In conclusion, Odoo 18’s subscription reporting features improve insight into the recurring revenue operations of your company. The system makes complex metrics easier to understand and displays data clearly and helpfully. These reports aid in strategy and performance enhancements, from analyzing churn to developing profitable programs. For long-term business success, Odoo 18 ensures that you’re not just gathering data, but also turning it into insightful knowledge.
To read more about How to Manage a Subscription Renewal in Odoo 18, refer to our blog How to Manage a Subscription Renewal in Odoo 18.