Dashboard:
When you open the ESG module in Odoo 19 Enterprise, the system displays the Dashboard menu as the module's default dashboard. The Dashboard menu serves as a centralized platform where companies can Collect, Measure, and Act upon data related to sustainability, ethical practices, and corporate governance.
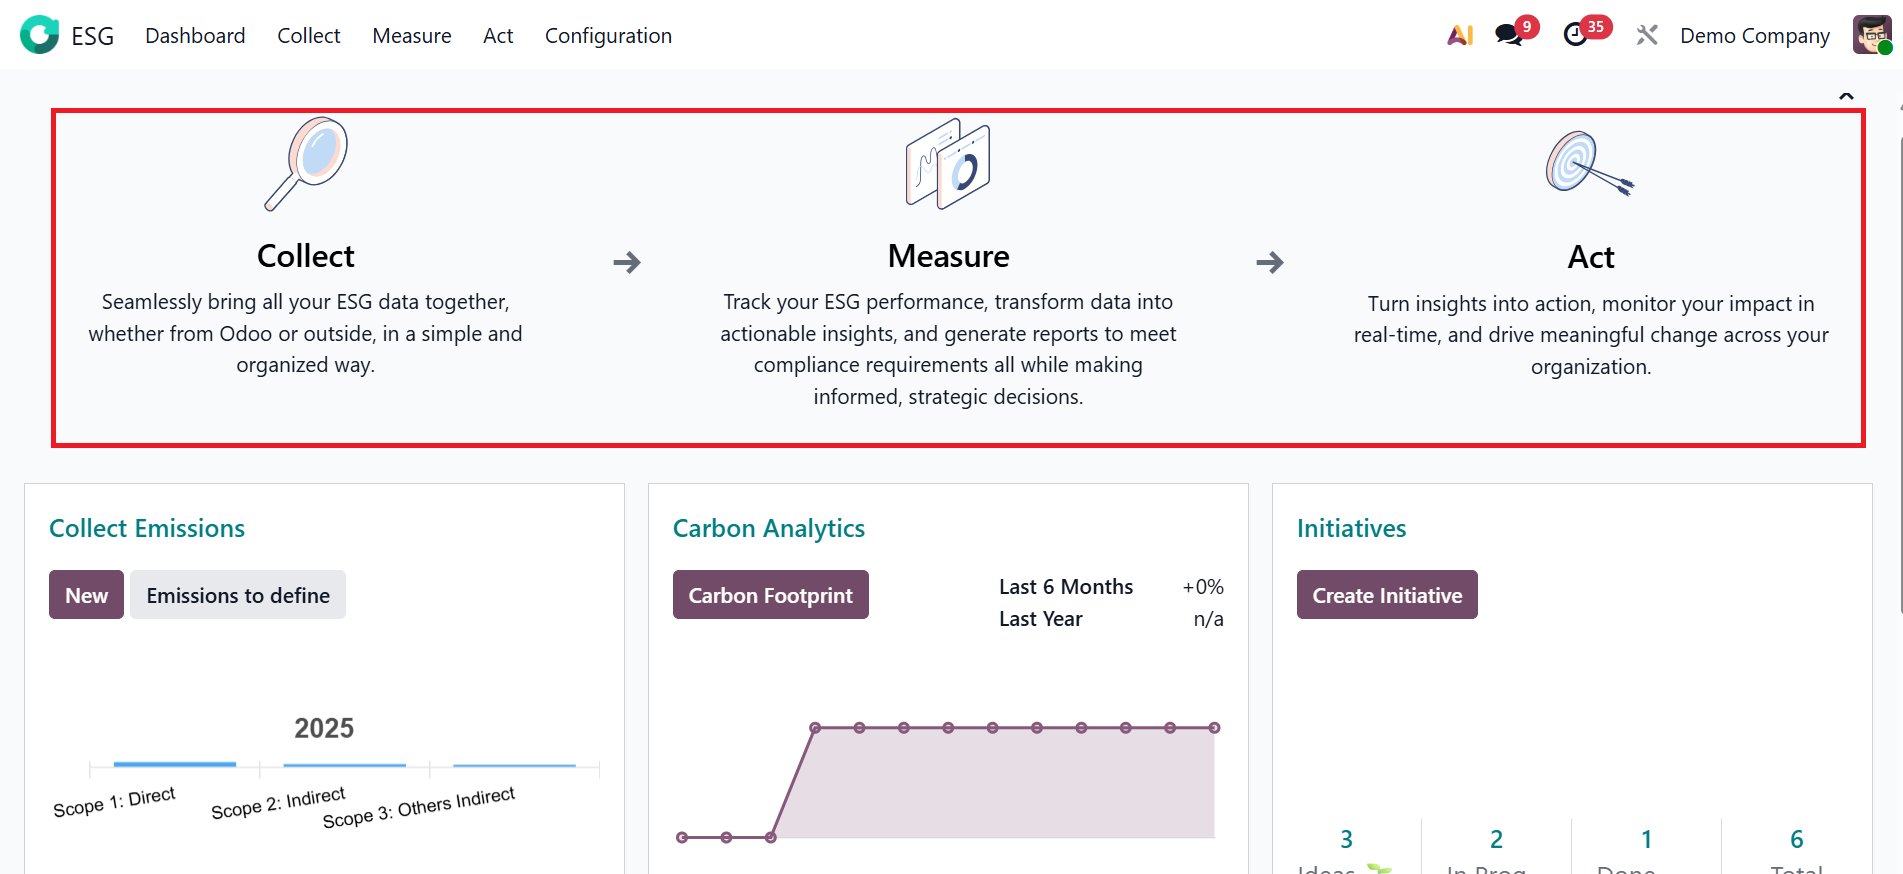
- *Collect:The first stage in the ESG workflow is Collect. This stage enables organizations to collect all ESG-related data seamlessly from both Odoo and external sources. The data includes emissions, energy usage, water consumption, and social impact metrics
- *Measure:The data moves to the Measure stage once it has been collected. This stage transforms raw data into insightful reports and performance indicators. This provides visual analytics, allowing users to compare results from the previous months or years.
- *Act: Then, it moves to the Act stage, which focuses on turning insights into concrete actions. Organizations can create sustainability initiatives, monitor their effectiveness, and track results in real time.
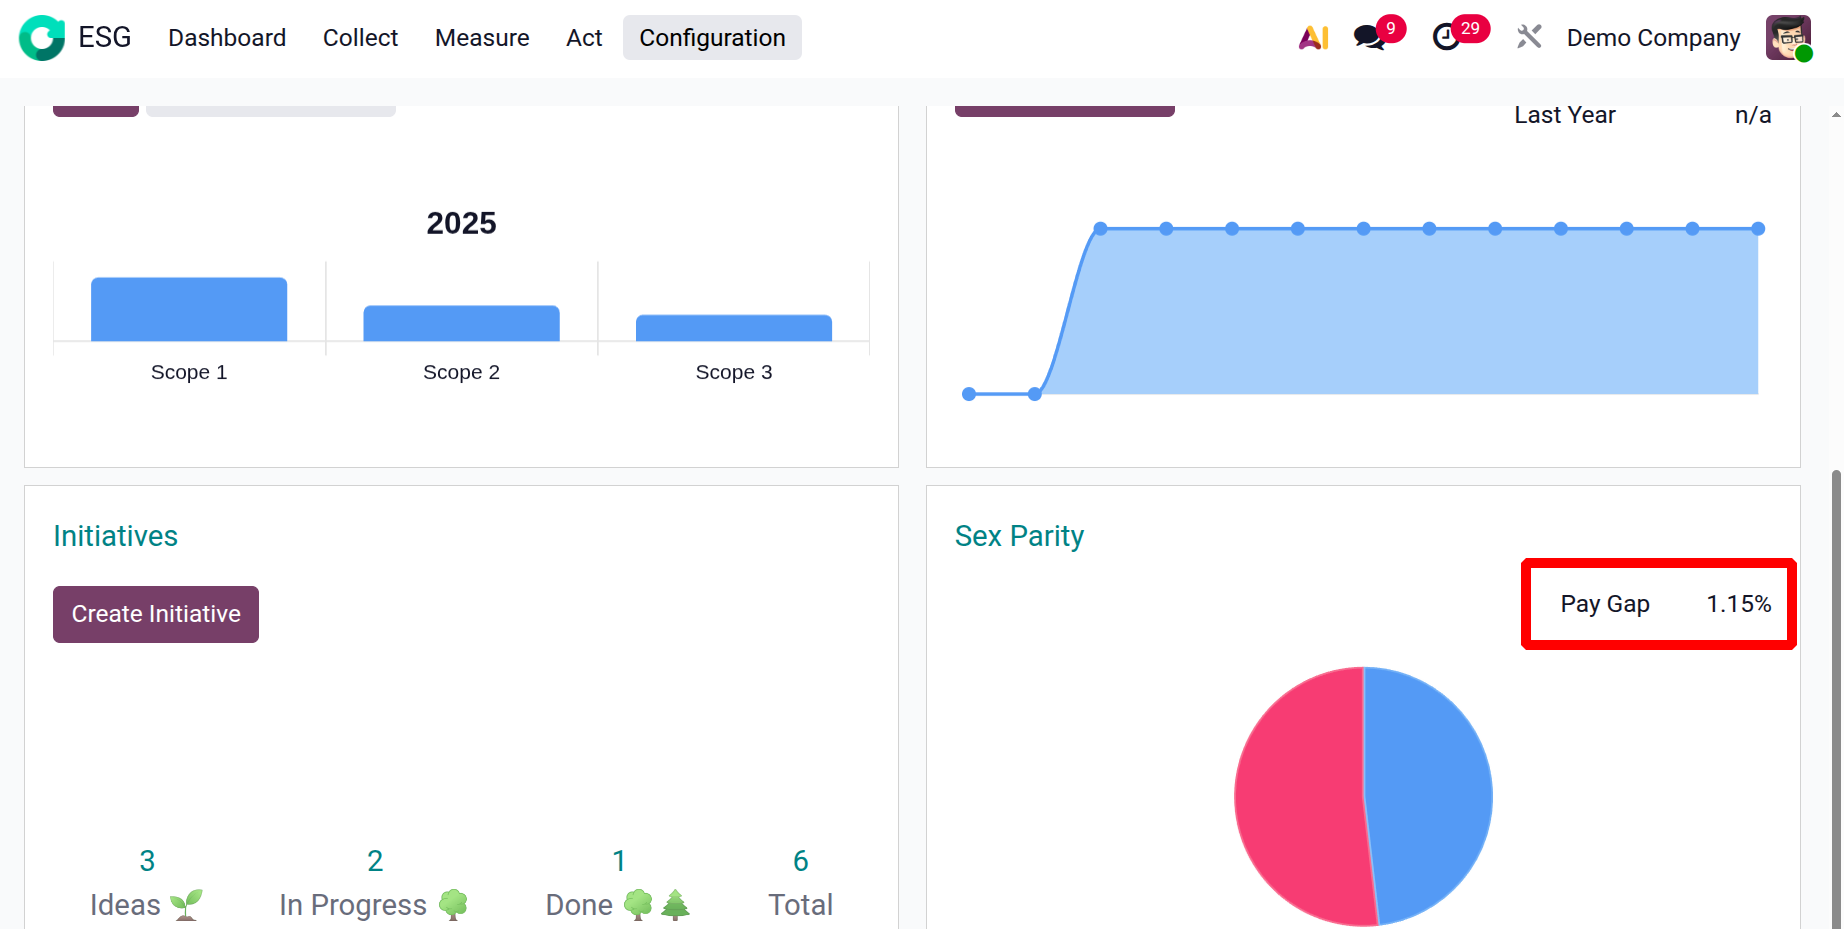
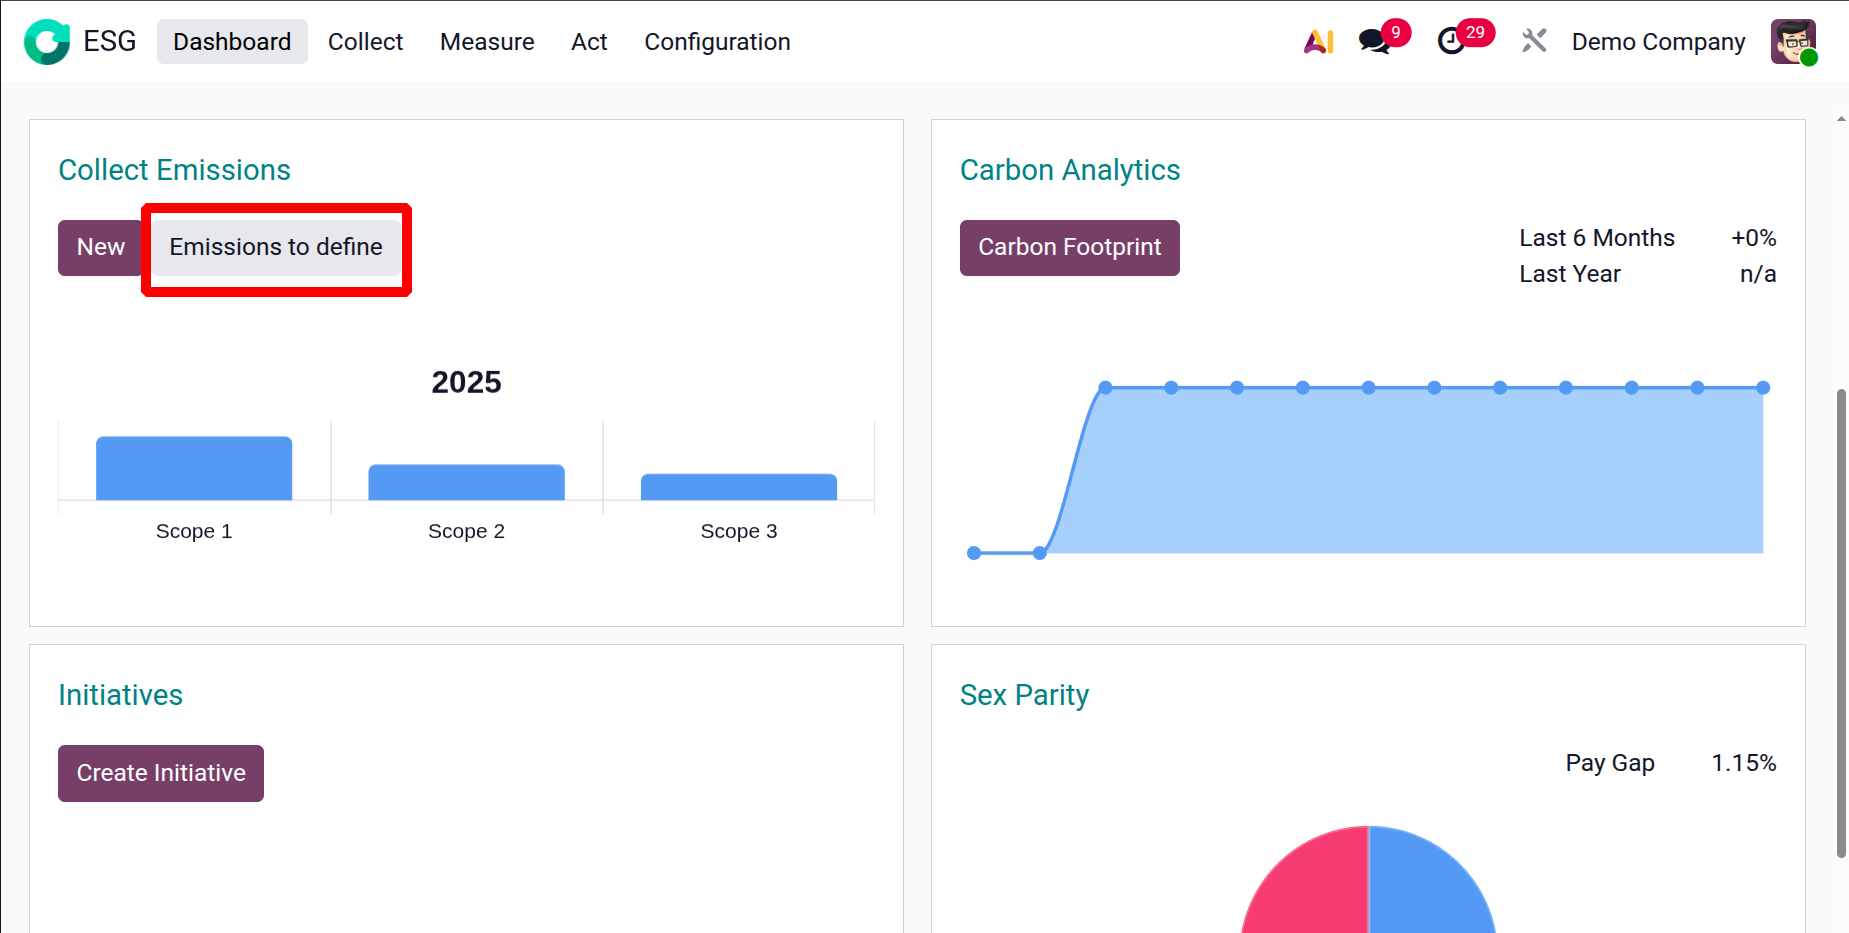
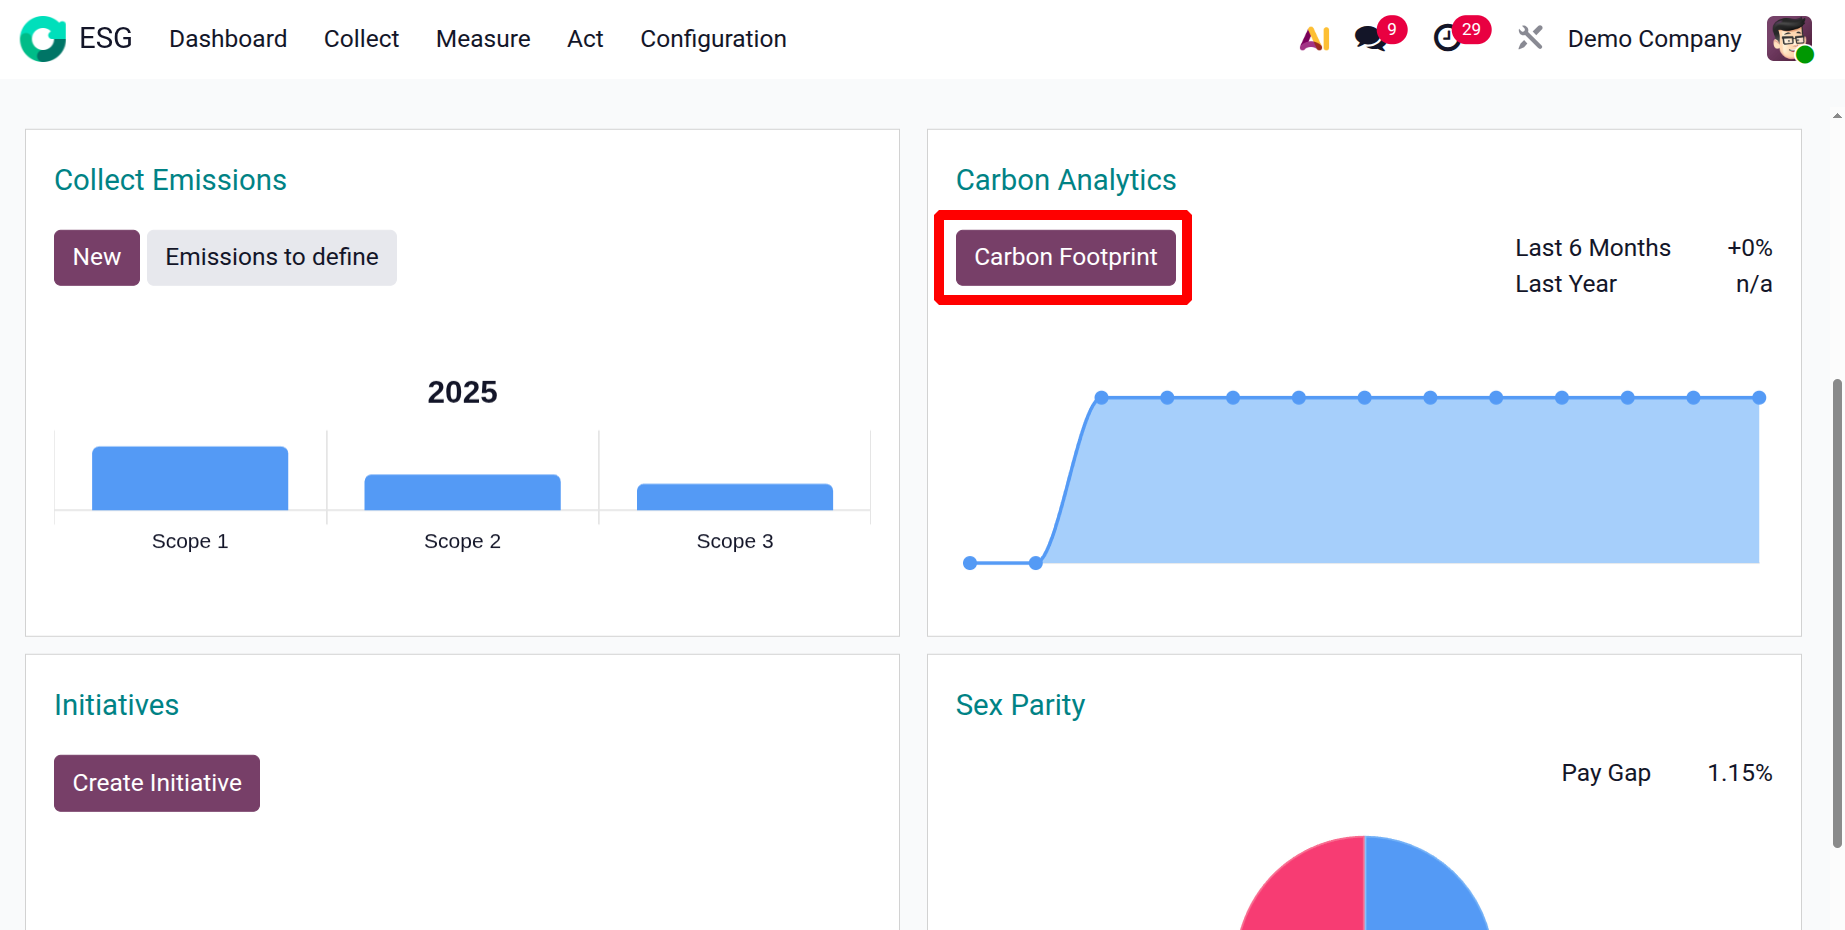
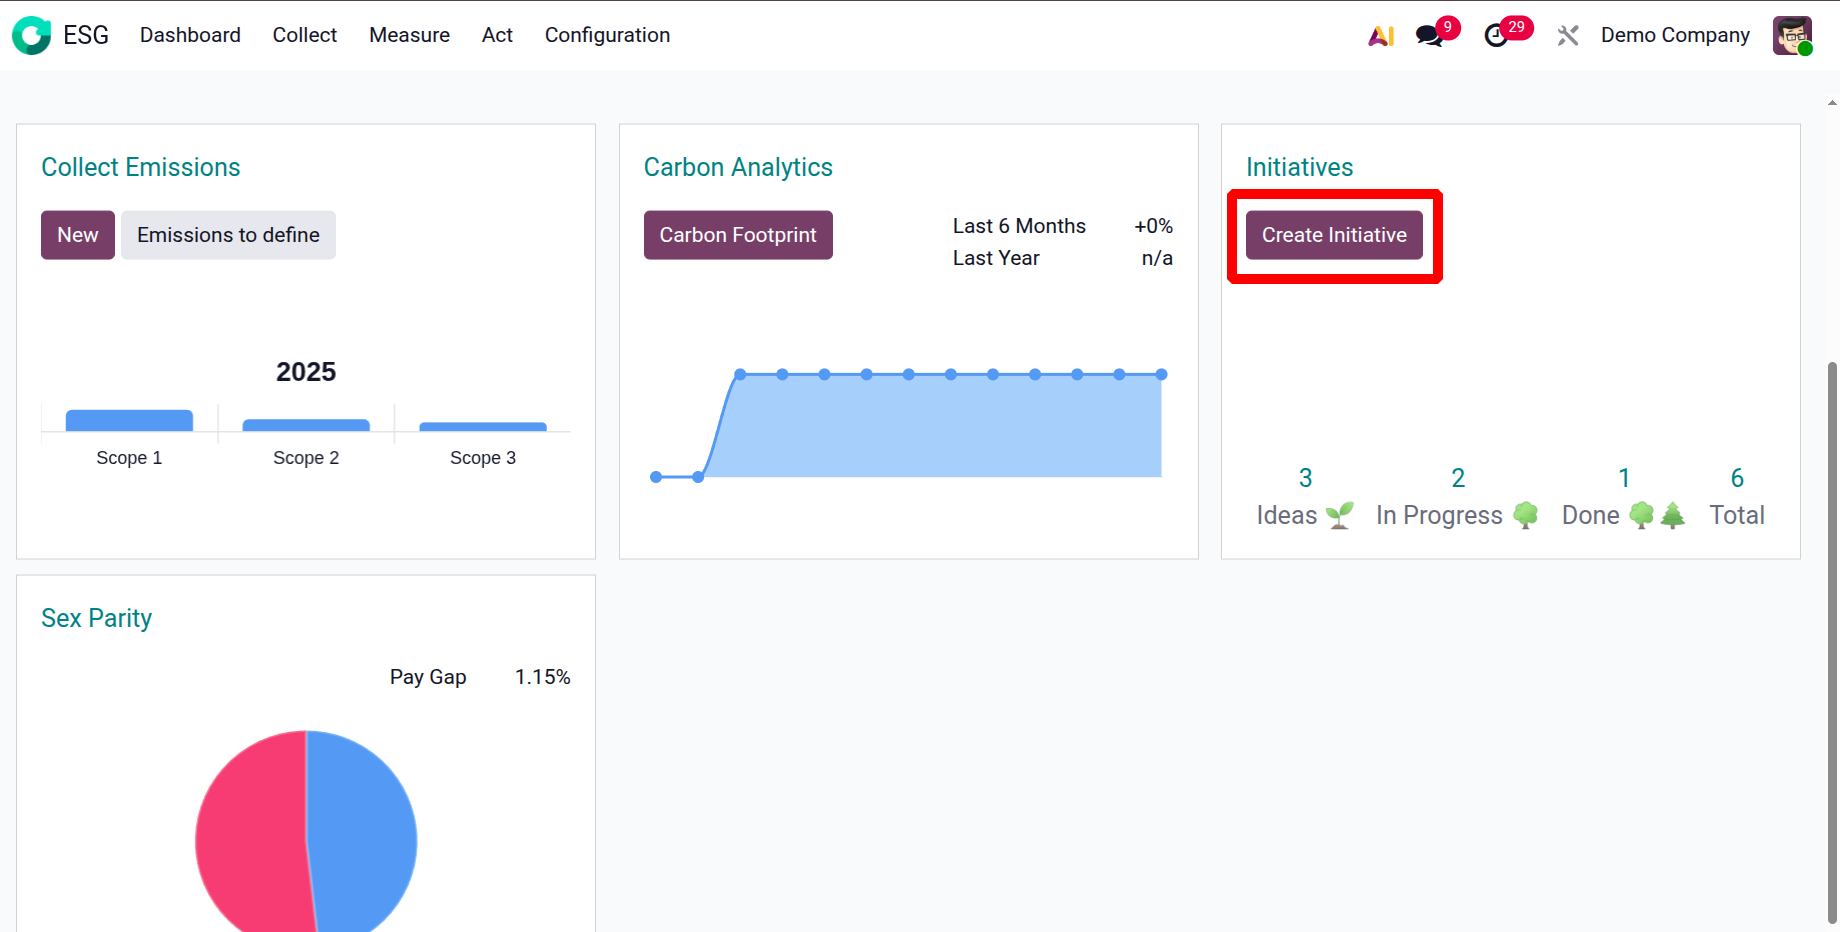
You can view four dashboard sections: Collect Emissions, Carbon Analytics, Initiatives, and Sex Parity.
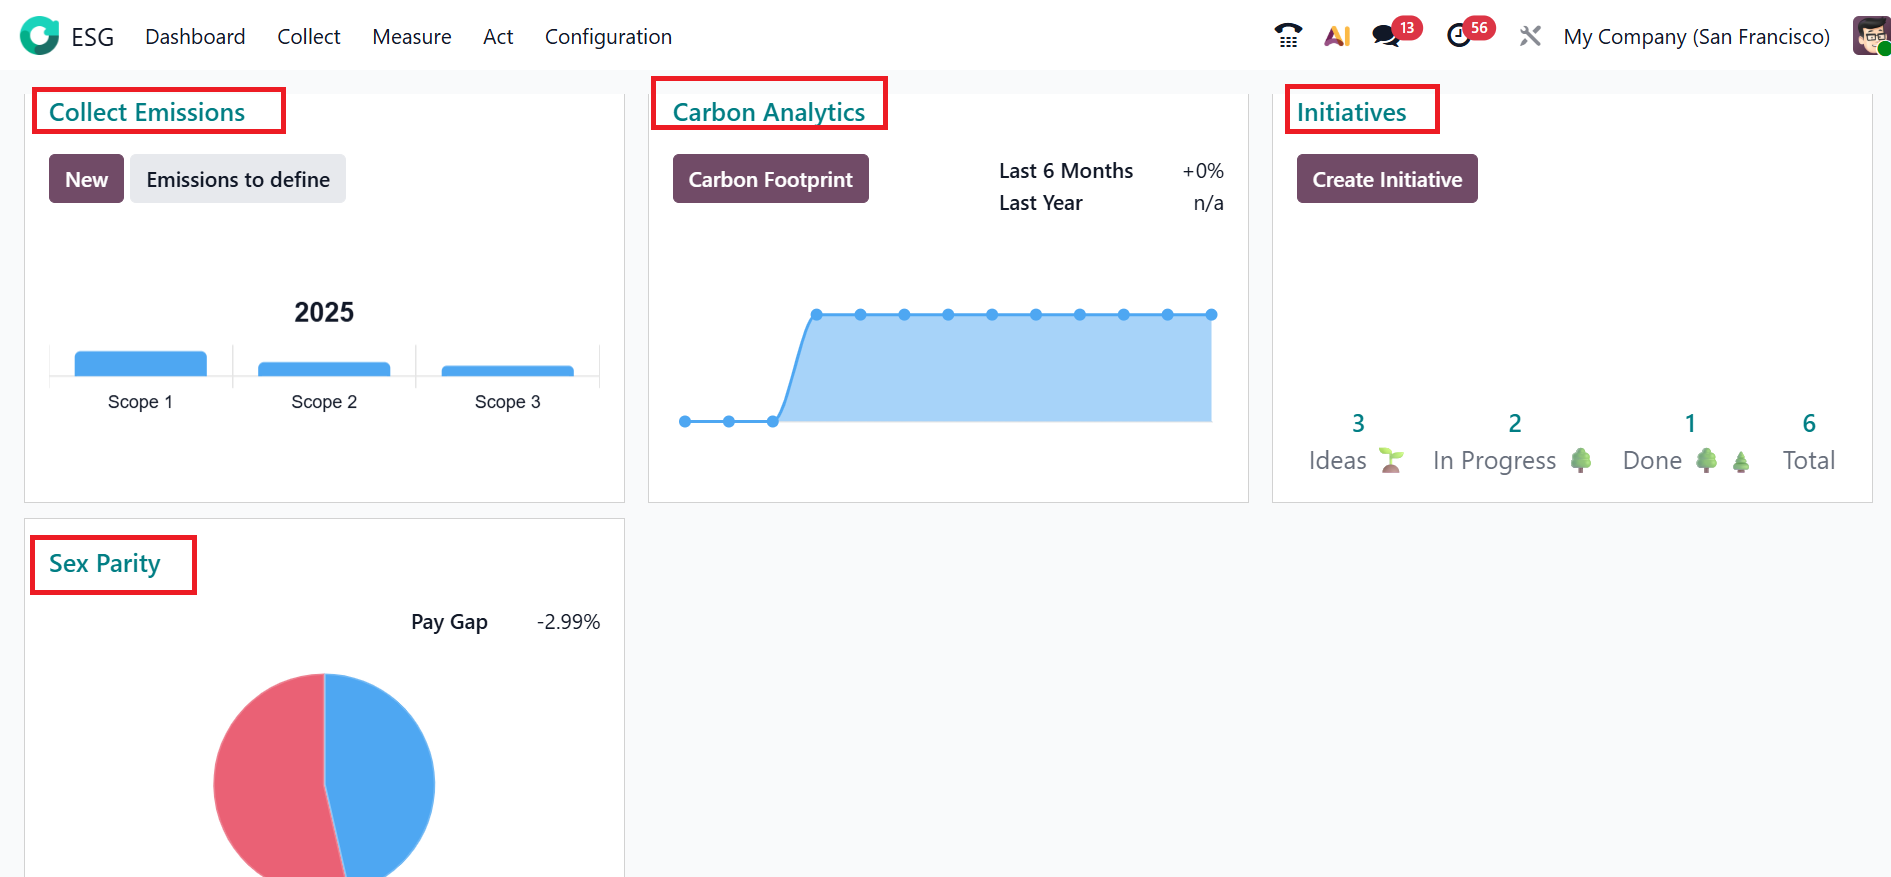
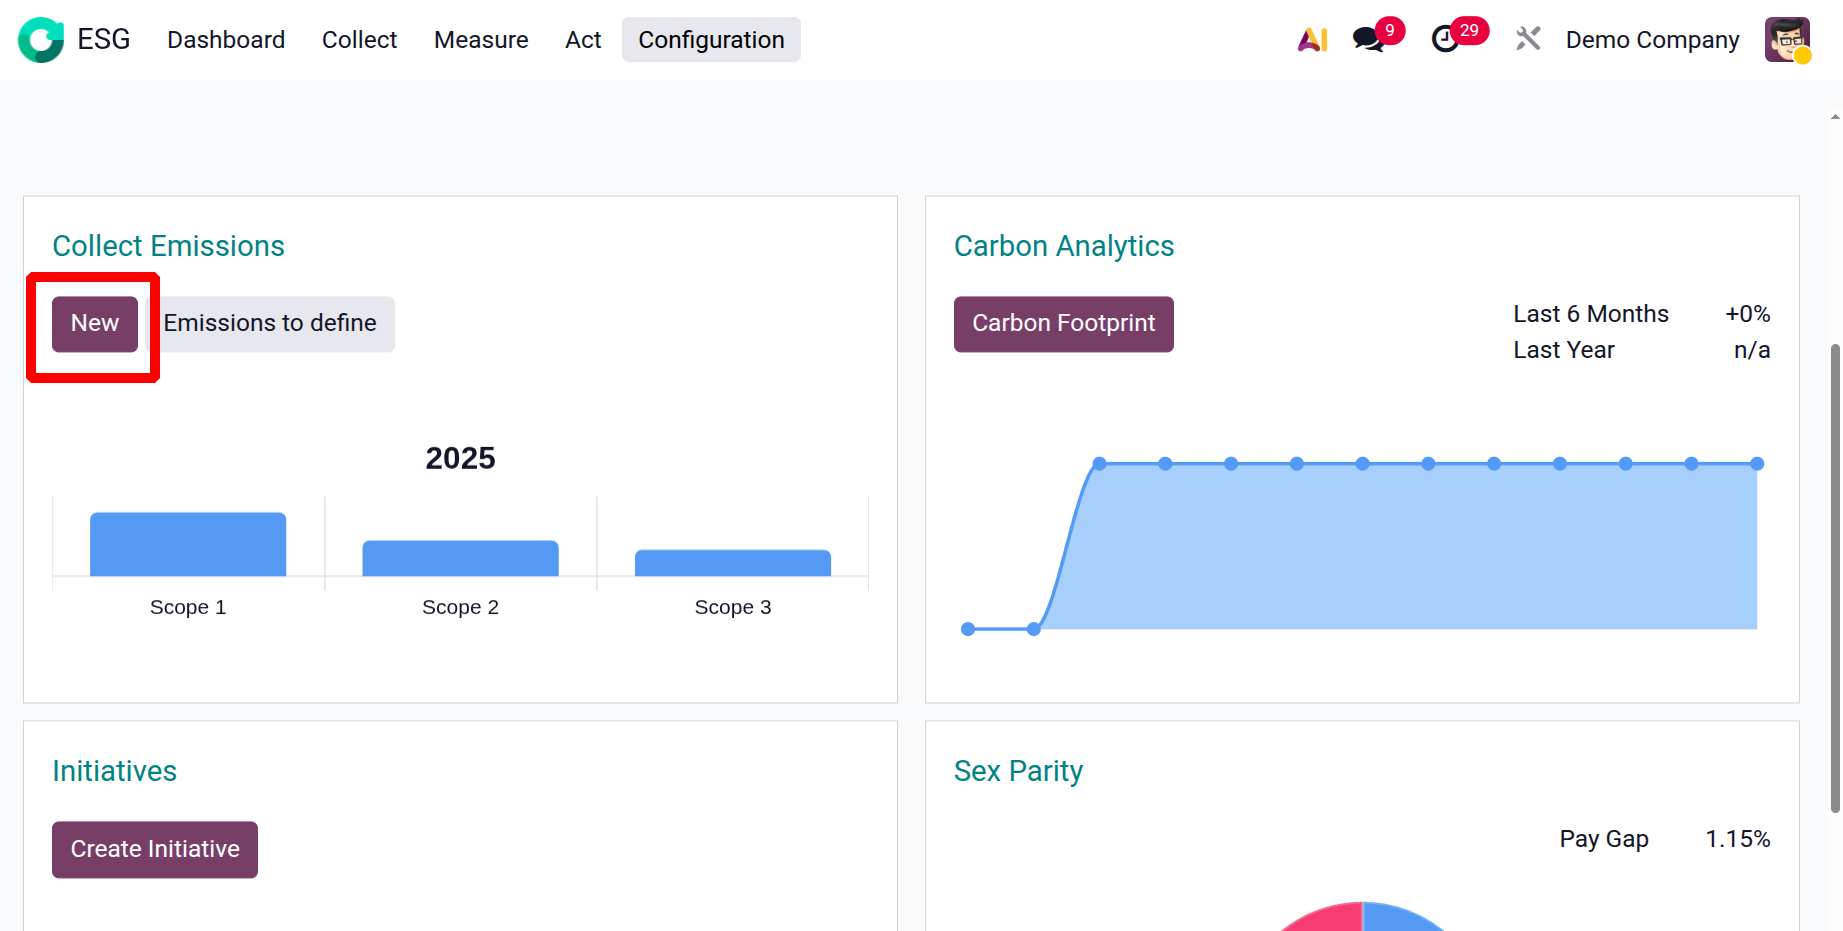
1.1 Collect Emissions:
The Collect Emissions section is designed to document and categorize all greenhouse gas emissions generated directly or indirectly by an organization. It helps businesses understand where emissions originate, how much is being emitted, and what areas need improvement.
Here, you can access three categories of emission data—Scope 1, Scope 2, and Scope 3—each representing a different source of emissions. Scope 1 encompasses emissions produced directly by sources over which the organization has ownership or control. The Scope 2 represents the indirect emissions from purchased electricity, such as electricity or heat consumed by the organization. The Scope 3 represents the other indirect emissions from supply chains.
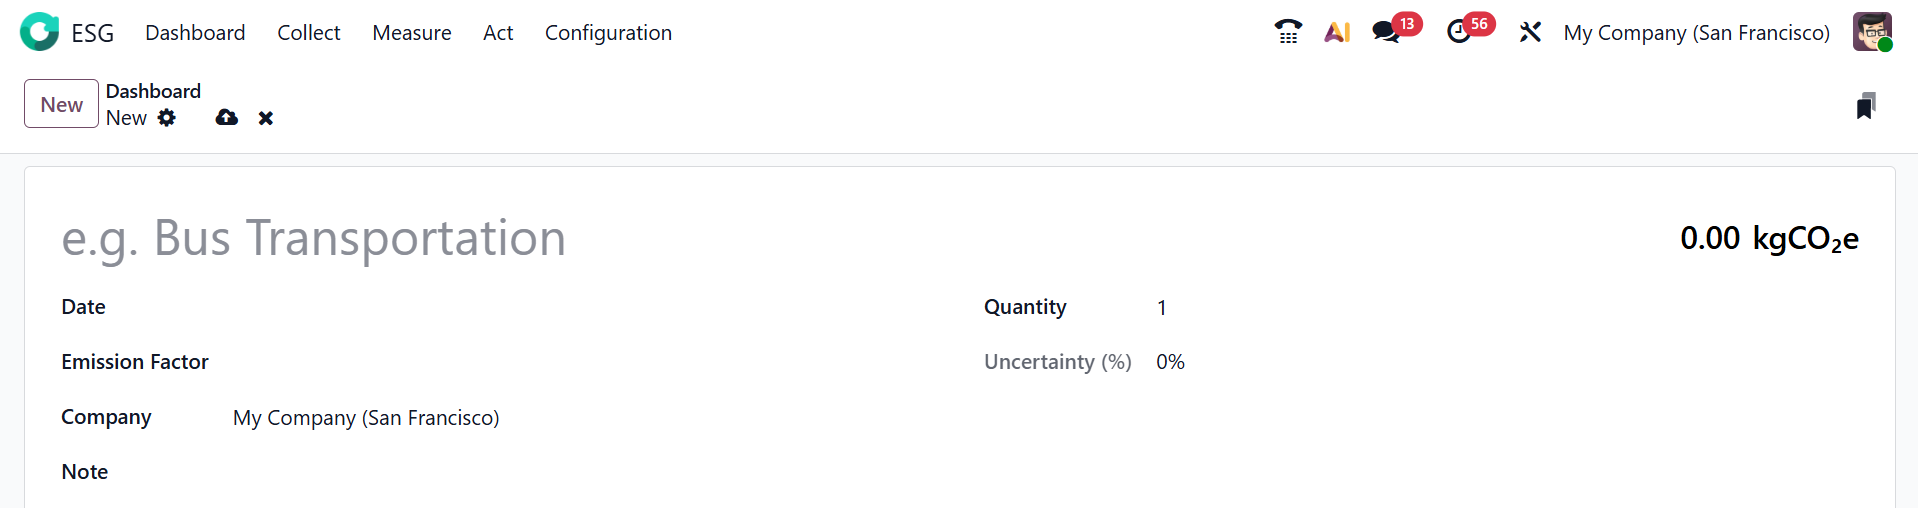
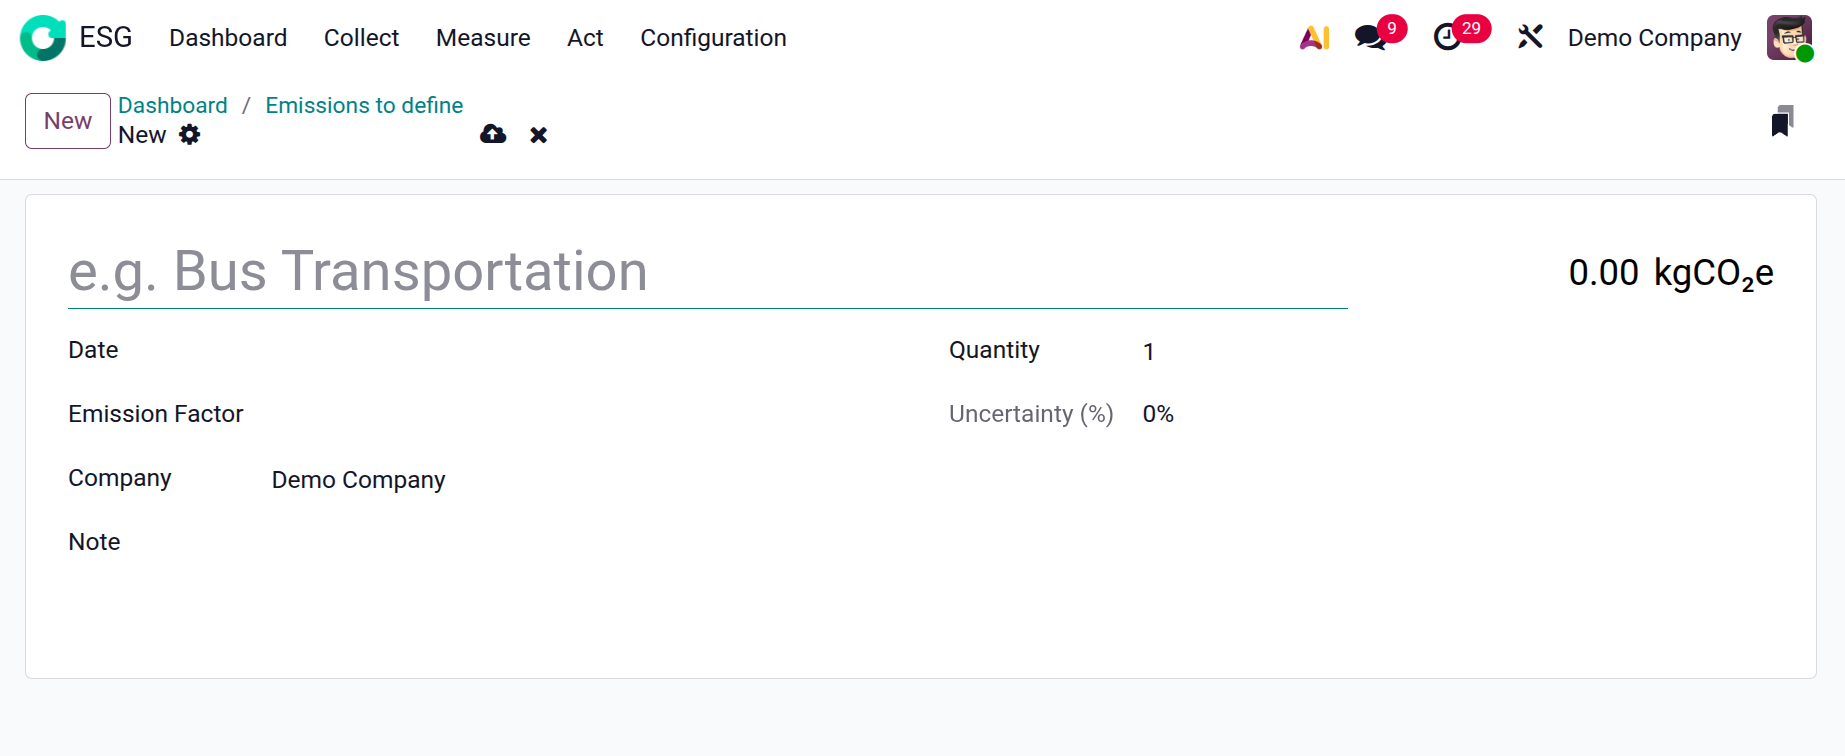
To create a new emission record, click on the New button as shown below:
First, add the source causing the emission, then enter the specific date when the emission occurred or was measured in the Date field. In the Emission Factor field, you can select a factor from the list, which shows a standard rate used to calculate emissions. After selecting an emission factor, the total carbon emission in kilograms of CO2 will be displayed automatically. Select the company the emission record belongs to in the Company field. The Notes field can be used to provide additional context or comments for the emission entry. In the Quantity field, specify the total amount of resources utilized. In the Uncertainty field, you can view the possible margin of error or variation in the emission data.
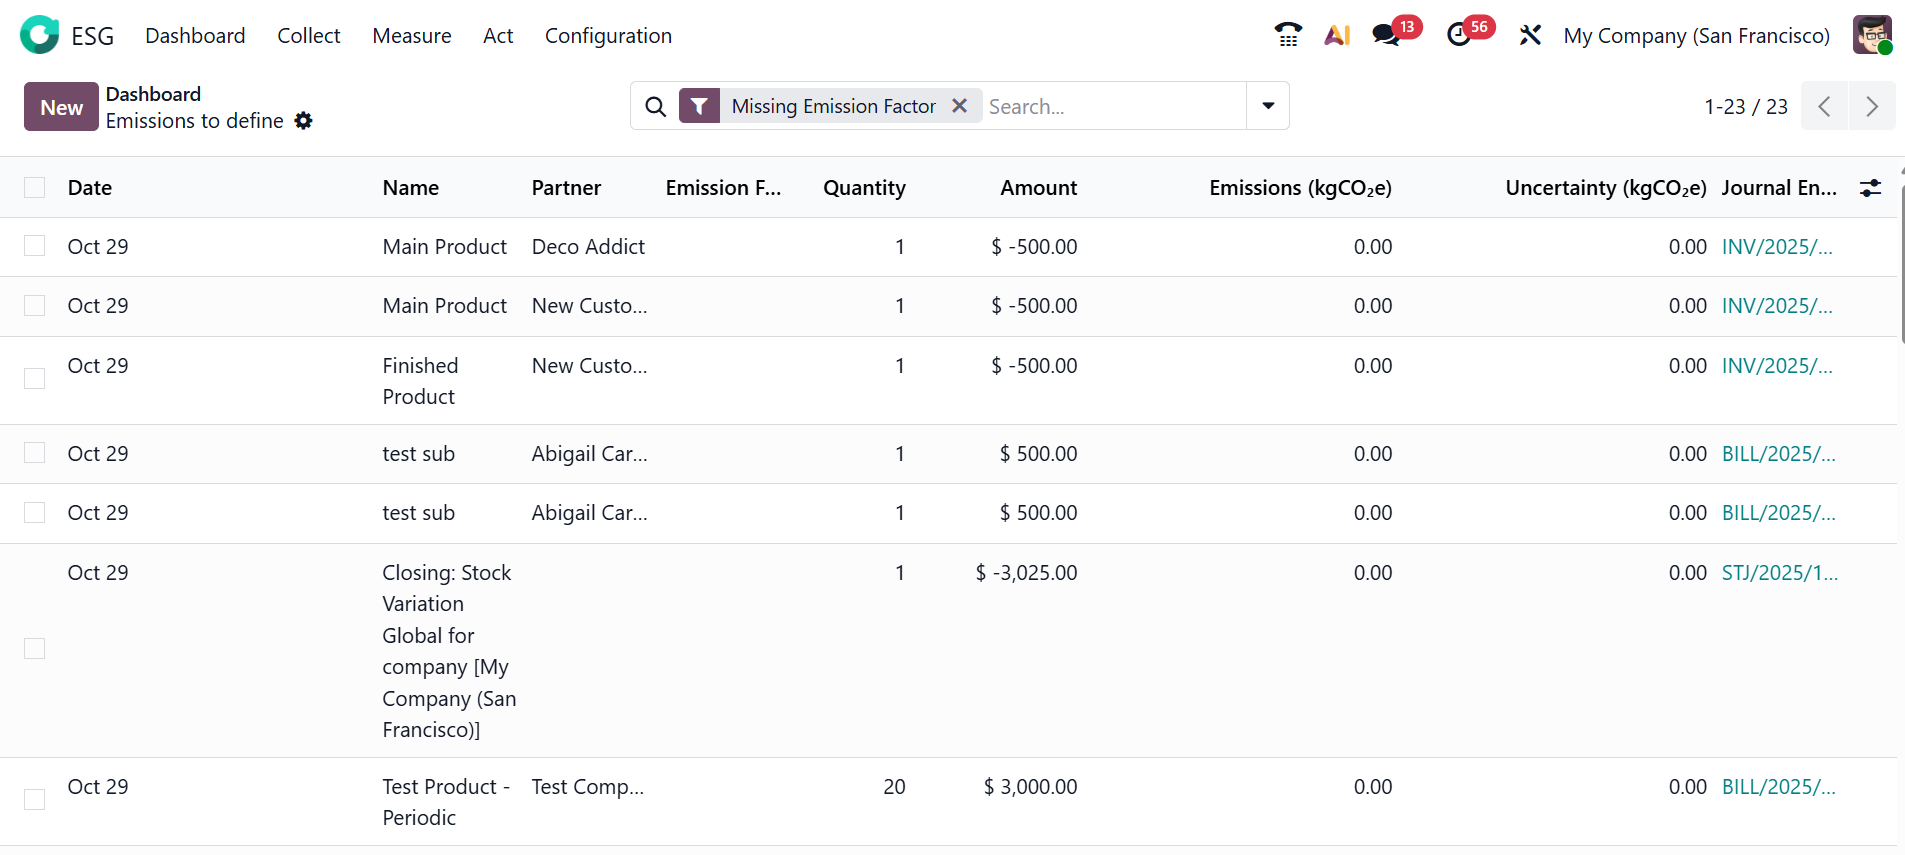
When you click the Emissions to Define button, a new window opens, displaying all existing emission reports in a List View.
To create a new emission report, click the New button and follow the steps described above. Here, you can view the details of the emission reports, such as Date, Name, Partner, Emission Factor, Quantity, Amount, Emissions (kgCO2e), Uncertainty (kgCO2e), and Journal Entry.
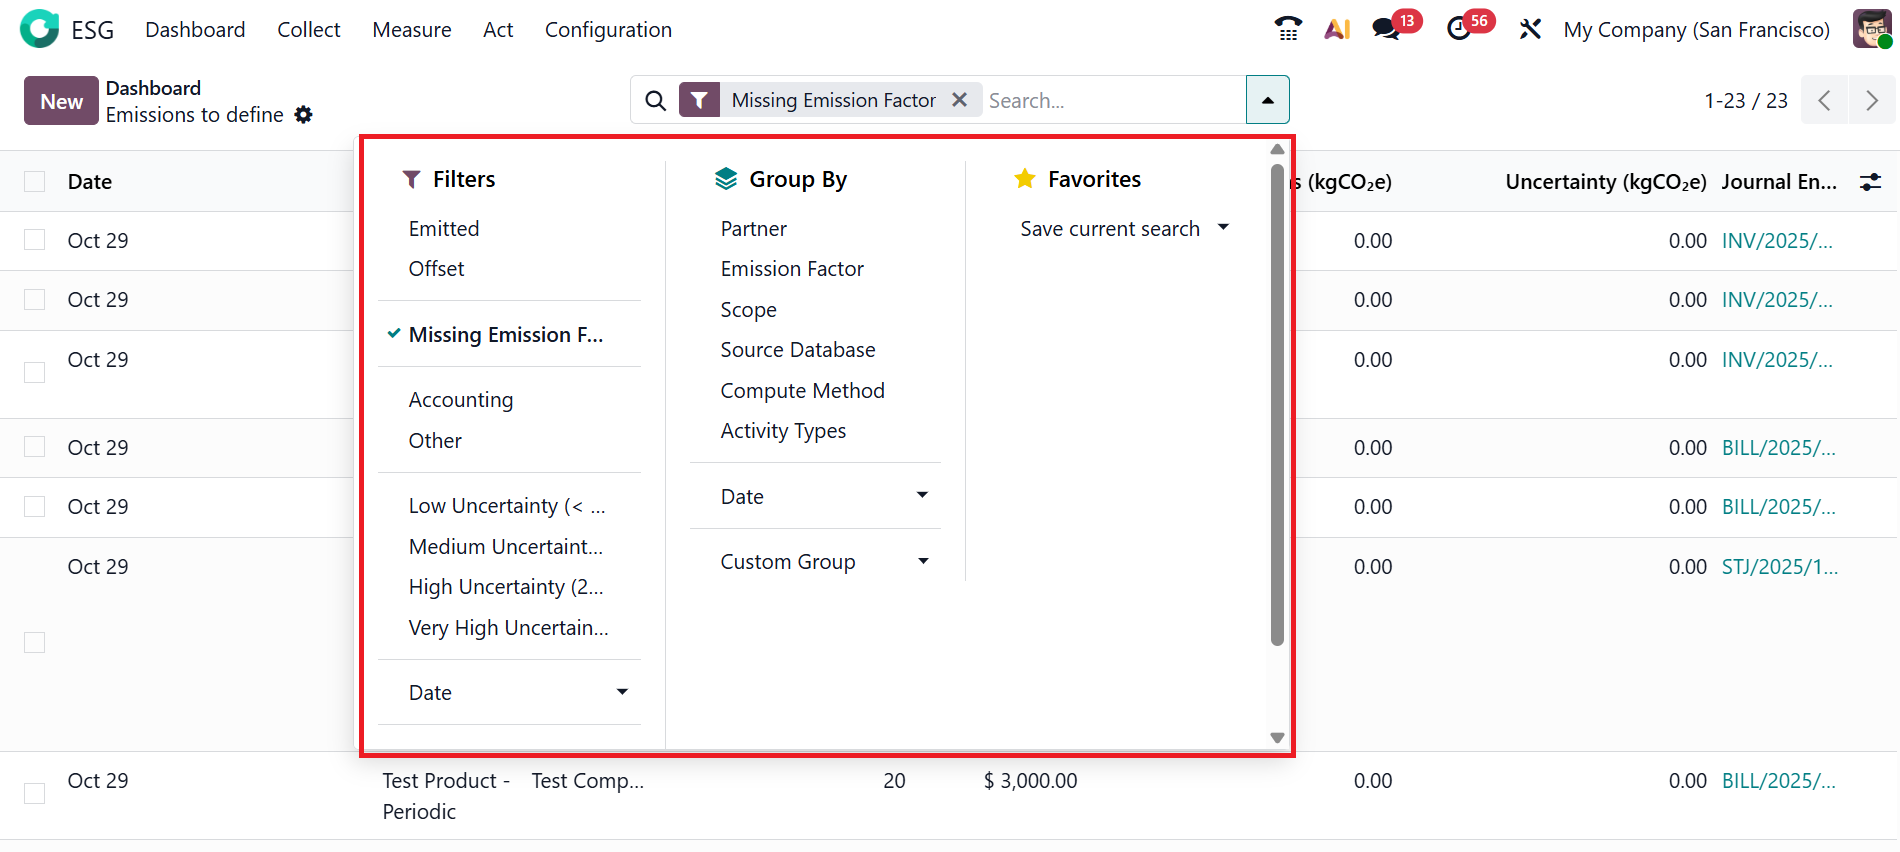
When you click on the drop-down menu in the search bar, you can view three options: Filters, Group By, and Favorites. These tools help to categorize the emission reports for quick access. Under the Filters menu, you can view the options such as Emitted, Offset, Missing Emission Factor, Accounting, Other, Low Uncertainty (<5%), Medium Uncertainty (5-20%), High Uncertainty (20-50%), Very High Uncertainty (>50%), and Date. Users can also create a Custom Filter or use the new Ask AI option for intelligent search assistance. Under the Group By option, you can group the emission reports based on Partner, Emission Factor, Scope, Source Database, Compute Method, Activity Types, Date, and also create a Custom Group. The Favorites menu helps save the current search for quick access.
Click the New button to create a new emission report.
1.2 Carbon Analytics:
Carbon Analytics provides trend and analytics on carbon footprints, helping organizations analyze and interpret their carbon emissions data. It compares the data from the last 6 months and last year to show progress or an increase. Clicking the Carbon Footprint button shows the organization’s combined direct and indirect greenhouse gas emissions.
Here, you can view the Carbon Footprint report, which provides a complete summary of an organization’s carbon emissions. It combines all emissions data collected from various sources and categorizes them into three scopes: Direct, Indirect, and Other Indirect. You can also view the total emissions across the three scopes. You can use the PDF / XLSX buttons to export the carbon footprint report for sharing or record-keeping.
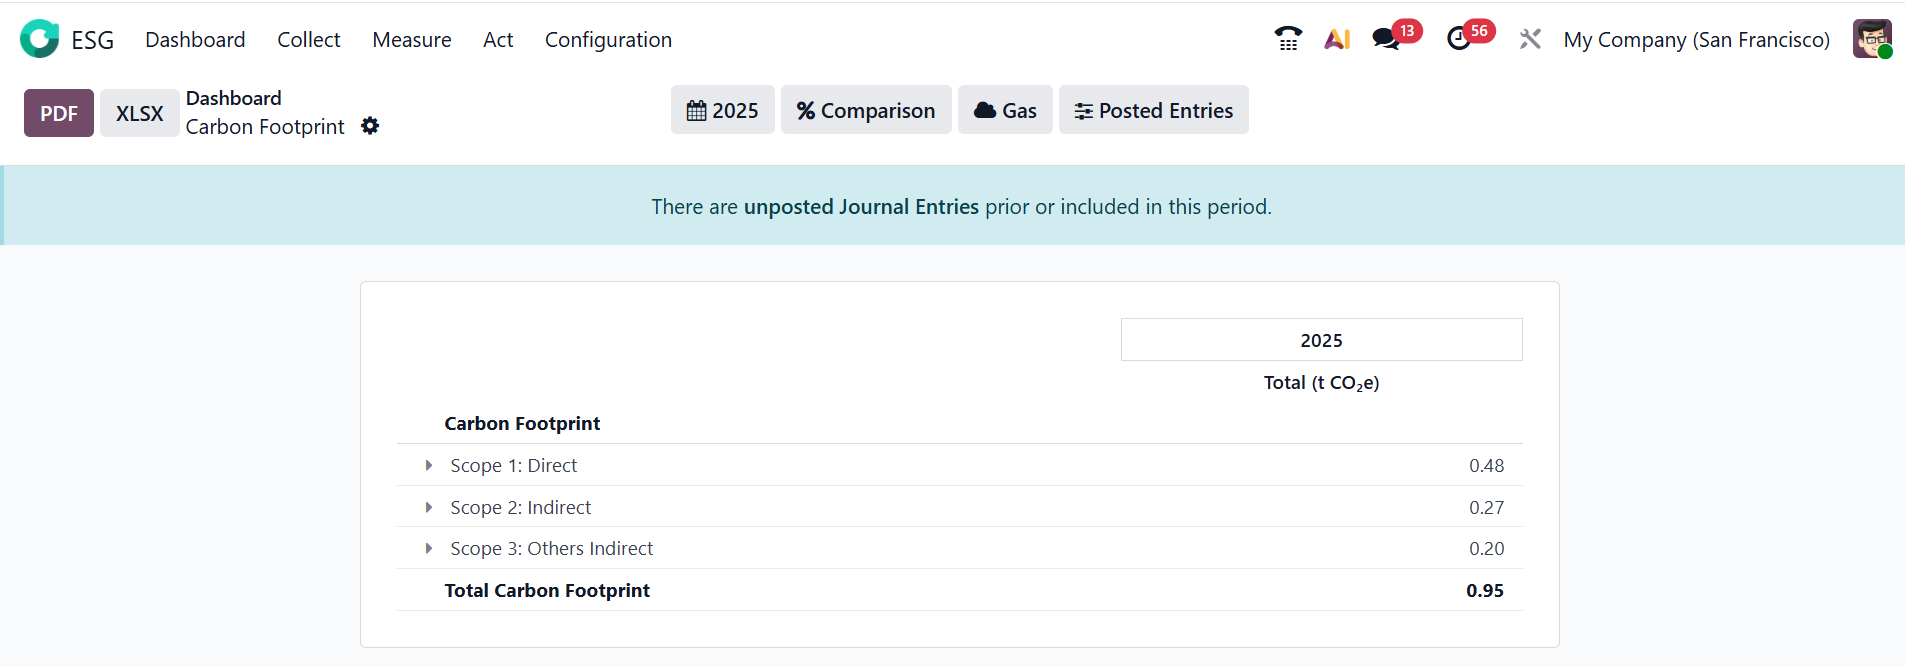
Click the Calendar button to review and analyze the report by Month, Quarter, Year, or a set of Custom Dates. Click on the %Comparison button to analyze the report based on No Comparison, Previous Period, Same Period Last Year, Custom Dates, or Period Order as Ascending or Descending. Click the Gas filter button to analyze and view emissions based on specific greenhouse gases. The Post Entries button displays the finalized and validated emission records. You can also Draft Entries and Unfold All the emission reports by clicking the Post Entries button.
1.3 Initiatives:
Initiatives in the ESG module are action plans or projects designed to reduce environmental impact, improve social responsibility, or strengthen governance practices. They help turn ESG insights into concrete, measurable actions. Here, you can view the four stages of initiatives: Ideas, In Progress, Done, and Total. The Ideas stage refers to newly proposed sustainability actions or projects. The In Progress stage signifies initiatives that have received approval and are currently being implemented. The Done stage represents initiatives that have been completed and achieved their ESG goals. The Total stage shows the overall number of initiatives across all stages. Click the Create Initiative button to start a new initiative.
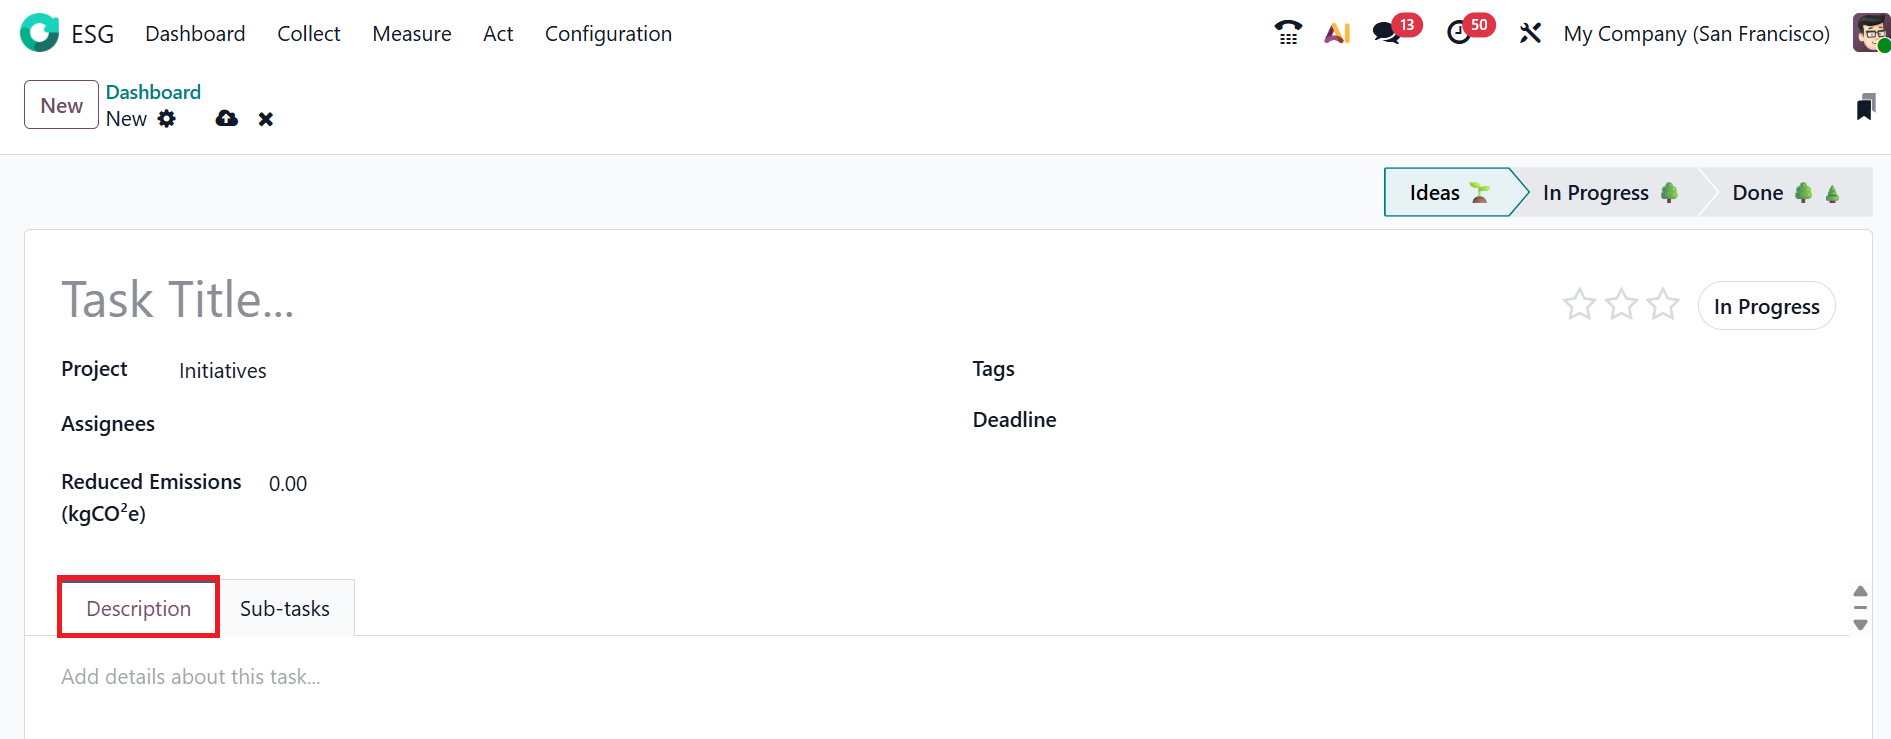
Enter a title for the task, select a Project under which the task falls (here, it is Initiatives), and add Assignees—employees or team members responsible for completing the task. You can view the estimated or actual reduction in carbon emissions achieved through this task in the Reduced Emissions (kgCO2e) field. Use appropriate Tags to categorize the tasks. In the Deadline field, enter a target date for completing the task. In the Description tab, you can provide detailed information about the task.
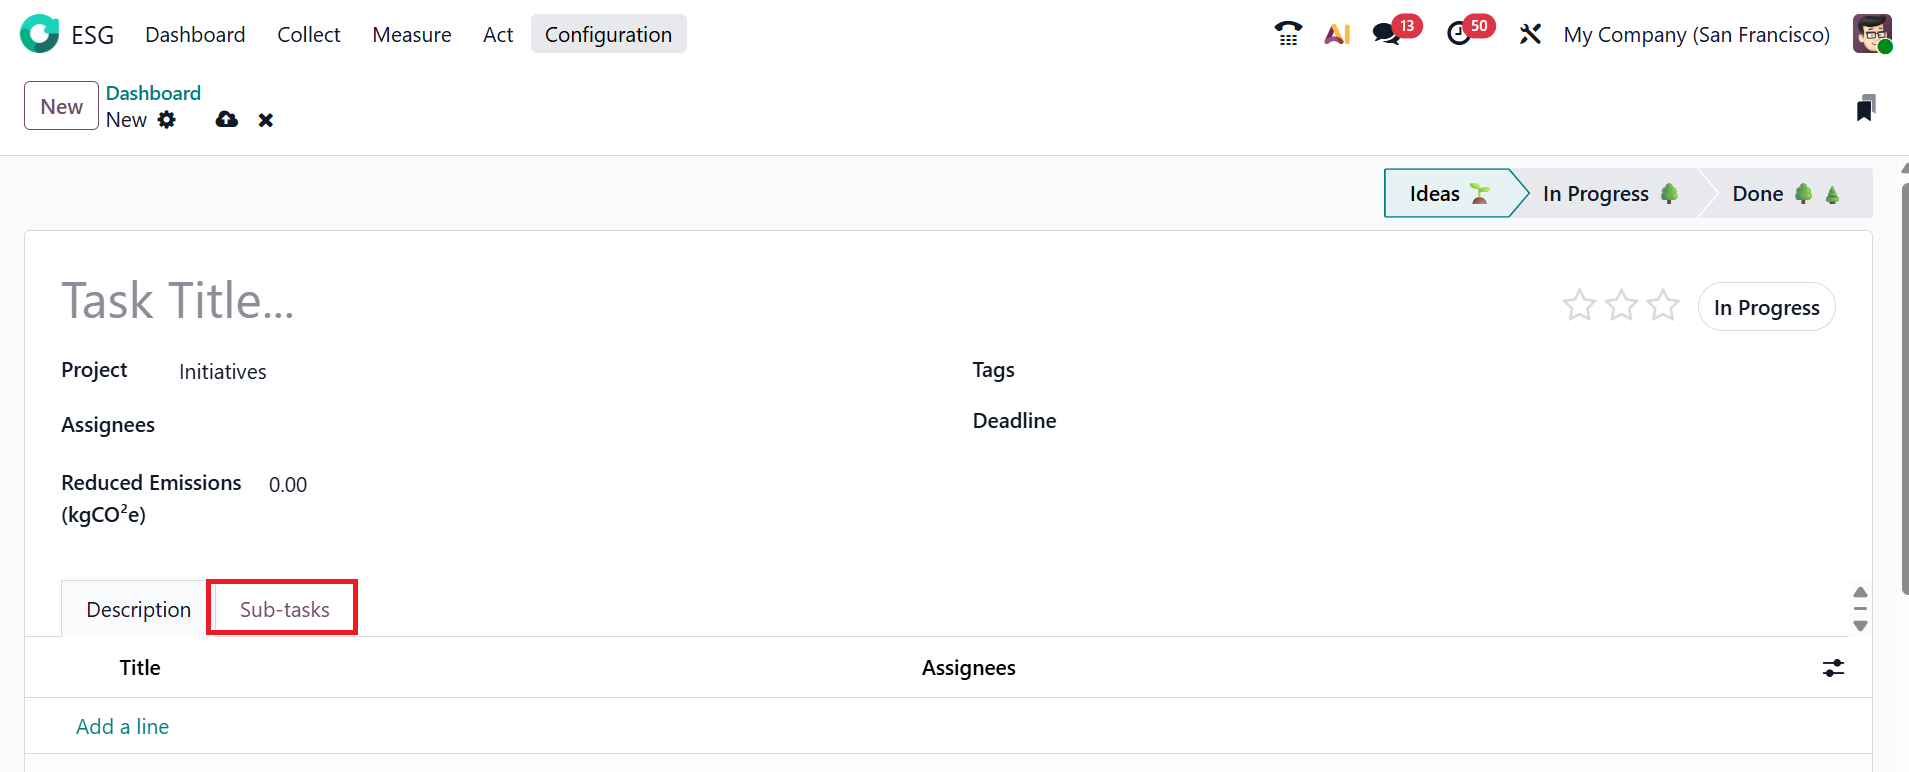
In the Sub-tasks tab, you can break the main task into smaller, manageable tasks. By clicking the Add a line button, you can add a sub-task title and assign an assignee. You can assign a star rating to indicate the priority level of the task.
1.4 Sex Parity:
In the Odoo 19 ESG module, sex parity refers to the equal representation of male and female employees in an organization. Here, you can see a pie chart illustrating the pay gap percentage, which shows the difference in average salaries between male and female employees within the company.