Reporting
To analyze the overall performance of your customer support operations, Odoo 18 provides a Reporting section within the Helpdesk module. This section includes detailed reports that allow you to review ticket activities, service quality, and compliance with SLA policies. With these analytical tools, managers can track productivity, identify areas for improvement, and make data-driven decisions to enhance customer service.
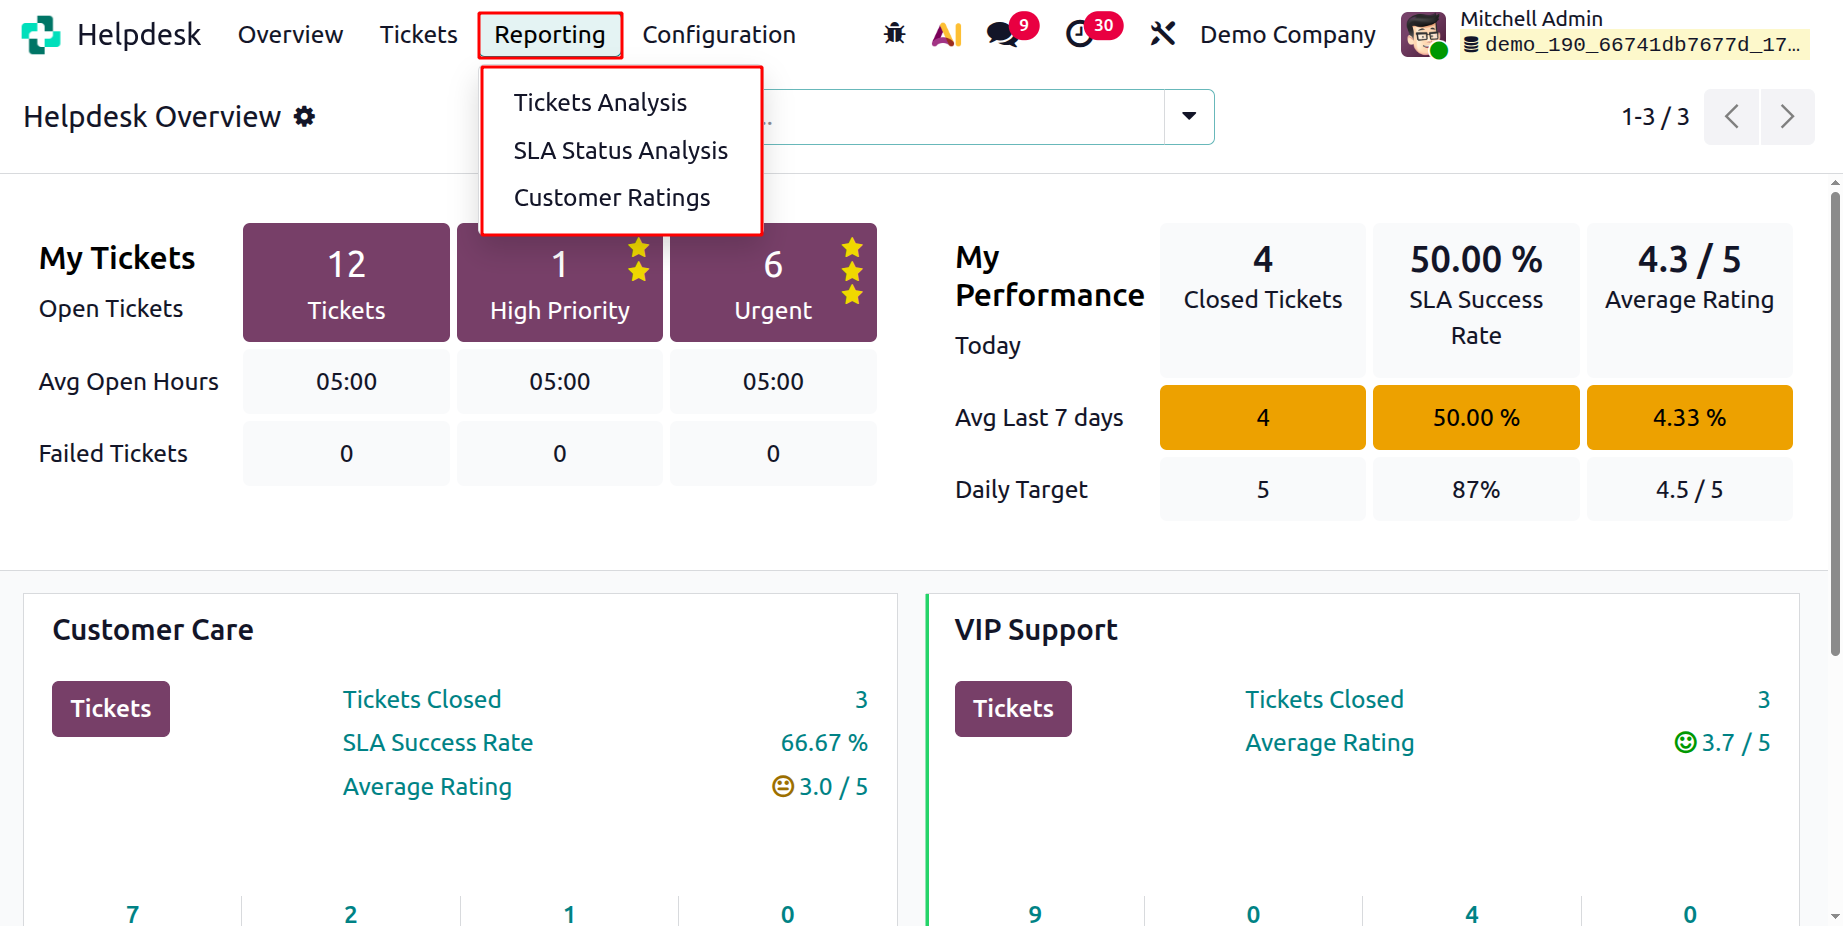
In the Helpdesk module, the Reporting menu offers two main options: Tickets, SLA Status Analysis and Customer Analysis.
1.1 Ticket Analysis
The Tickets report allows you to examine all the activities handled through the Helpdesk system. This report provides a clear view of how many tickets were opened, handled, and closed over a certain period, helping you measure your team’s performance.
The report can be viewed in several formats: Pivot View, Graphical View, and List View allowing you to analyze data in different ways based on your preferences.
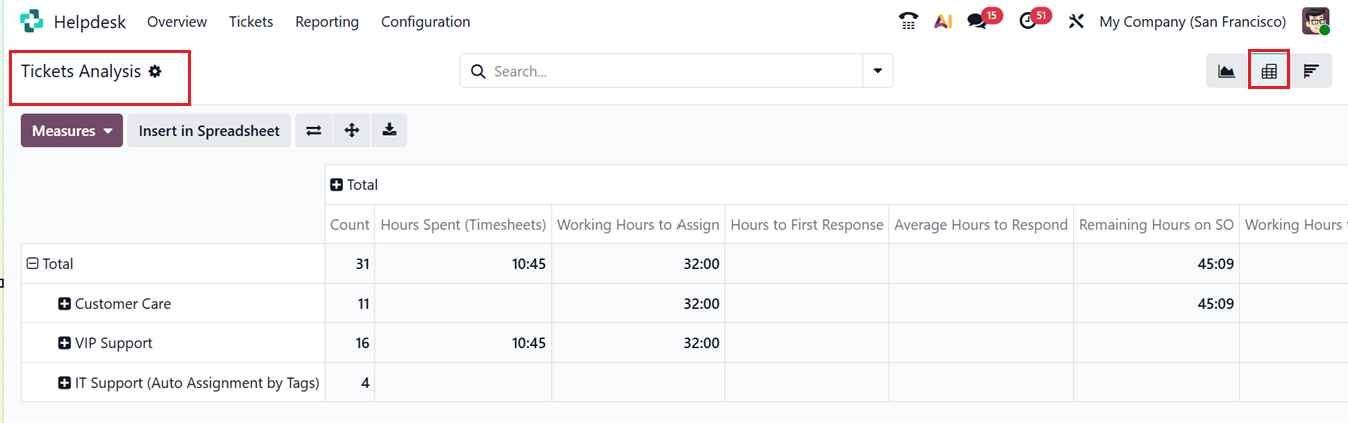
In the Pivot View, ticket data is presented in a spreadsheet-like layout where you can measure and compare different performance indicators. For example, you can analyze metrics such as the number of tickets per team, average resolution time, or customer ratings.
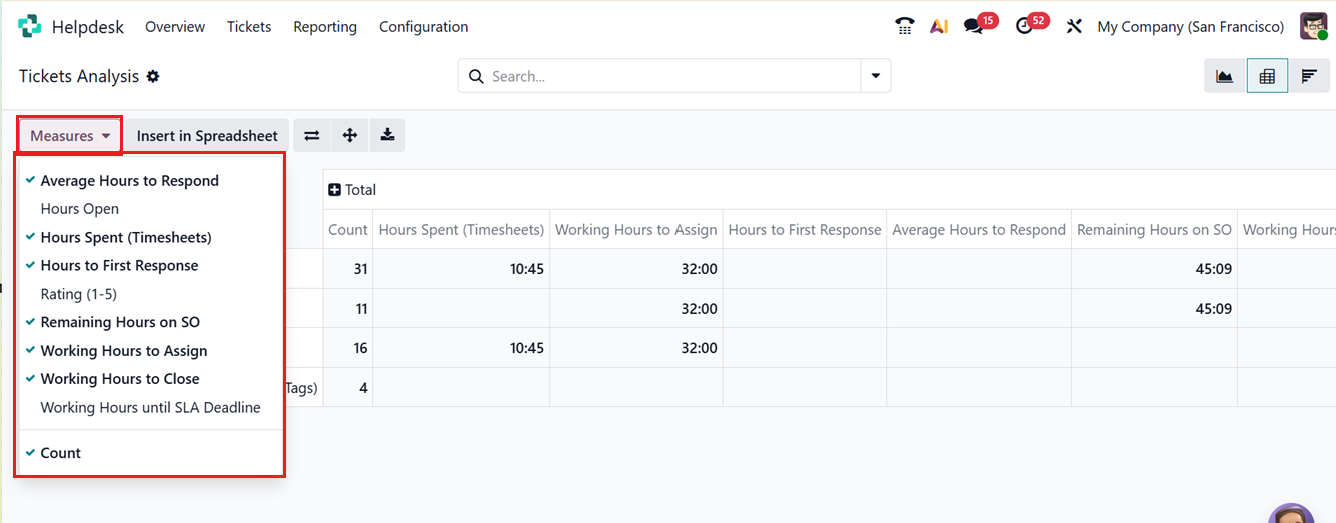
By using the Measures option, you can choose from various metrics like Average Hours to Respond, Hours Open, Hours Spent(Timesheets), Hours to First Response, Rating, Remaining Hours on SO, Working Hours to Assign, Working Hours to Close, Working Hours to Respond, Average Open Hours, Count and more. You can also add custom filters and groupings to narrow down your analysis to specific conditions, such as team, stage, or ticket priority.
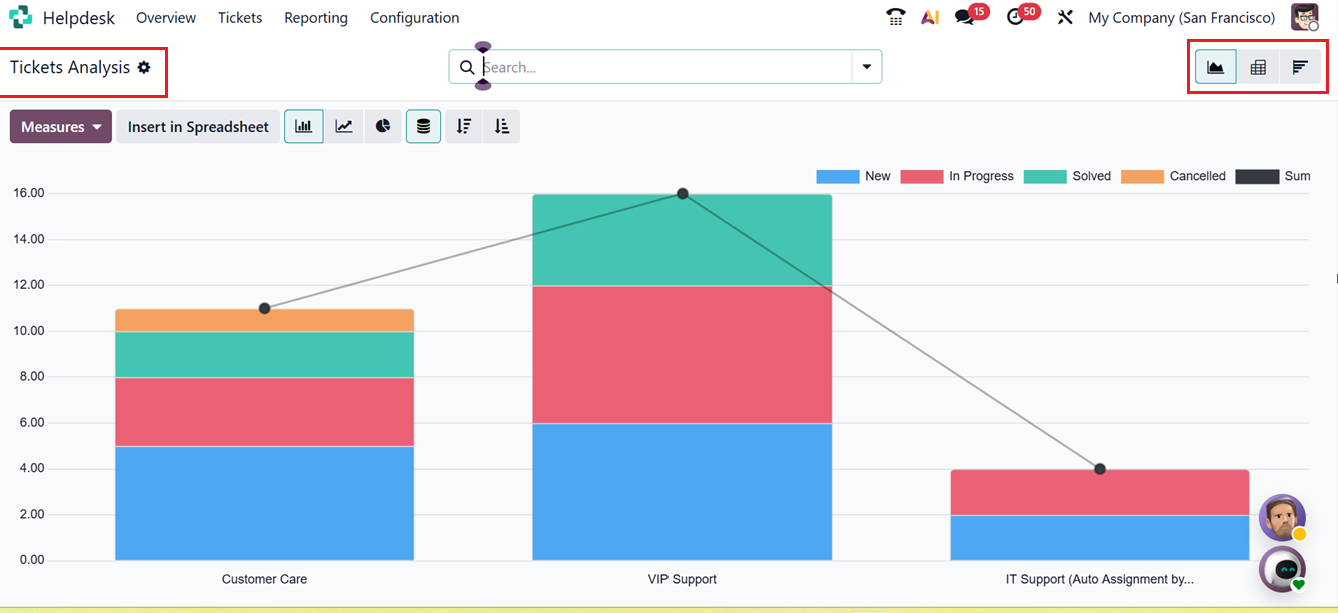
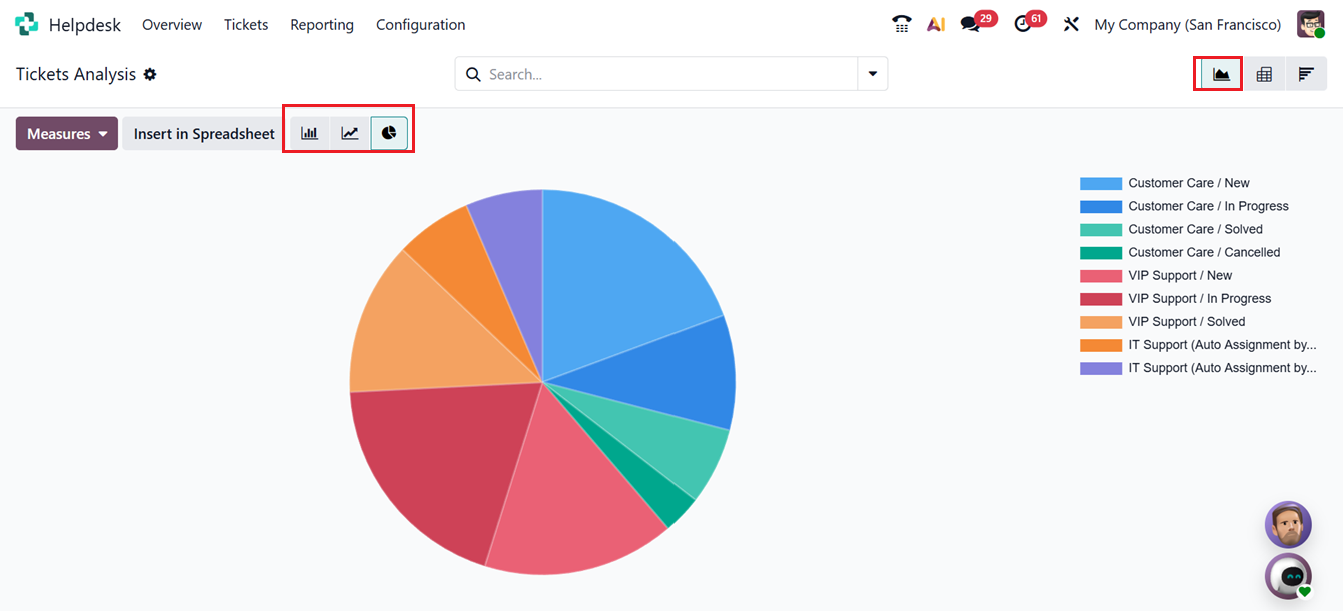
The Graphical View gives you a visual summary of your ticket data. You can choose between Bar Chart, Line Chart, and Pie Chart formats. These visuals make it easier to understand overall trends for example, identifying which team handles the most tickets, how many tickets are open or closed, and how customer satisfaction levels change over time.
By switching to the Cohort View, you can see a detailed table of ticket information. Each row in this view represents a single ticket, along with fields such as ID, Priority, Name, Team, Assigned To, Customer, Company, Activities, SLA Deadline, Stage, and Status.
These reporting tools help you gain insights into helpdesk activities and measure performance against company standards. For instance, you can compare team productivity, track SLA compliance, or review which types of issues occur most frequently.
1.2 SLA Status Analysis
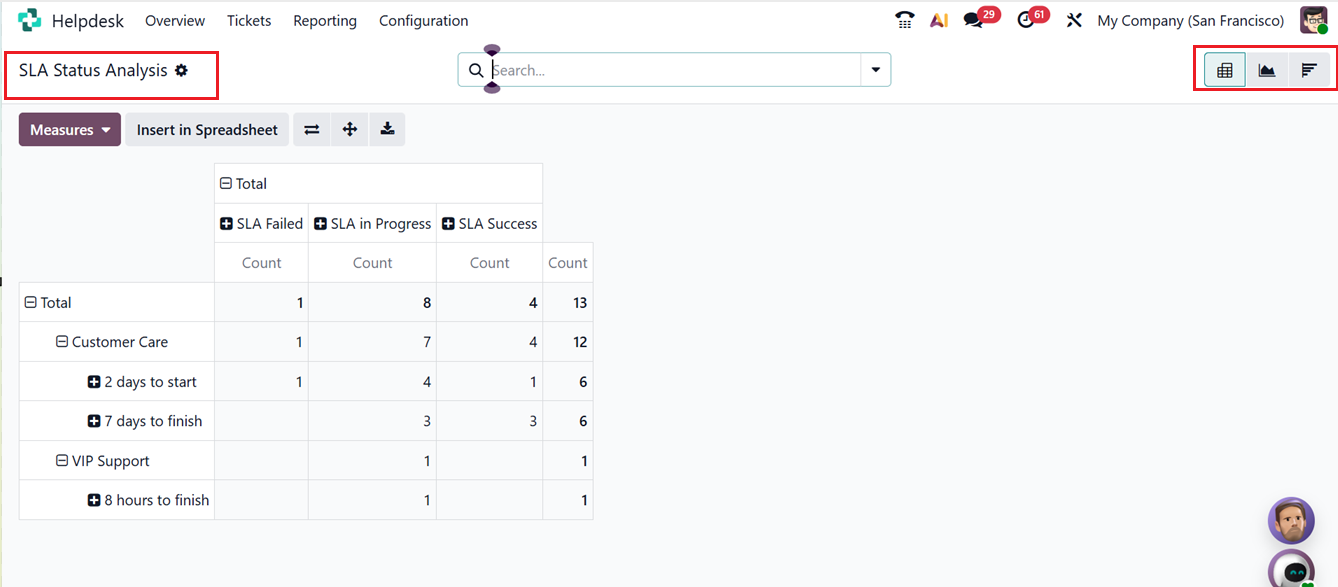
The SLA Status Analysis report gives you a deeper look into how well your company is meeting the service level agreements defined for customer support. It helps track whether tickets are being resolved within the promised time frame and identifies areas where delays occur. This analysis can also be viewed in Pivot, Graphical, or List View, just like the Ticket Analysis section.
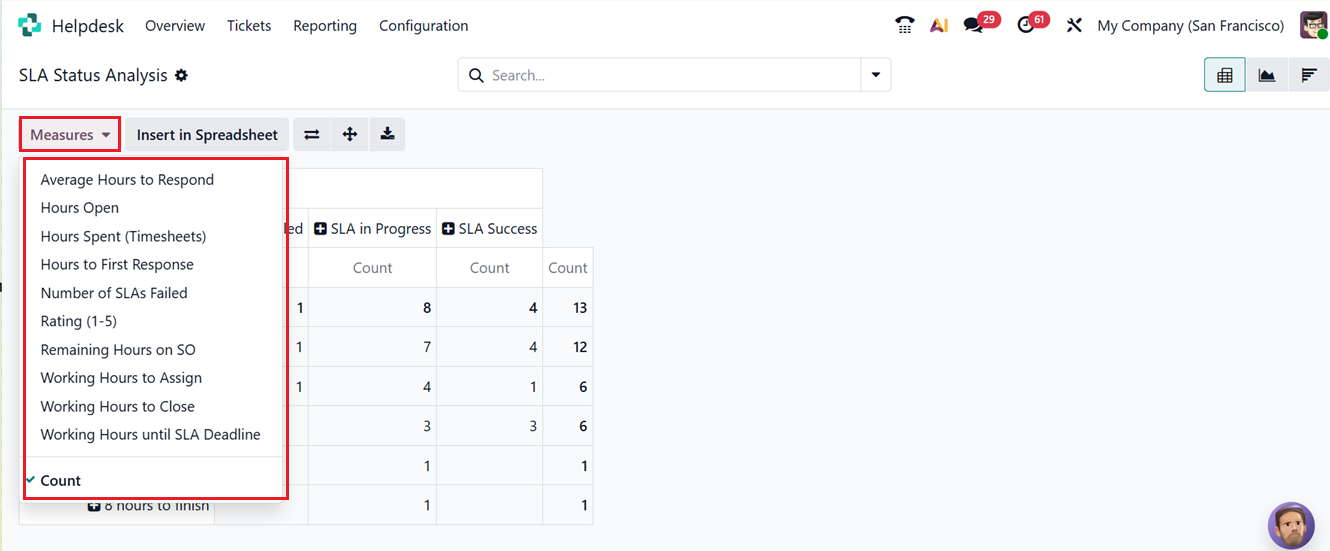
In the Pivot View, you can analyze measures such as Average Hours to Respond, Hours Open, Hours Spent(Timesheet), Hours to First Response, Number of SLAs Failed, Rating, Remaining Hours on SO, Working Hours to Assign, Working Hours to Close, Working Hours until SLA Deadline and Count, as shown in the screenshot below.
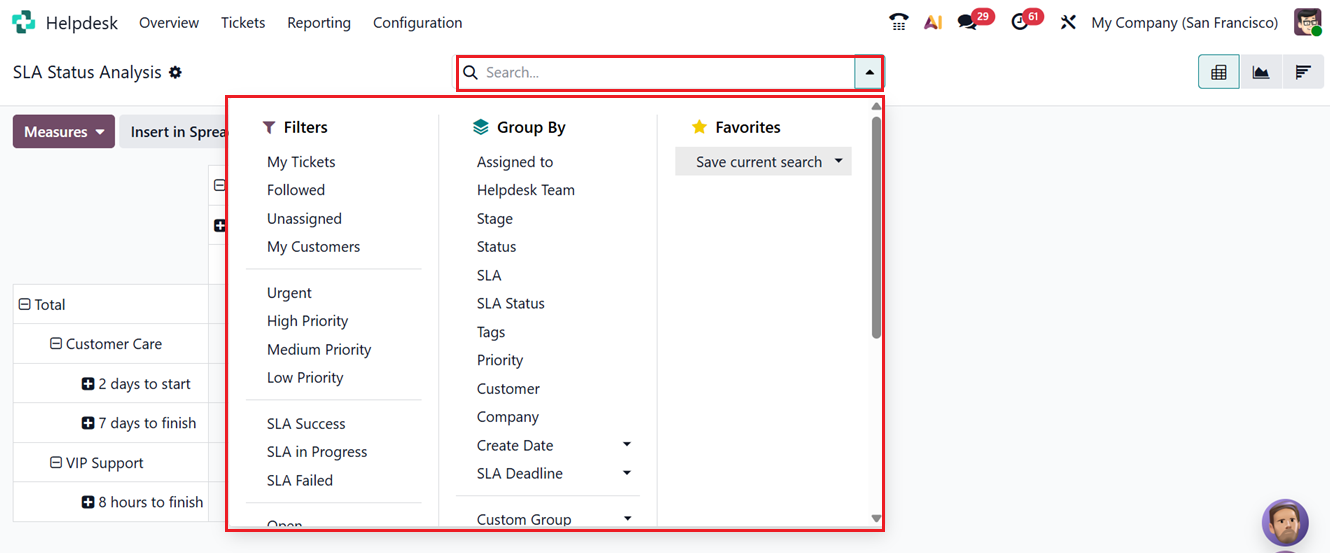
You can also use Filters and Group By tools to organize the data by various specifics including, My Tickets, Followed, Unassigned, SLA Success, SLA Status, Customer, Priority, Tags, Stage, Status etc. You can also create customized filters and groups using the ‘Custom Filter’ and ‘Custom Group’ options inside the search bar. To save recent or important searches, you can utilize the ‘Favorites’ option, as shown in the screenshot below.
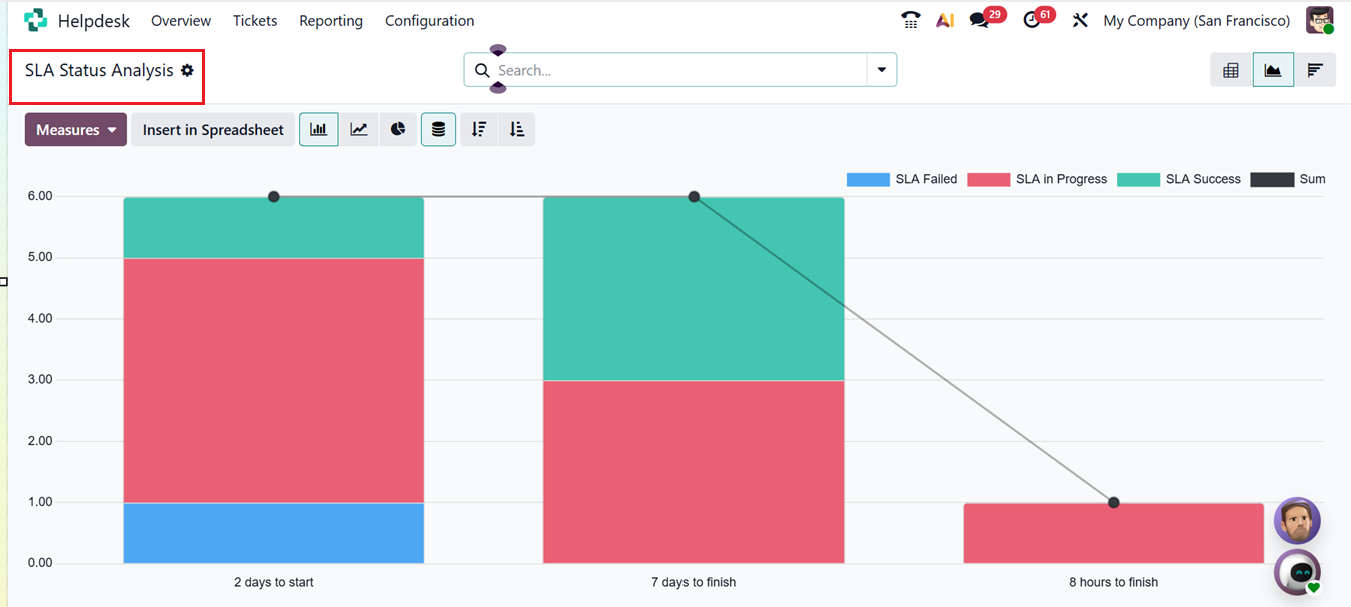
The Graphical View displays the SLA data visually, using bar, pie, or line charts to represent your team’s performance. For instance, a stacked graphical chart can show the percentage of tickets completed on time versus those that failed to meet their deadlines.
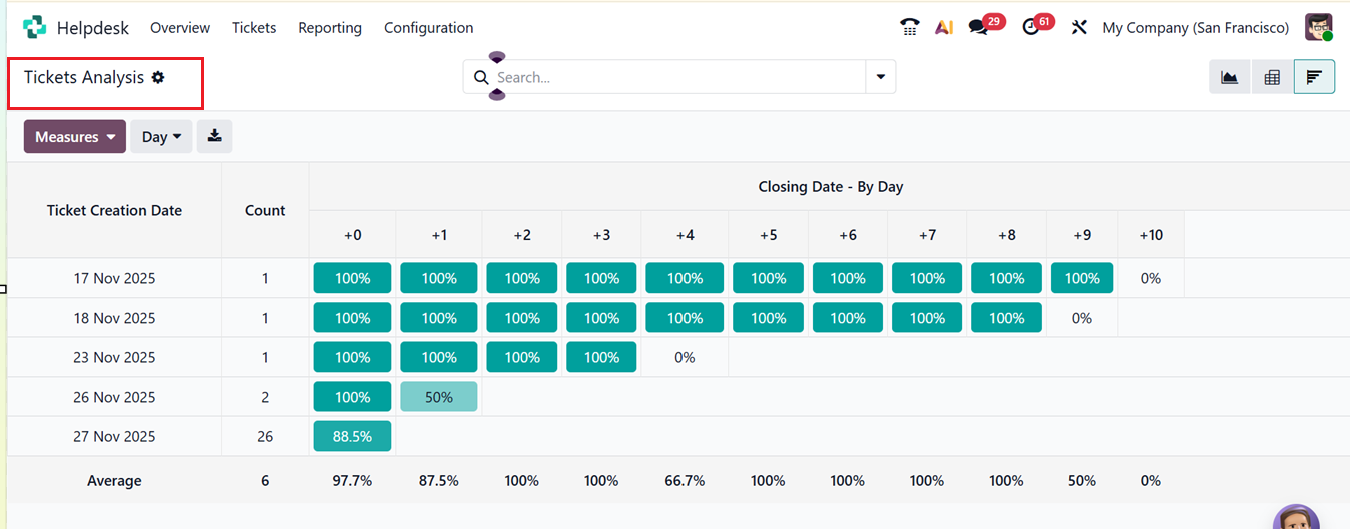
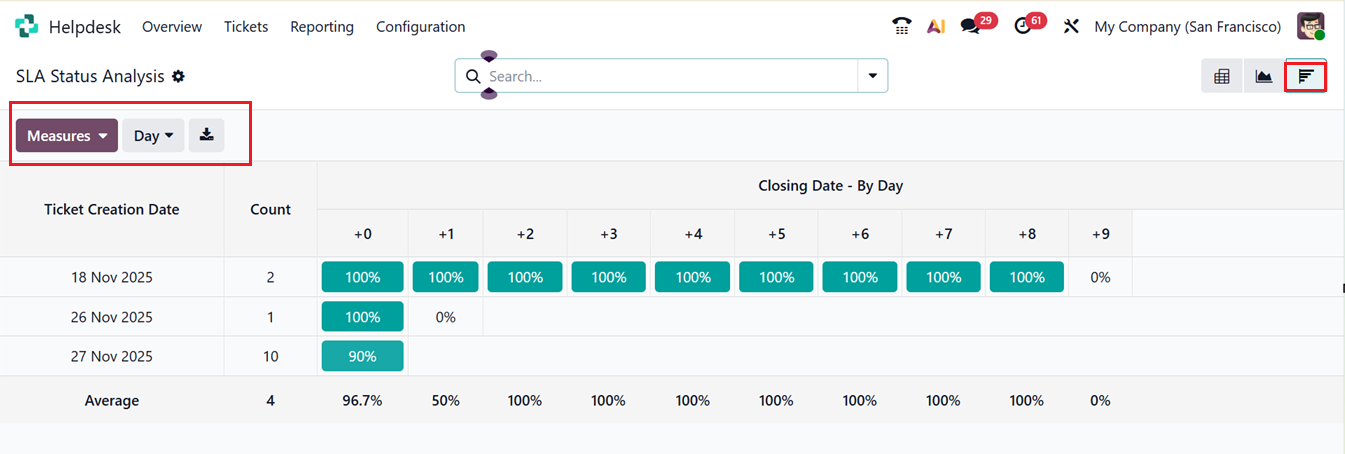
In the Cohort View, each record shows details such as Ticket Creation Date, Count, Closing Date-By Day and Average Ticket Count, as shown in the screenshot below.
These analytical tools are valuable for monitoring compliance and ensuring your company maintains consistent service quality. By regularly reviewing SLA performance, managers can detect recurring issues, identify bottlenecks, and take steps to improve response and resolution times.
1.3 Customer Rating
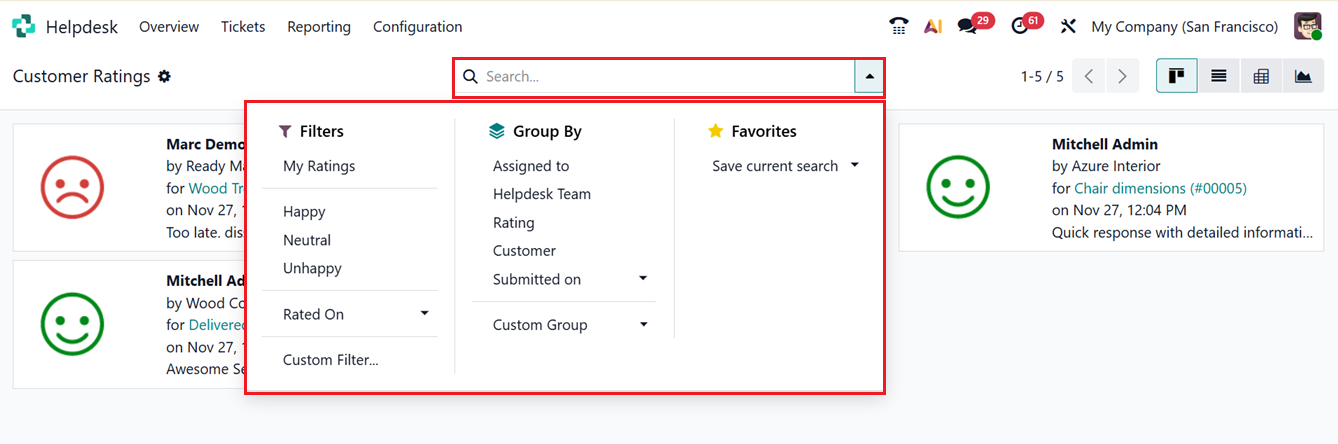
In the Odoo 19 Helpdesk module, the Customer Rating reporting summarizes the feedback customers provide after their tickets are resolved, helping teams assess overall service quality. It displays satisfaction scores and comments, allows analysis by team, agent, date, or ticket type, and highlights trends that may indicate areas for improvement, as shown in the screenshot below.
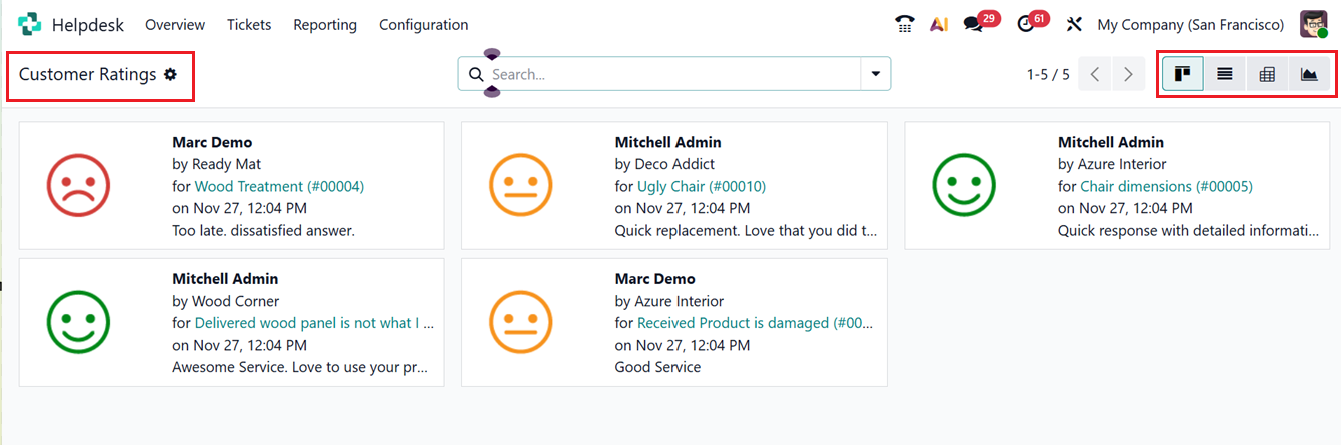
As like all the previous reporting windows, this reporting section can be viewed in Kanban, List, Pivot and Cohort Views.
Using the advanced search bar area, you can use the Filters and Group By tools to organize the data by various specifics including, My Ratings, Happy, Neutral, Unhappy, Rated On, Assigned To, Helpdesk Team, Customer and Submitted On dates. You can also create customized filters and groups using the ‘Custom Filter’ and ‘Custom Group’ options inside the search bar. To save recent or important searches, you can utilize the ‘Favorites’ option, as shown in the screenshot below.
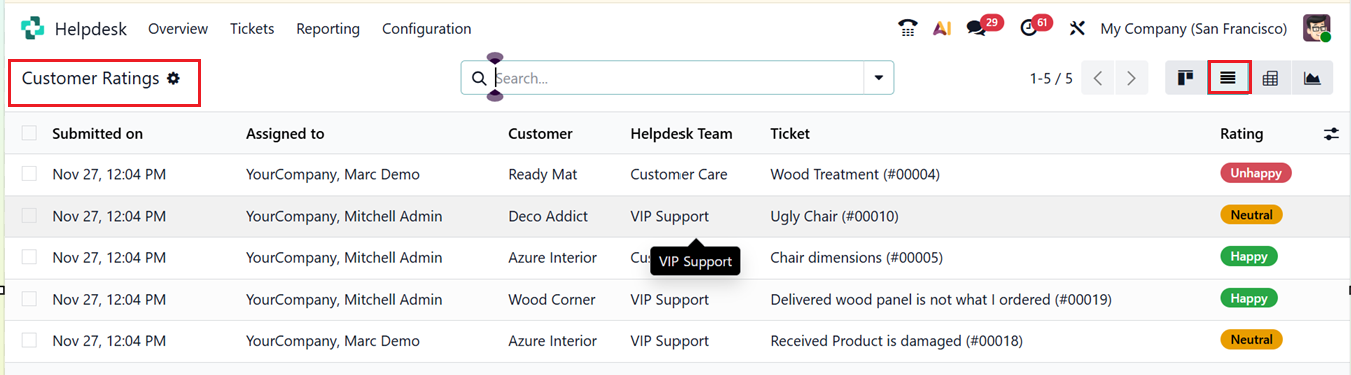
The List view provides the dashboard list of all the ratings based on their Submitted On date, Assigned to person name, Customer, Helpdesk Team, Ticket and Rating, as shown in the screenshot below.
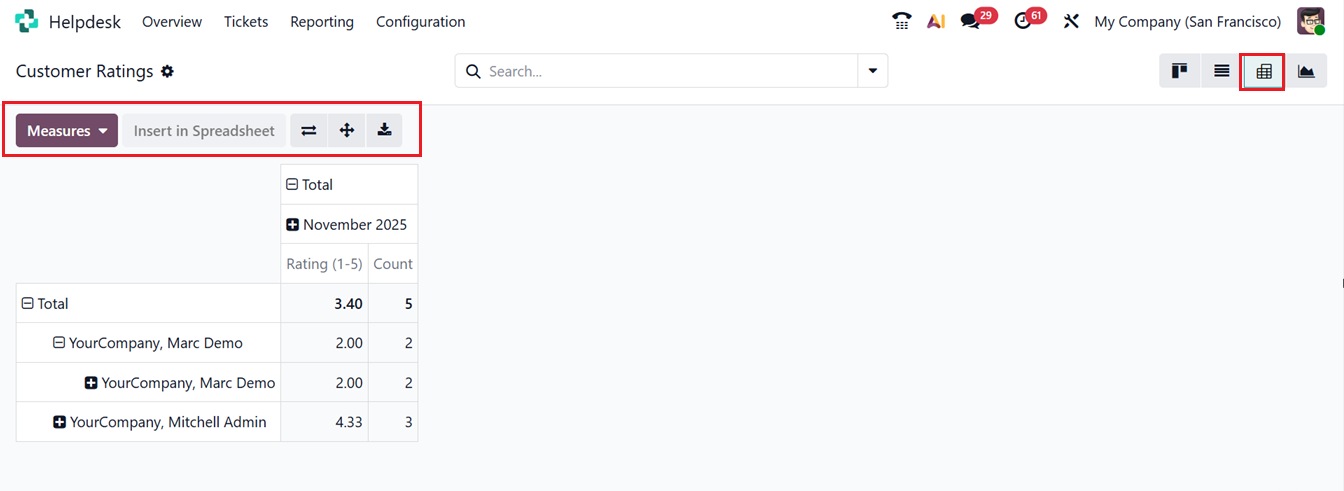
Inside the Pivot View, you can see the customer ratings based on the Rating count of a helpdesk team. Inside the ‘Measures’ section, you can change the pivot graph metrics based on Rating(1 to 5) or Count.
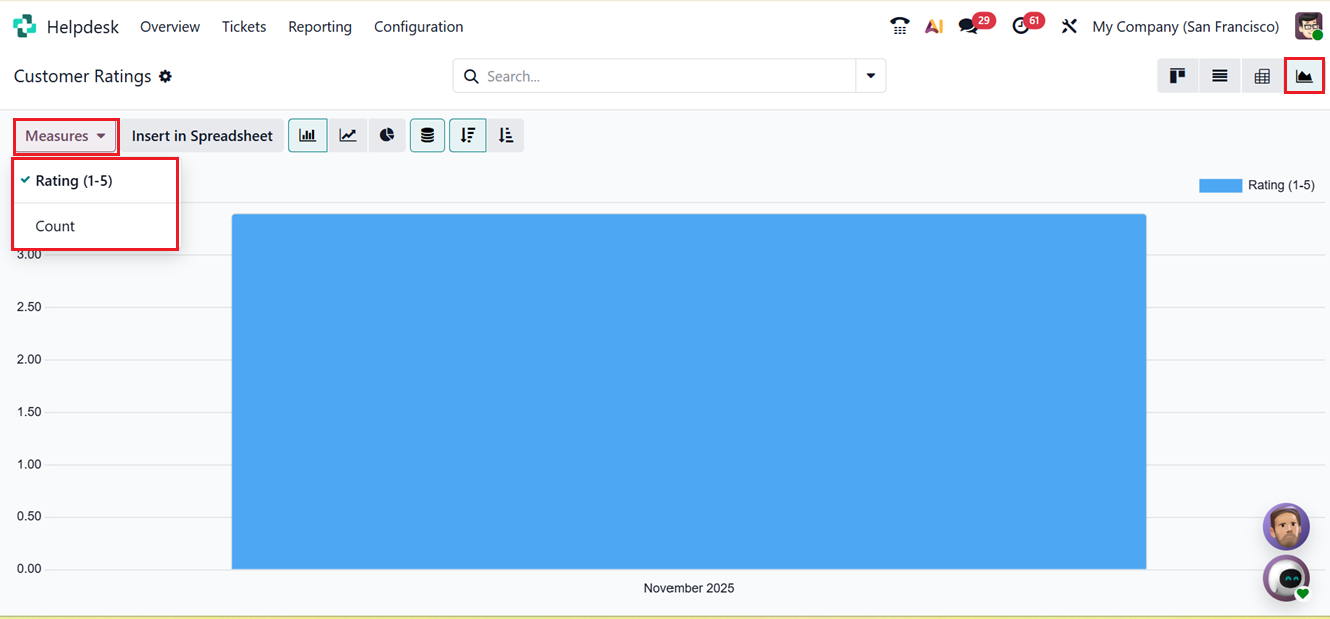
The Graphical view provides different graphical perspectives such as Bar Chart, Line Chart, Pie Chart, Stacked, Descending and Ascending chart views. Using the ‘Measures’ button, it is possible to change the graphical measures based on Rating(1 to 5) and Count, as shown in the screenshot below.
By reviewing this historical feedback, businesses can monitor performance, address issues proactively, and enhance the customer support experience.
In conclusion, the Helpdesk module in Odoo 19 is an essential tool for managing customer support operations efficiently. With its advanced features such as ticket tracking, SLA management, automated responses, live chat integration, time tracking, and reporting it ensures a smooth, well-organized service experience for both customers and employees.