Reporting
Through consistent tracking and supervision of inventory-related actions, you can effortlessly evaluate and comprehend the workflow involved in handling stock. Odoo provides a dedicated platform designed to generate detailed reports of all inventory processes carried out in your organization, presenting information accurately through both graphical and tabular views.
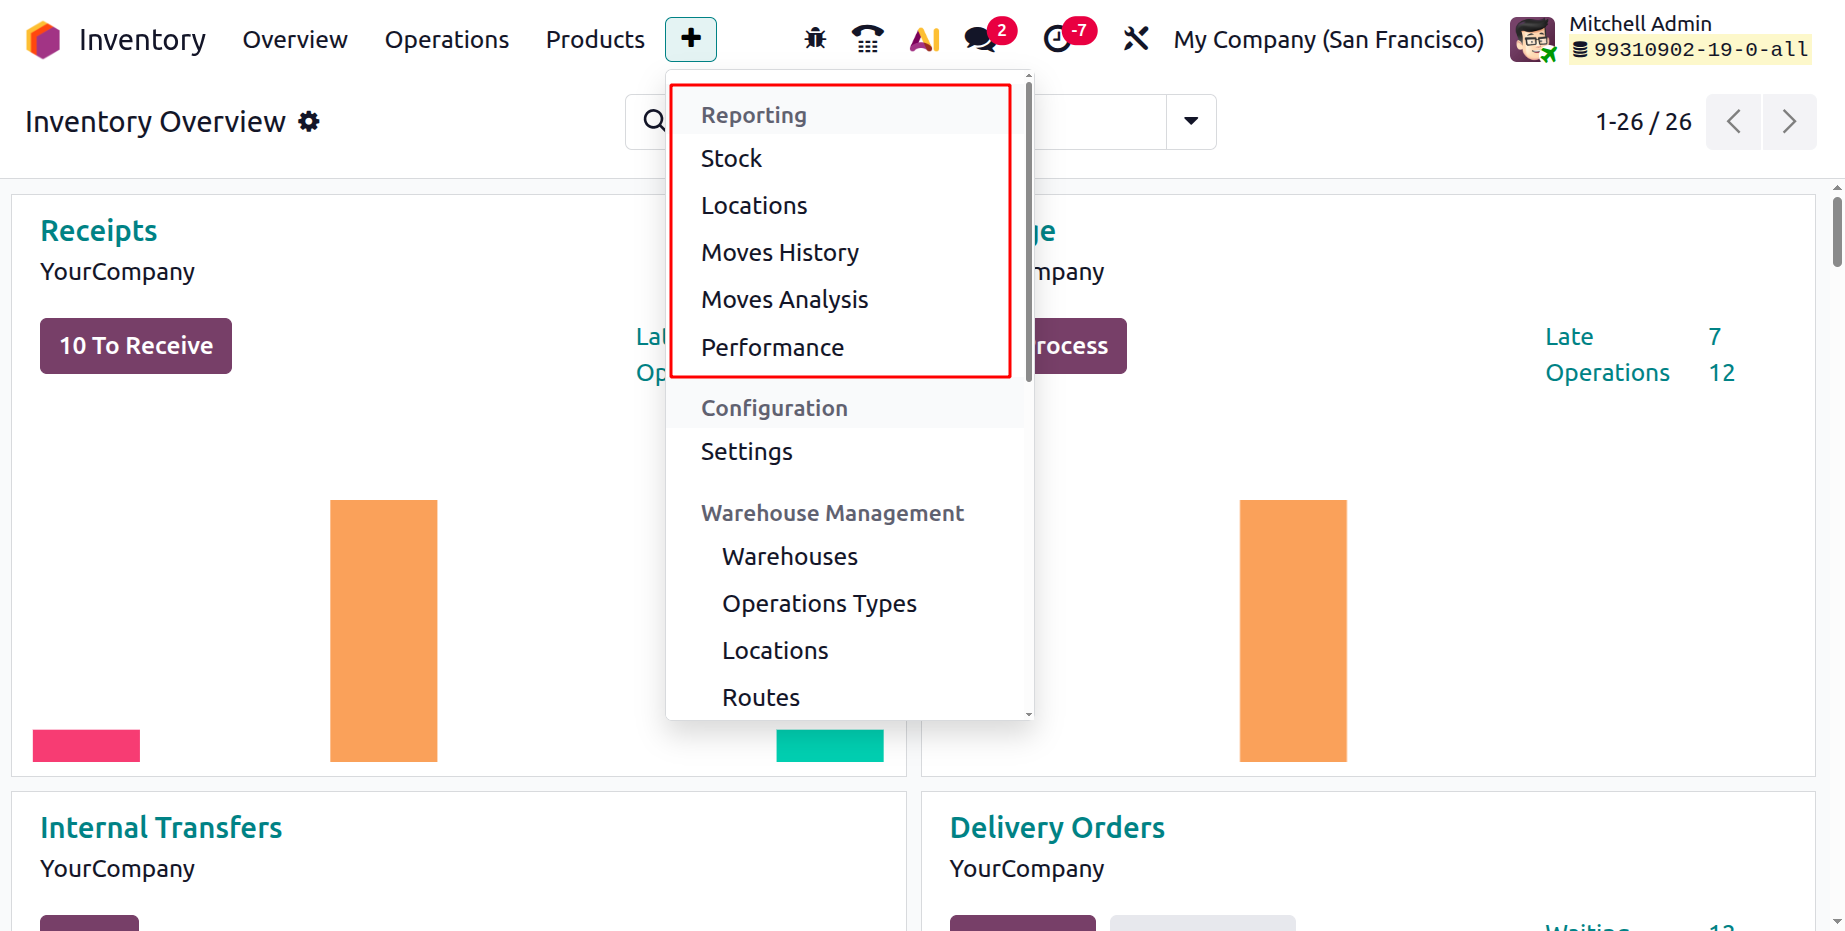
To access extensive reports tailored to your needs, the system allows you to modify and personalize reporting options instantaneously. Within the Reporting section of the Odoo Inventory module, you can generate reports for Stocks, Locations, Moves History, Moves Analysis and Performance. The following sections explore each reporting interface in depth.
1.1 Stock
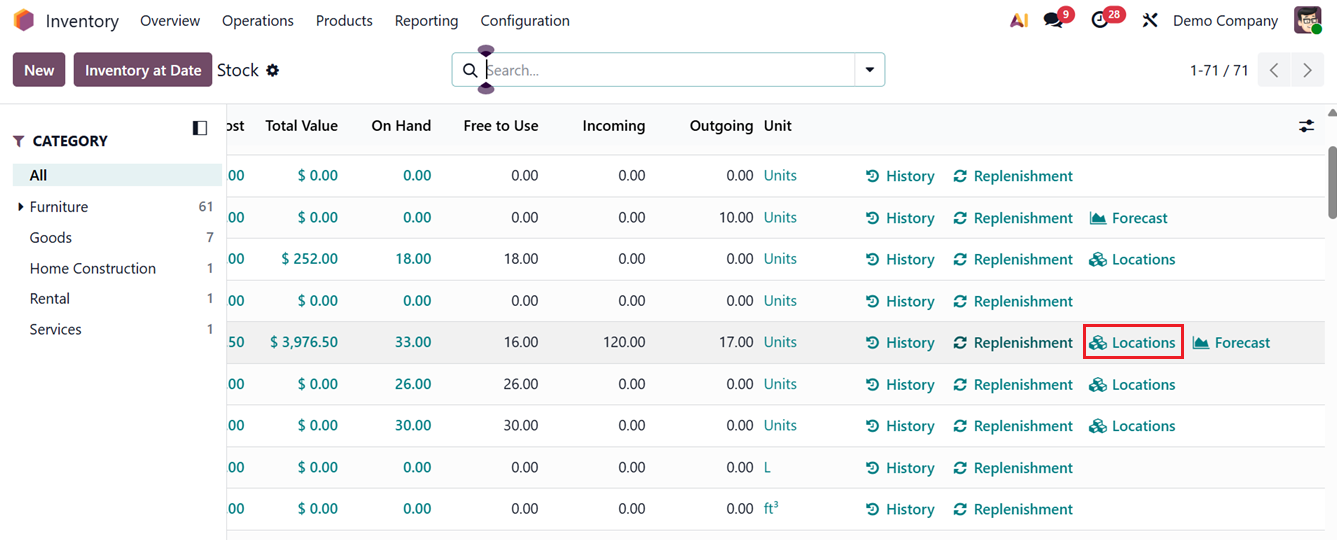
Within the Reporting menu, the ‘Stocks’ interface displays a complete list of all stock items presently available in your warehouse. The system provides details such as the product name, unit price, total stock value, availability, free quantity, quantities to be received, and quantities to be delivered.
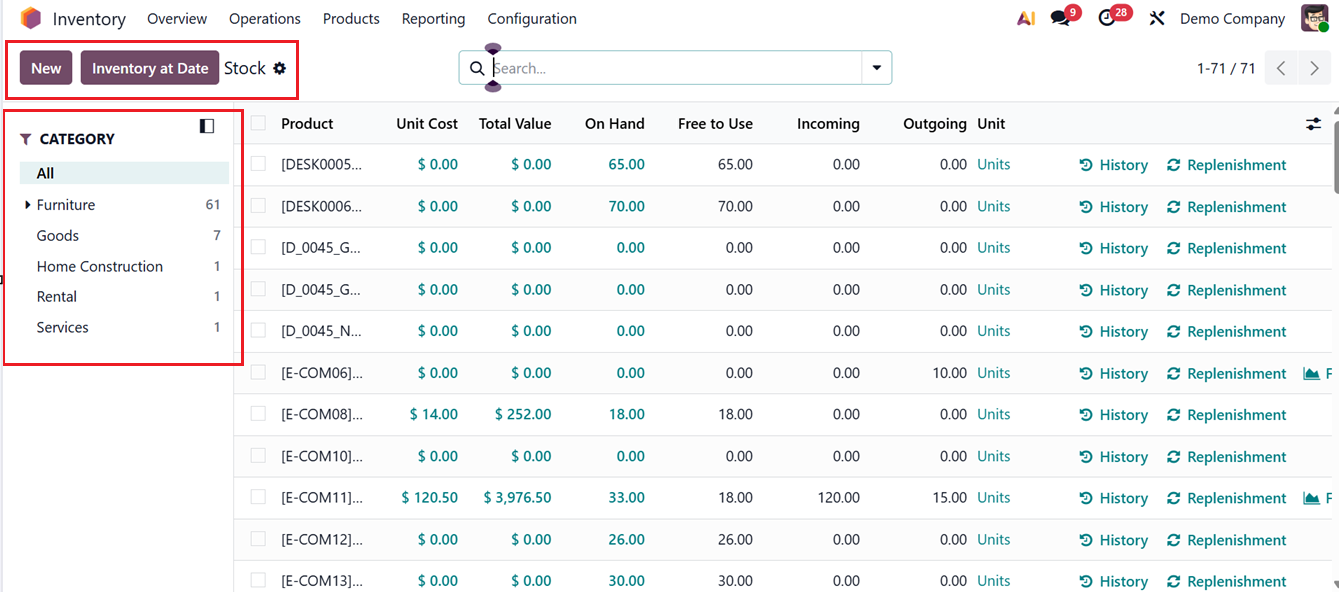
You can arrange the stock overview according to product categories by selecting the categories listed on the left panel shown in the illustration. At any point, the search bar can be used to streamline the process of locating a particular item.
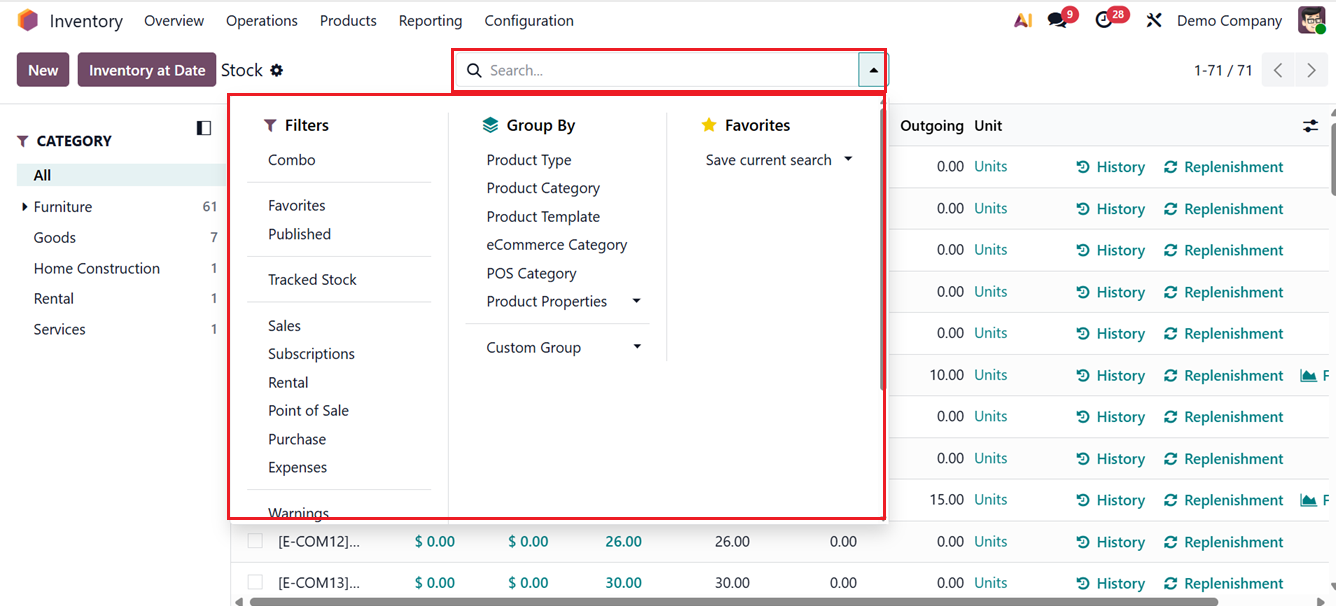
Here, you can utilize the default filters such as Combo, Published, Inventory Management, Point of Sale, Sales, Purchase, Subscriptions, Rental, Expenses, and Favorites can be applied to refine the data shown. In addition, standard Group By options include Product Type, Product Category, and PoS Product Category. To include another grouping method, select the Add Custom Group button. A Favourites option is also available, as indicated in the screenshot below.
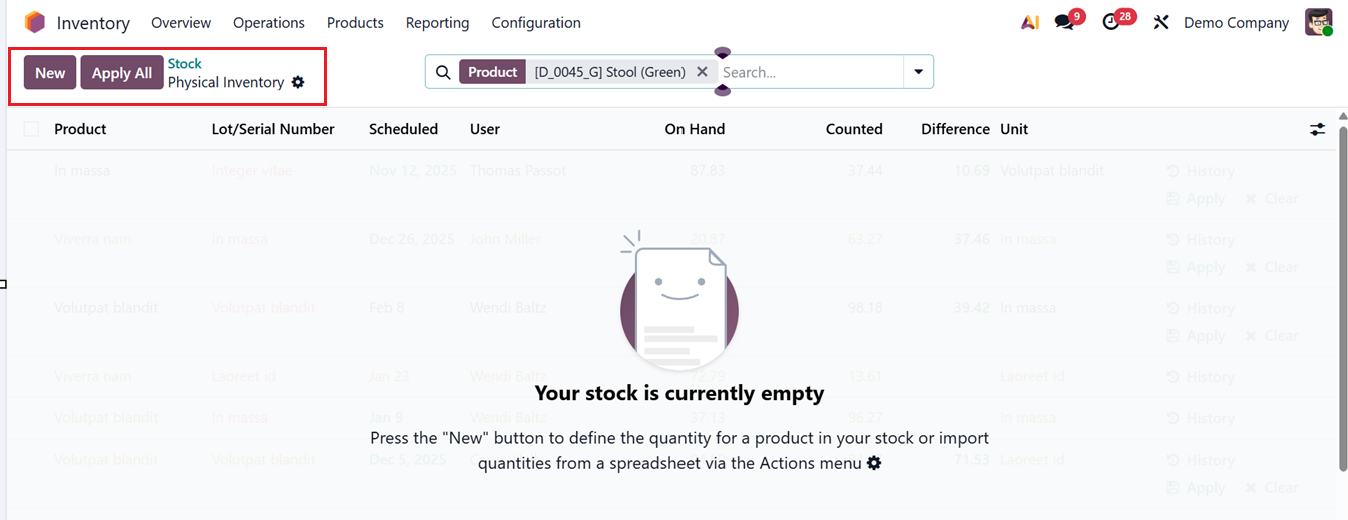
By clicking on the ‘On Hand’ field, you can access the product’s Physical Inventory Adjustment information in a dashboard as shown below.
To review a product’s movement details, use the ‘History’ button within the stock interface, as demonstrated in the example. To register a new stock entry, select the New button.
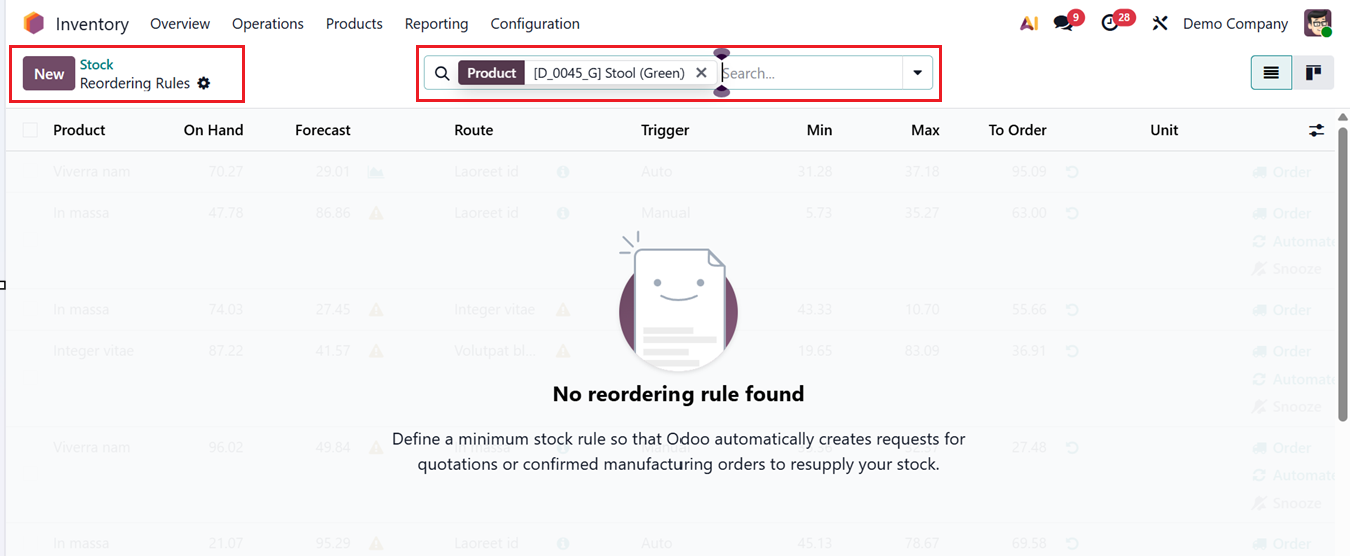
Then you can replenish any required items by selecting the ‘Replenishment’ button. This will lead you to an Reordering Rules window where you can see the list of every Product, On Hand quantity, Forecast quantity, Route, Trigger, Min and Max quantity, To Order, and Unit, as shown in the screenshot below.
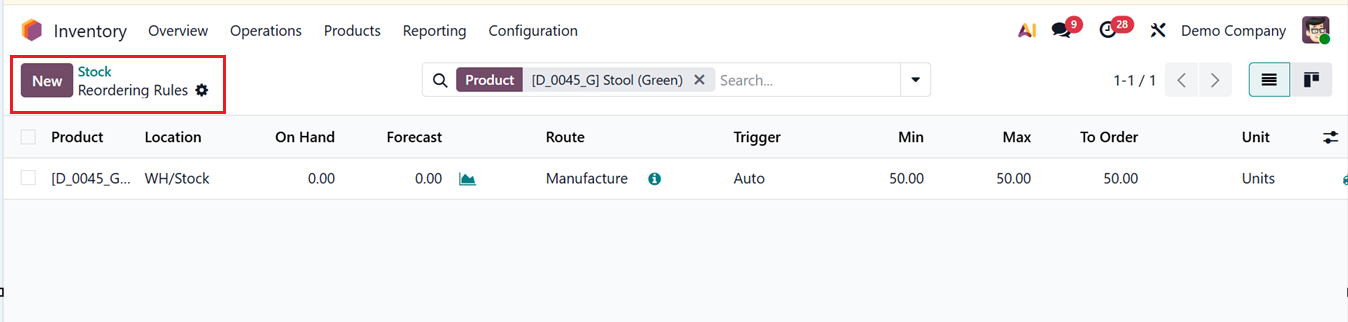
You can click on the ‘New’ button to update the replenishment by mentioning the Product, Location, On Hand quantity, Route, Trigger and other details, as shown in the screenshot below.
By scrolling on to the right side of the window, you can see an ‘Locations’ button, as shown in the screenshot below.
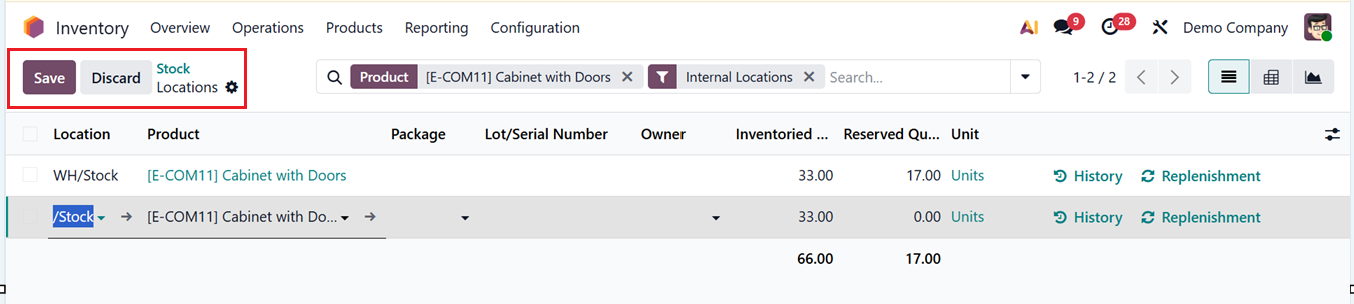
You can click on the Locations button to update the location of a product. This will show the dashboard of all the saved locations of the selected product. Then, you can also update a new location using the ‘New’ button and update the Location, Package, Owner, Inventoried Quantity, Reserved Quantity and Unit, as shown in the screenshot below.
The ‘Forecast’ button will show the analysis of the Forecasted units of the selected product in a graphical view. Here, you can see the Value On Hand, On Hand quantity, Incoming, Outgoing, Forecasted quantities and Time to replenish, as shown in the screenshot below.
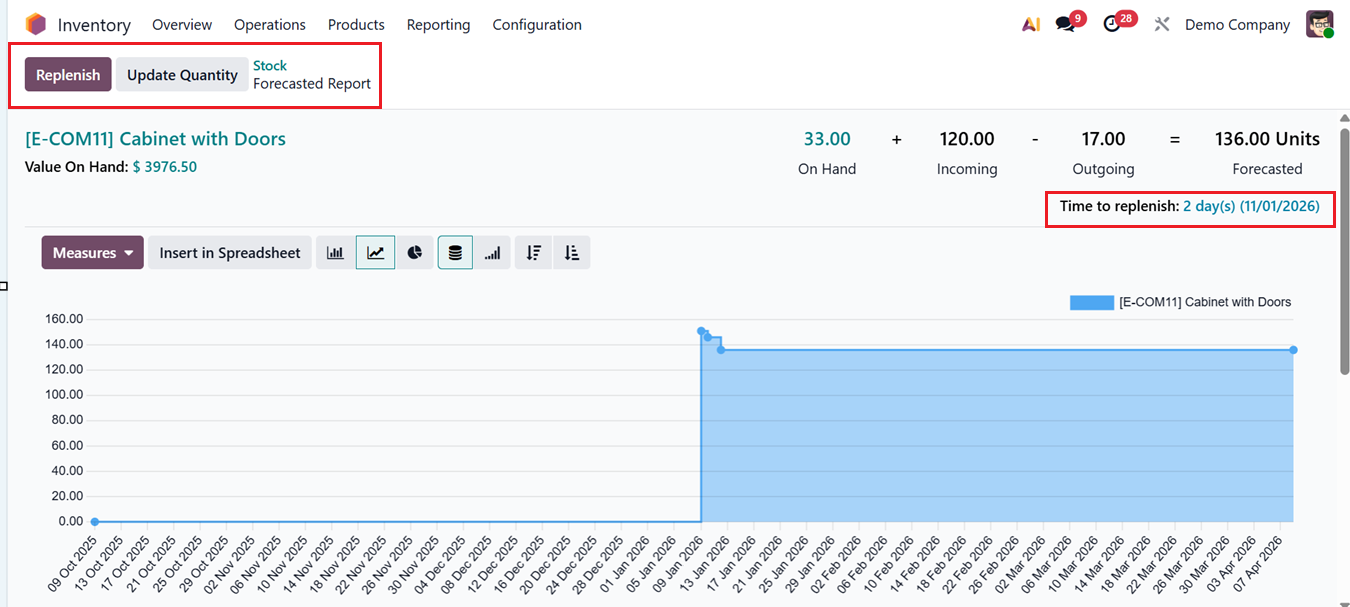
Using the provided icons, you can change the graphical view into Piechart, Stacked, Line Chart, Bar Chart, Cumulative, Ascending and Descending views for better understanding. Then, the ‘Measures’ dropdown can be used to change the graph parameters based on Count and Quantity.
Using the ‘Replenish' button from the top left corner, you can replenish the product routes and update current product quantity using the ‘Update Quantity’ button.
The ‘Inventory at Date’ feature of the main Stock reporting window enables users to view stock quantities exactly as they appeared on a chosen date in the past, as illustrated in the screenshot below.
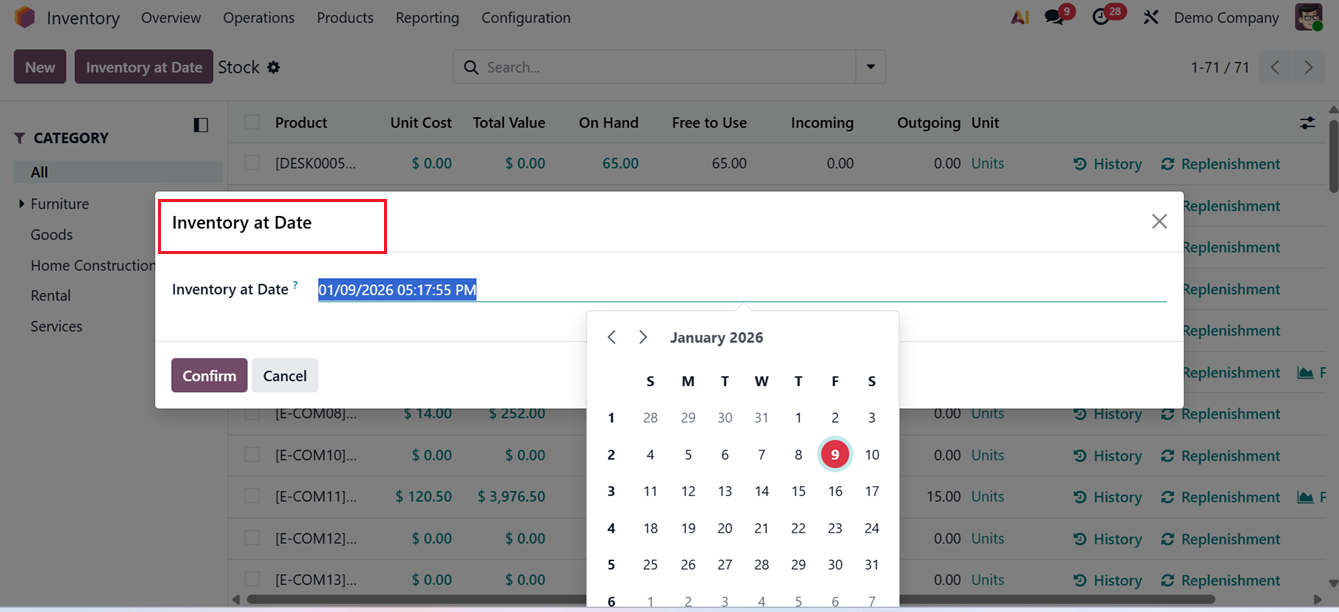
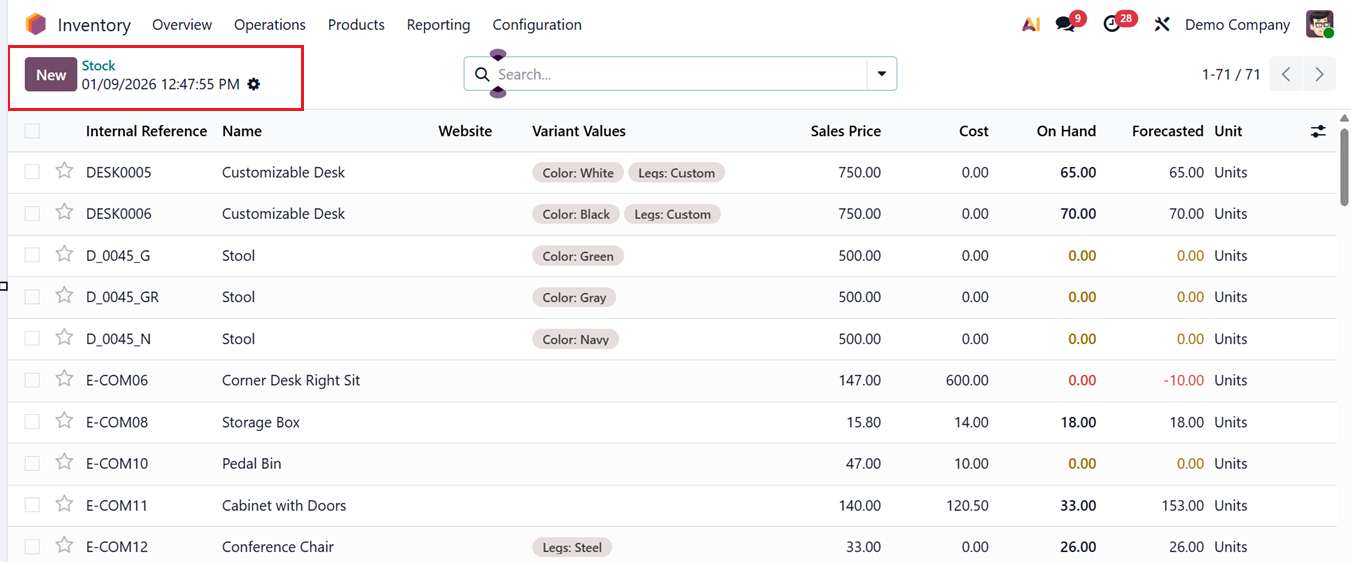
After choosing this option, the system redirects you to a page showing inventory quantities for that specific date.
1.2 Locations
The ‘Locations’ report in Odoo provides a clear list view that presents essential inventory details in a structured format. This view displays key information such as the Location, Product, Package, Lot/Serial Number, Owner, Inventoried Quantity, Reserved Quantity and Unit in a list view, as shown in the screenshot below.
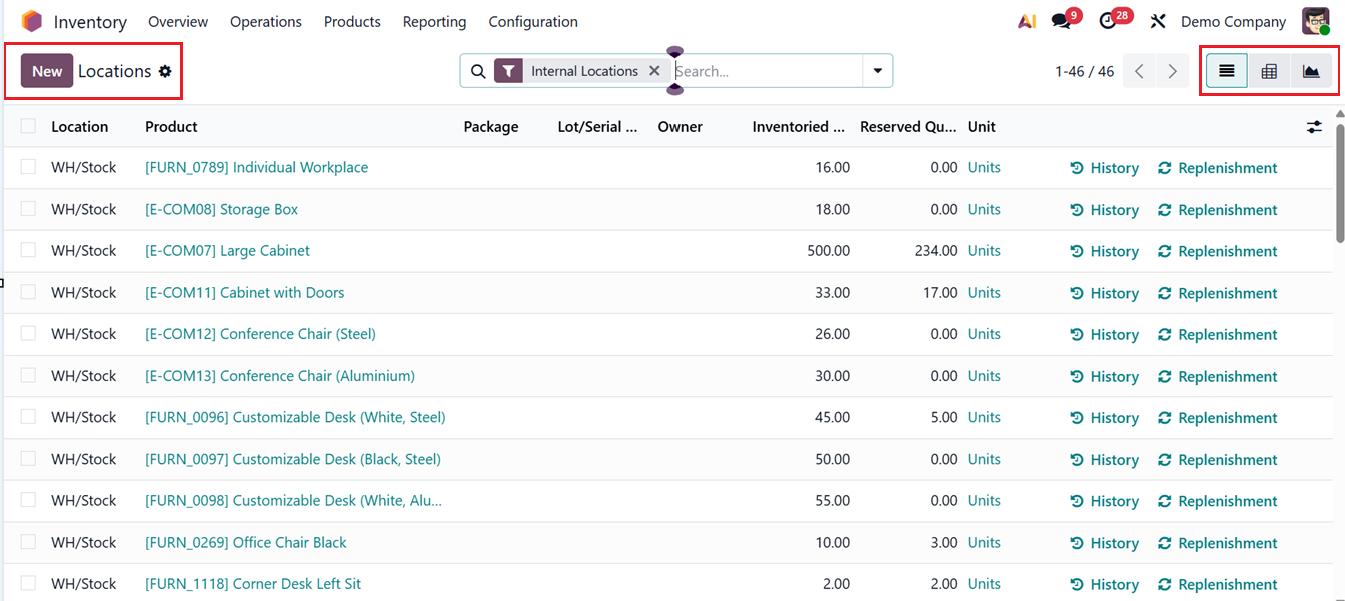
By consolidating these details in one place, users can quickly assess stock availability and allocation across different locations. From this reporting screen, you can take direct actions to manage inventory more efficiently. The History option allows them to review past stock movements for better traceability, while the Replenishment option enables quick restocking of products directly from the report. These features help streamline inventory control and ensure stock levels are maintained without navigating away from the report.
In addition to the List view, location data can also be analyzed using a Graph and Pivot table layout. The Pivot format allows users to summarize and compare inventory information using configurable ‘Measures’ including Available Quantity, Counted, Difference, Inventoried Quantity, Inventory frequency, Quantity, Reserved Quantity, Value and Count options, as shown in the screenshot below.
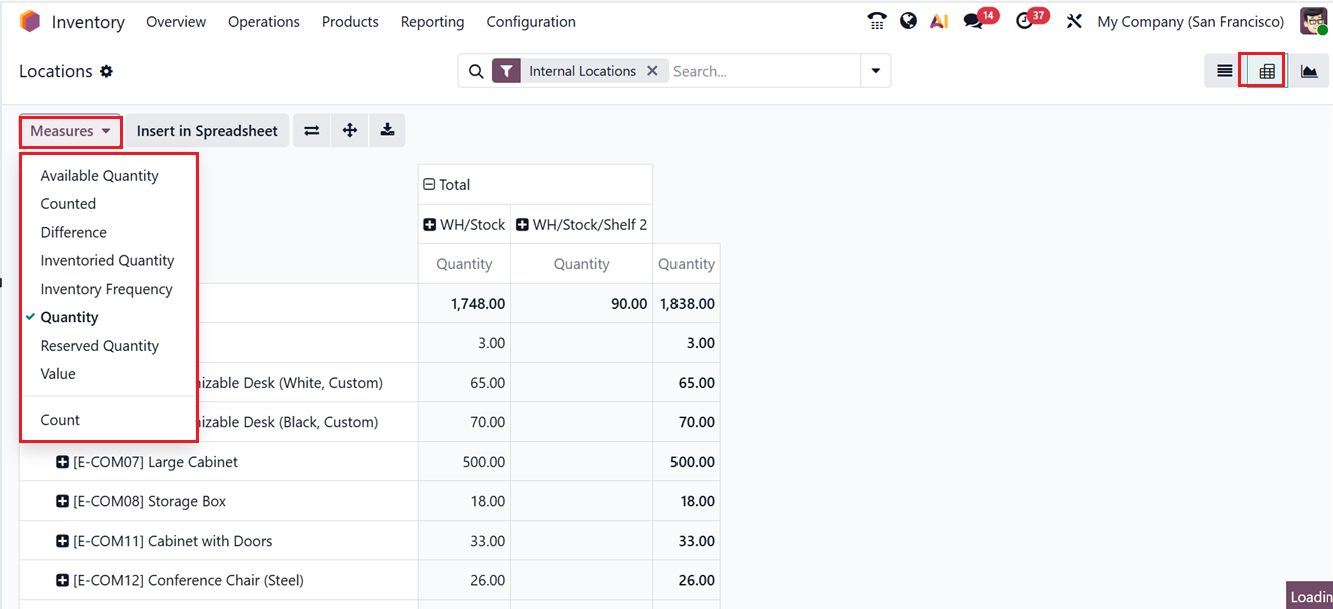
You can also insert the pivot data in a spreadsheet using the ‘Insert in Spreadsheet’ button and utilize the Flip Axis, Expand and Download xlsx icons for more detailed analysis.
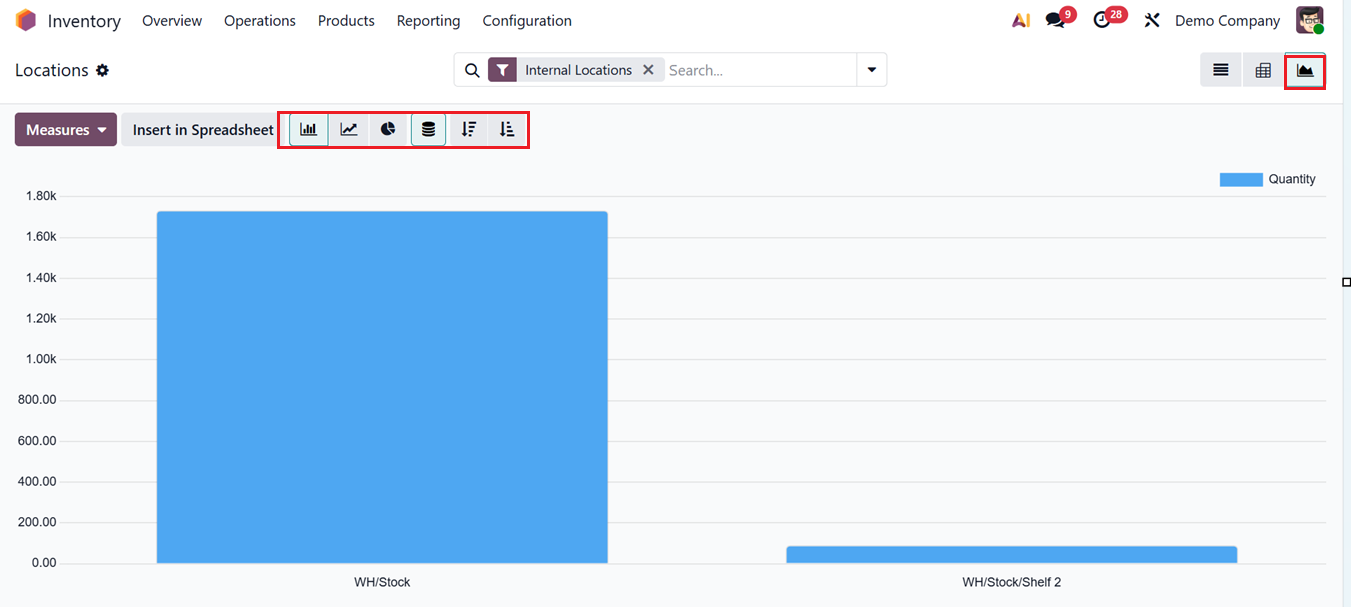
For visual analysis, the report can be converted into graphical formats such as bar charts, Pie charts, Line graphs, Stacked view, Ascending or Descending view after selecting the Graph view. This flexibility makes it easier to tailor inventor insights to specific business requirements and decision-making needs.
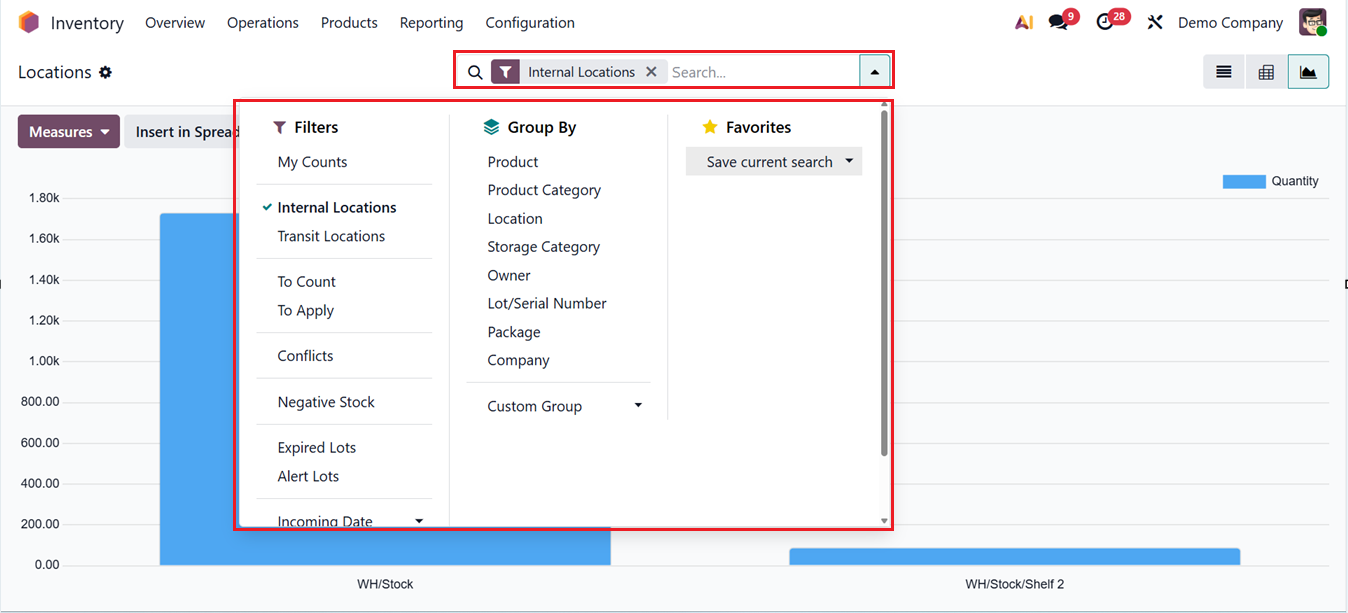
Using the Filter, Group By and Favorites options from the advanced search bar, you can sort out the required information and save recent searches in highlights. Also, Odoo provides a ‘Custom Filter’ and ‘Custom Group’ options to create customized filters according to your requirements, as shown in the screenshot below.
1.3 Moves History
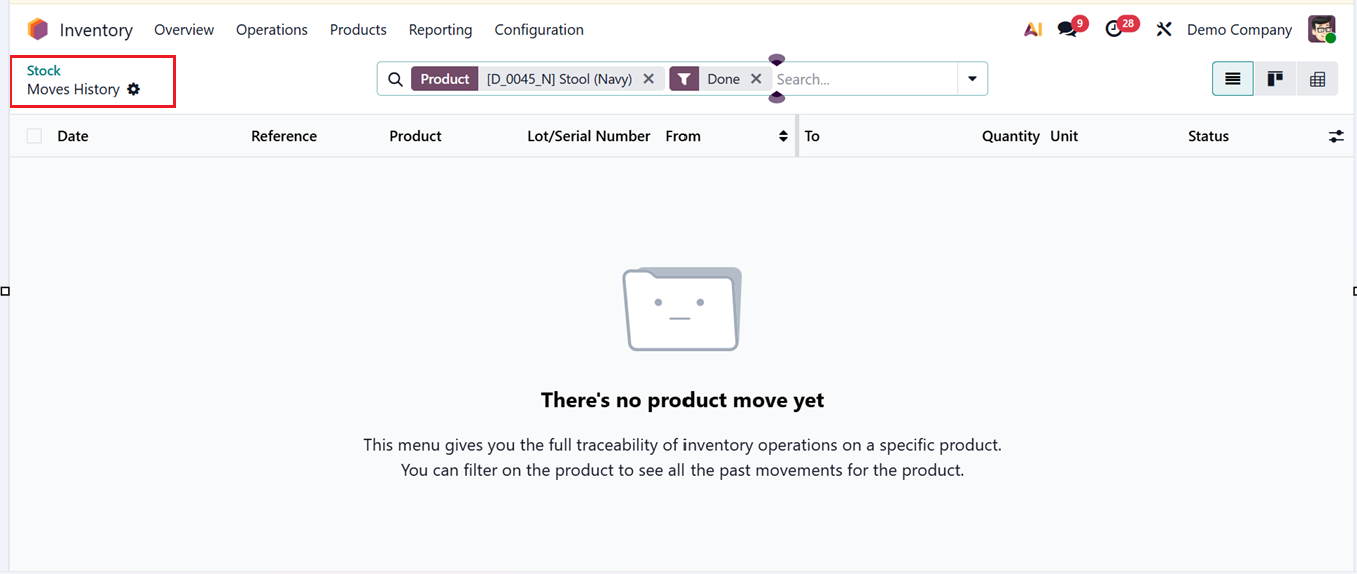
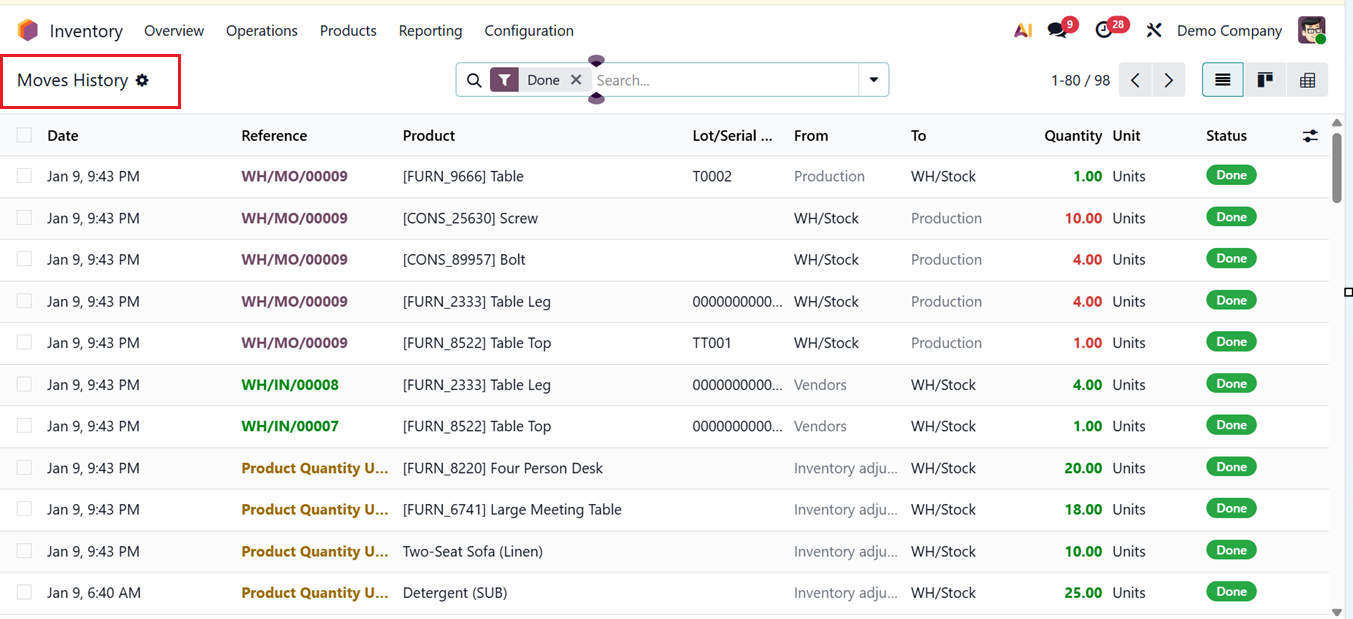
Odoo19 offers a separate platform for reviewing the complete movement history of each product in your inventory. This report allows you to clearly understand how individual items have been moved on a particular day. You can see the history of recent inventory movements in a list view along with the Date, Reference, Product, Lot/Serial Number, From and To Locations, Quantity, Unit and Current Status, as shown in the screenshot below.
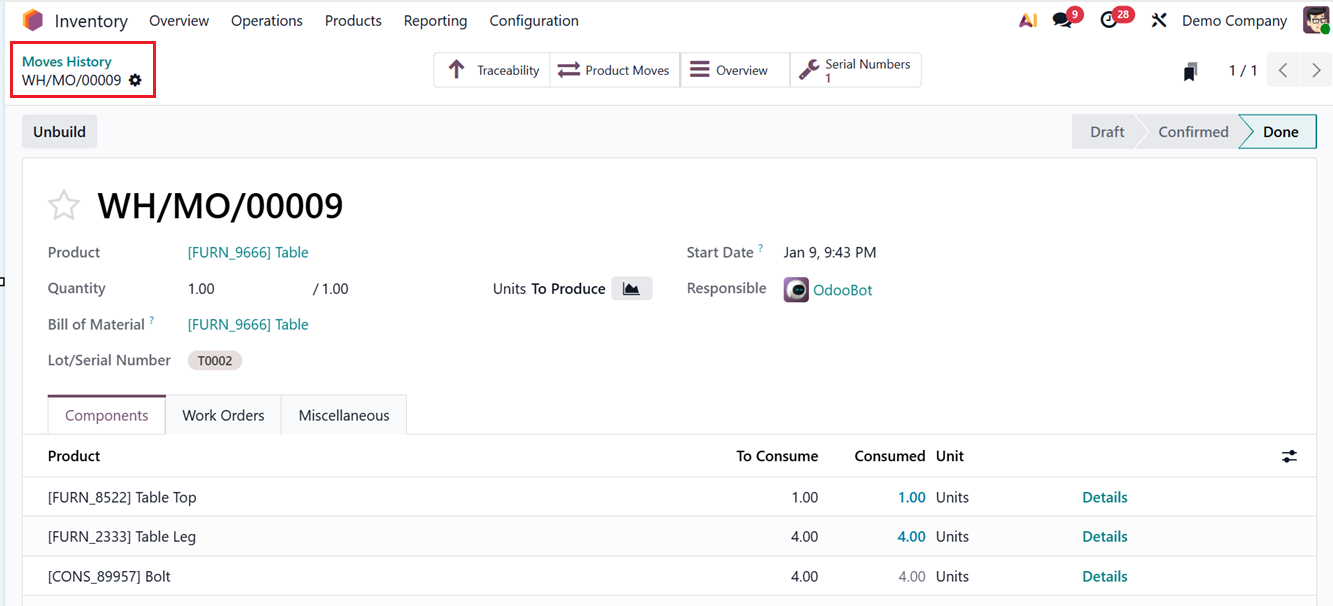
Clicking on any column will open the movement history window for the selected item. You can see the whole movement history from this window along with the Product Components, Work Orders, Traceability etc.
1.4 Moves Analysis
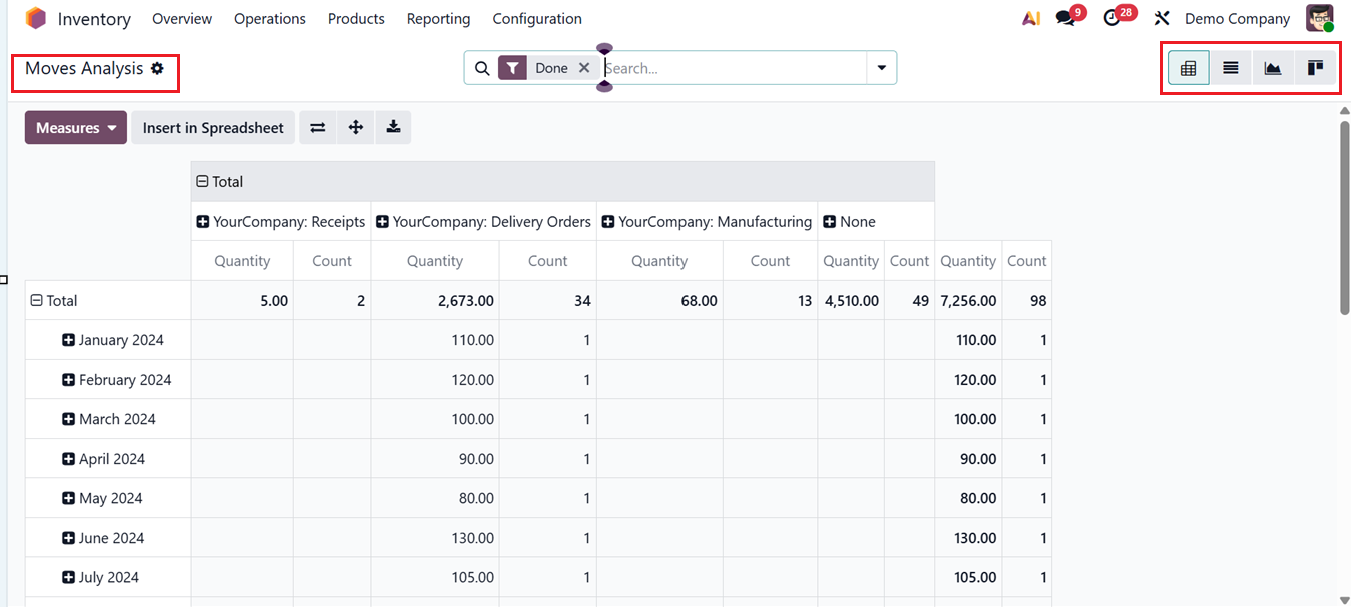
The ‘Moves Analysis’reporting section shares several similarities with Moves History; however, here the focus is on presenting product movements from a stock-based perspective. The Pivot View is primarily used for analyzing these movements, while other formats such as List View, Kanban View, and Graph View are also available for deeper insights, as depicted in the screenshot below.
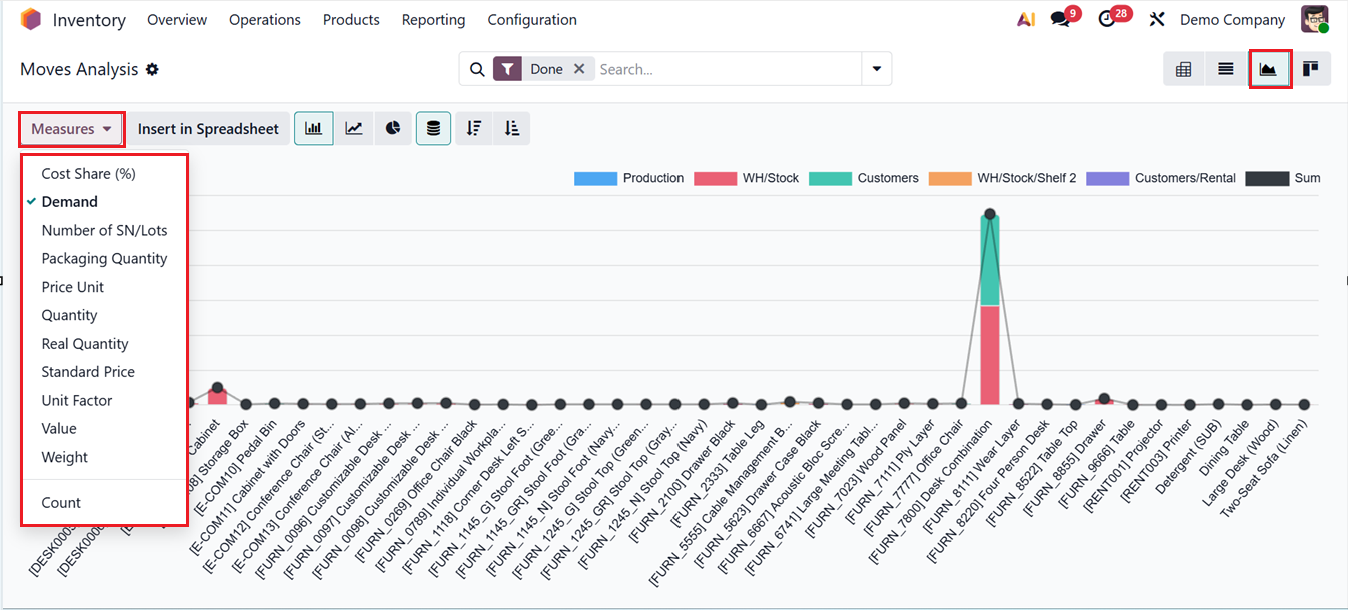
The remaining functionalities of the Moves analysis window follow the same structure as the previously discussed views. In this section, users can make use of the Measures option to switch between different analytical metrics, allowing the analysis to be tailored to specific areas of interest or reporting requirements.
These measures include Cost Share, Demand, Number of SN/Lots, Packaging Quantity, Price Unit, Quantity, Real Quantity, Standard Price, Unit Factor, Value, weight and Count. This flexibility helps analysis teams focus on the data points most relevant to their objectives.
The advanced search bar can be used to sort the required information based on various Filters and Group By options. You can also create customized filters and groups using the ‘Custom Filter’ and ‘Custom Group’ options.
1.5 Performance
In Odoo 19 Inventory, the Performance reporting window provides a Warehouse Analysis Reporting that helps businesses track and optimize warehouse operations by providing insights into stock movements, efficiency, and resource use. It covers stock movement analysis, inventory valuation and turnover, product and category performance, and warehouse efficiency metrics like picking, packing, and delivery speed.
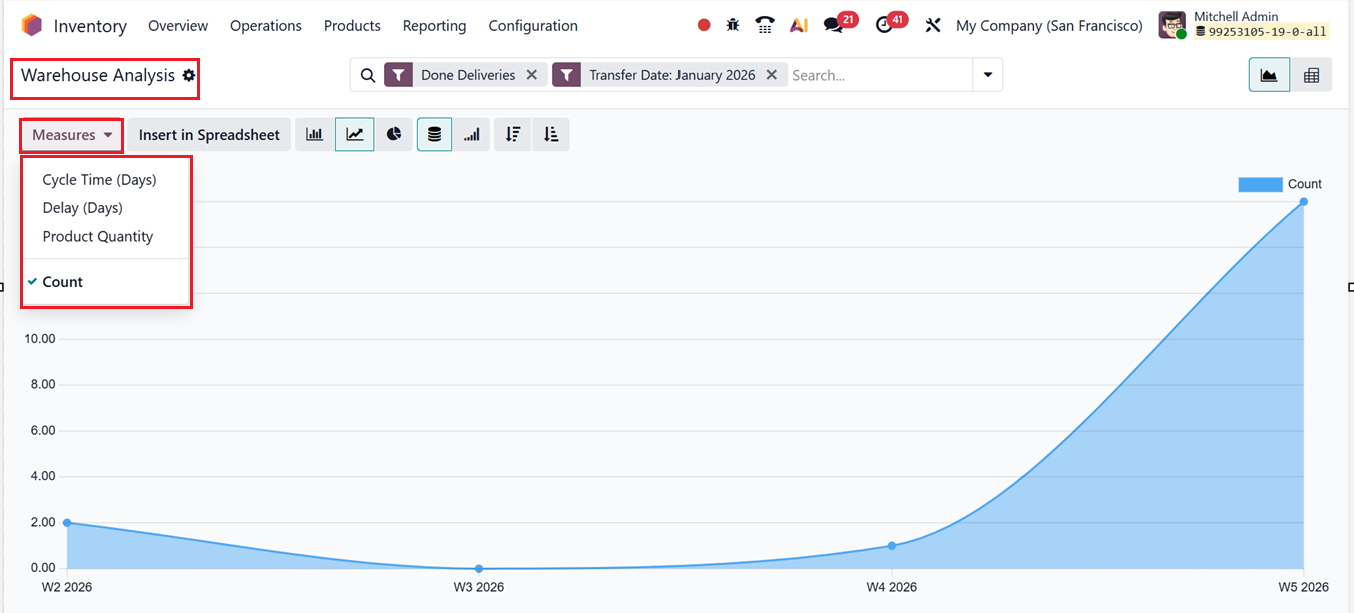
The reporting window can be customizable into Pivot and Graphical views for flexible data analysis. Using the ‘Measures’ options, you can change the graph parameters based on Cycle Time(Days), Delay (Days), Product Quantity and Count.
The advanced search bar can be used to sort the required information based on various Filters and Group By options. You can also create customized filters and groups using the ‘Custom Filter’ and ‘Custom Group’ options.
Overall. The Odoo19’s advanced inventory management capabilities allow you to supervise and coordinate all inventory processes from a centralized environment. Its highly integrated Inventory module ensures streamlined warehouse operations and optimal workflow performance.