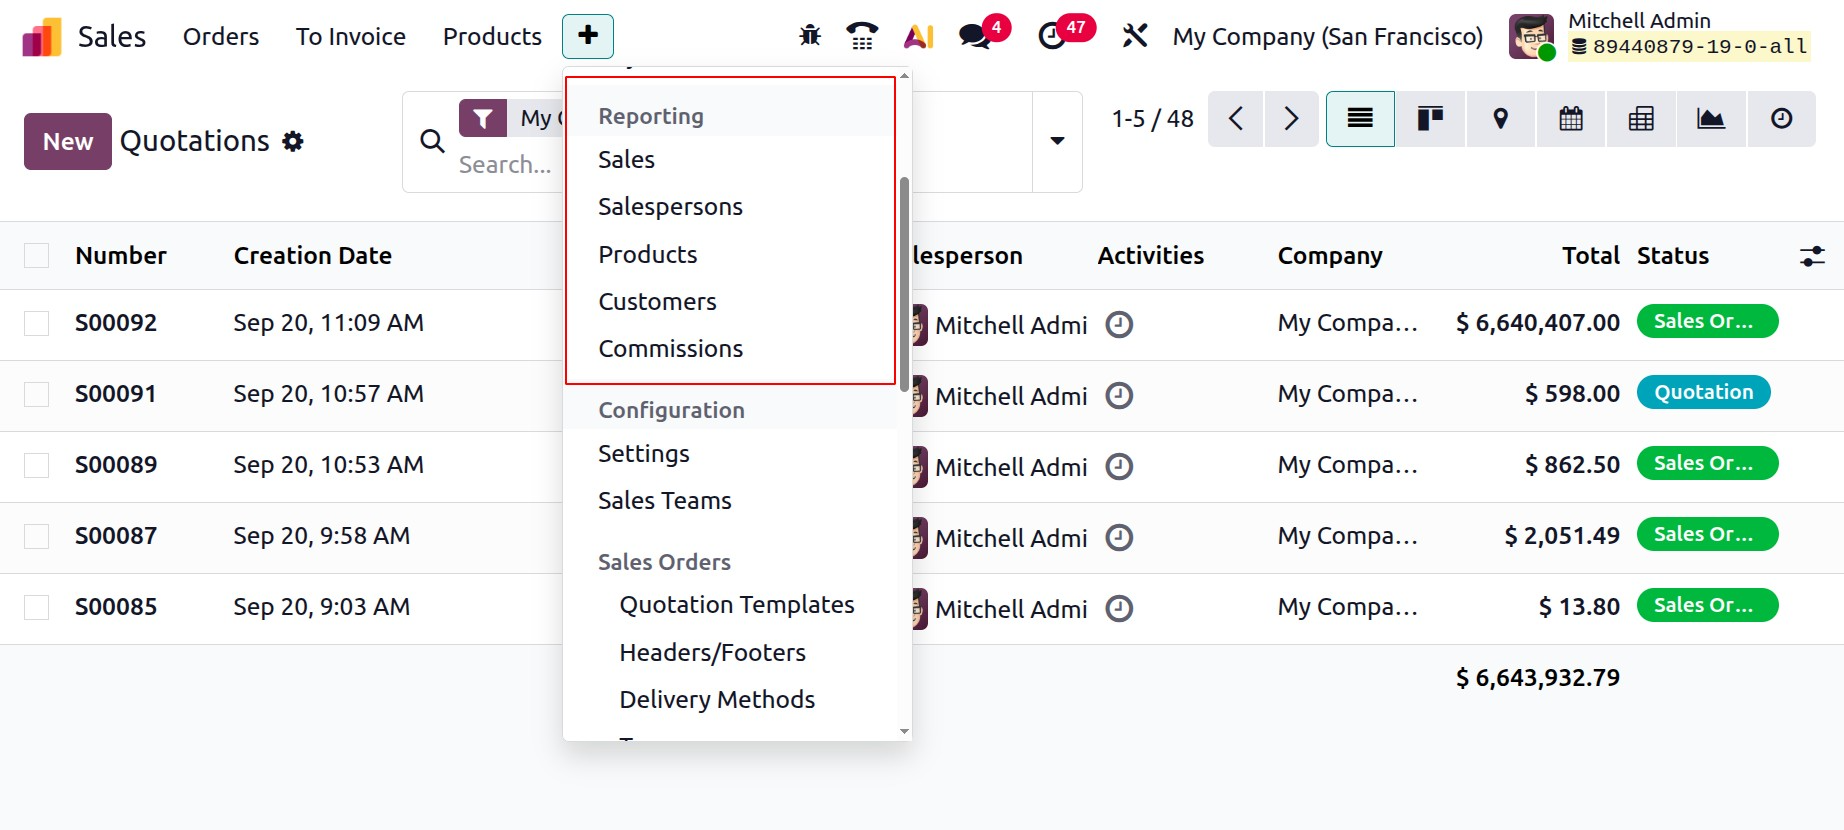
Reporting
Reviewing sales operations on a regular basis will help you quickly understand your workflow, which will benefit you. An effective sales reporting system will enable you to have a comprehensive idea of the sales management operations conducted in your business. The Odoo 19 ERP system allows you to swiftly generate sales reports.
1.1 Sales
The Measures option in the Sales Analysis view allows you to choose particular data categories for analysis from a dropdown list.
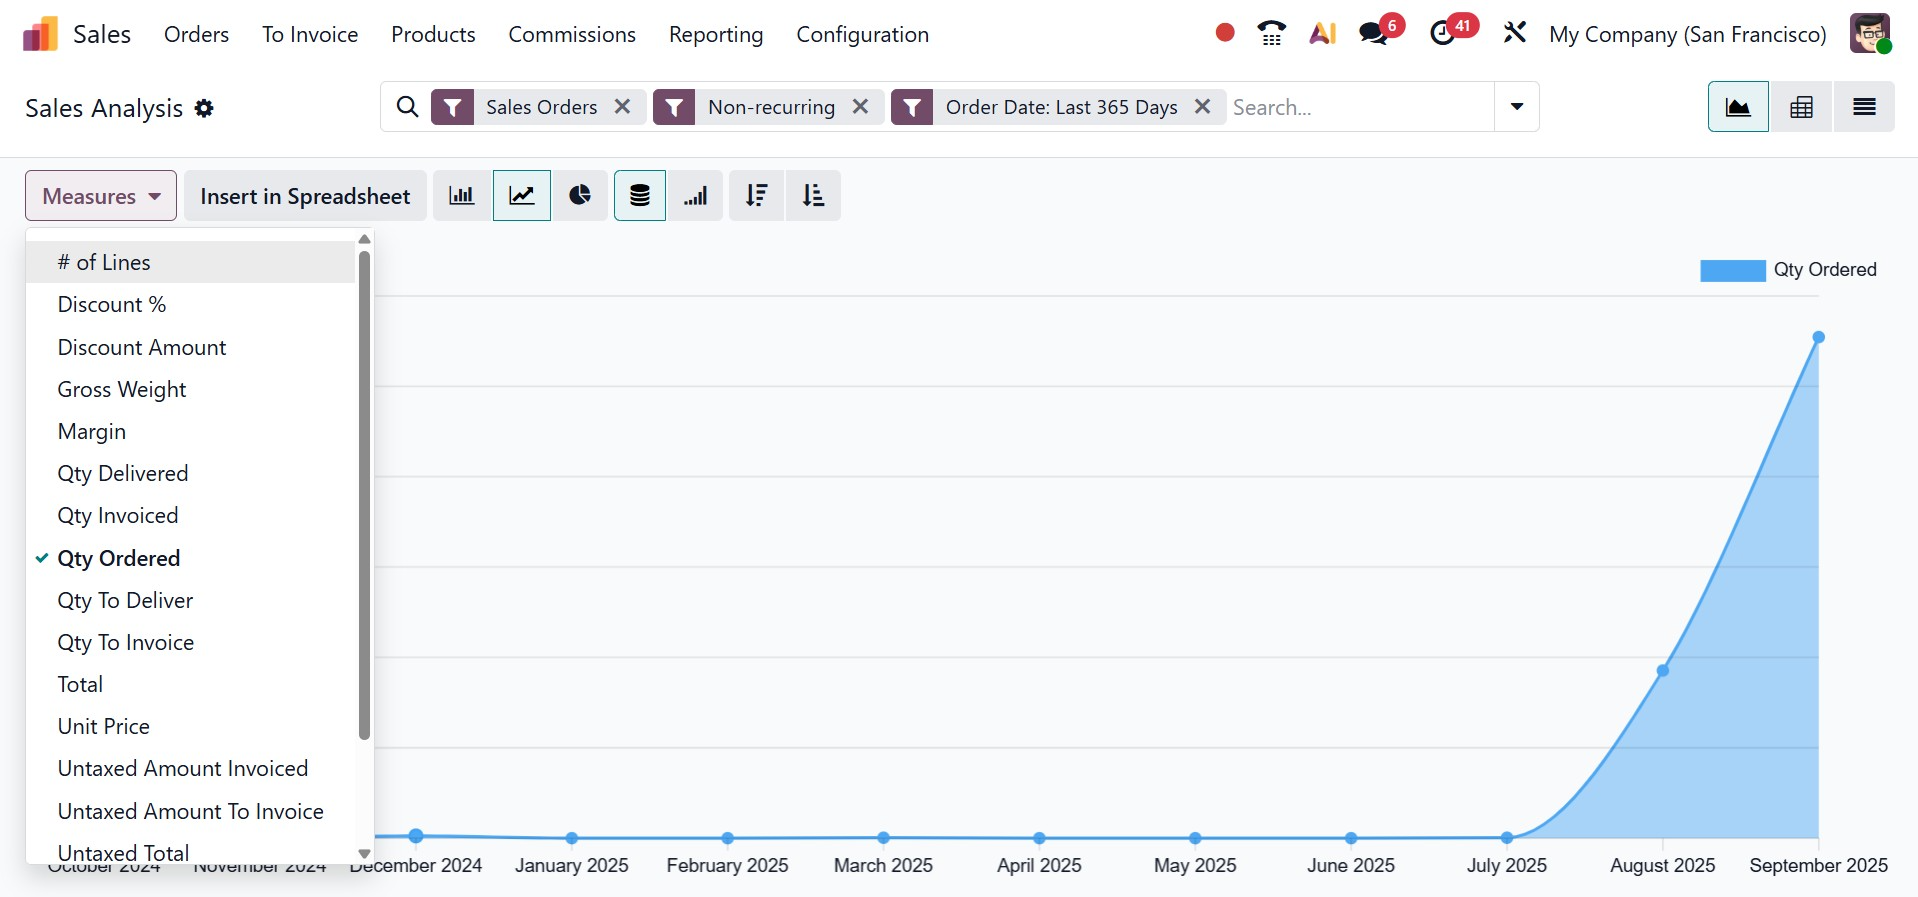
The icons in the window's upper right corner can also be used to alter the view. For instance, you can switch between the Pivot and Graph views.
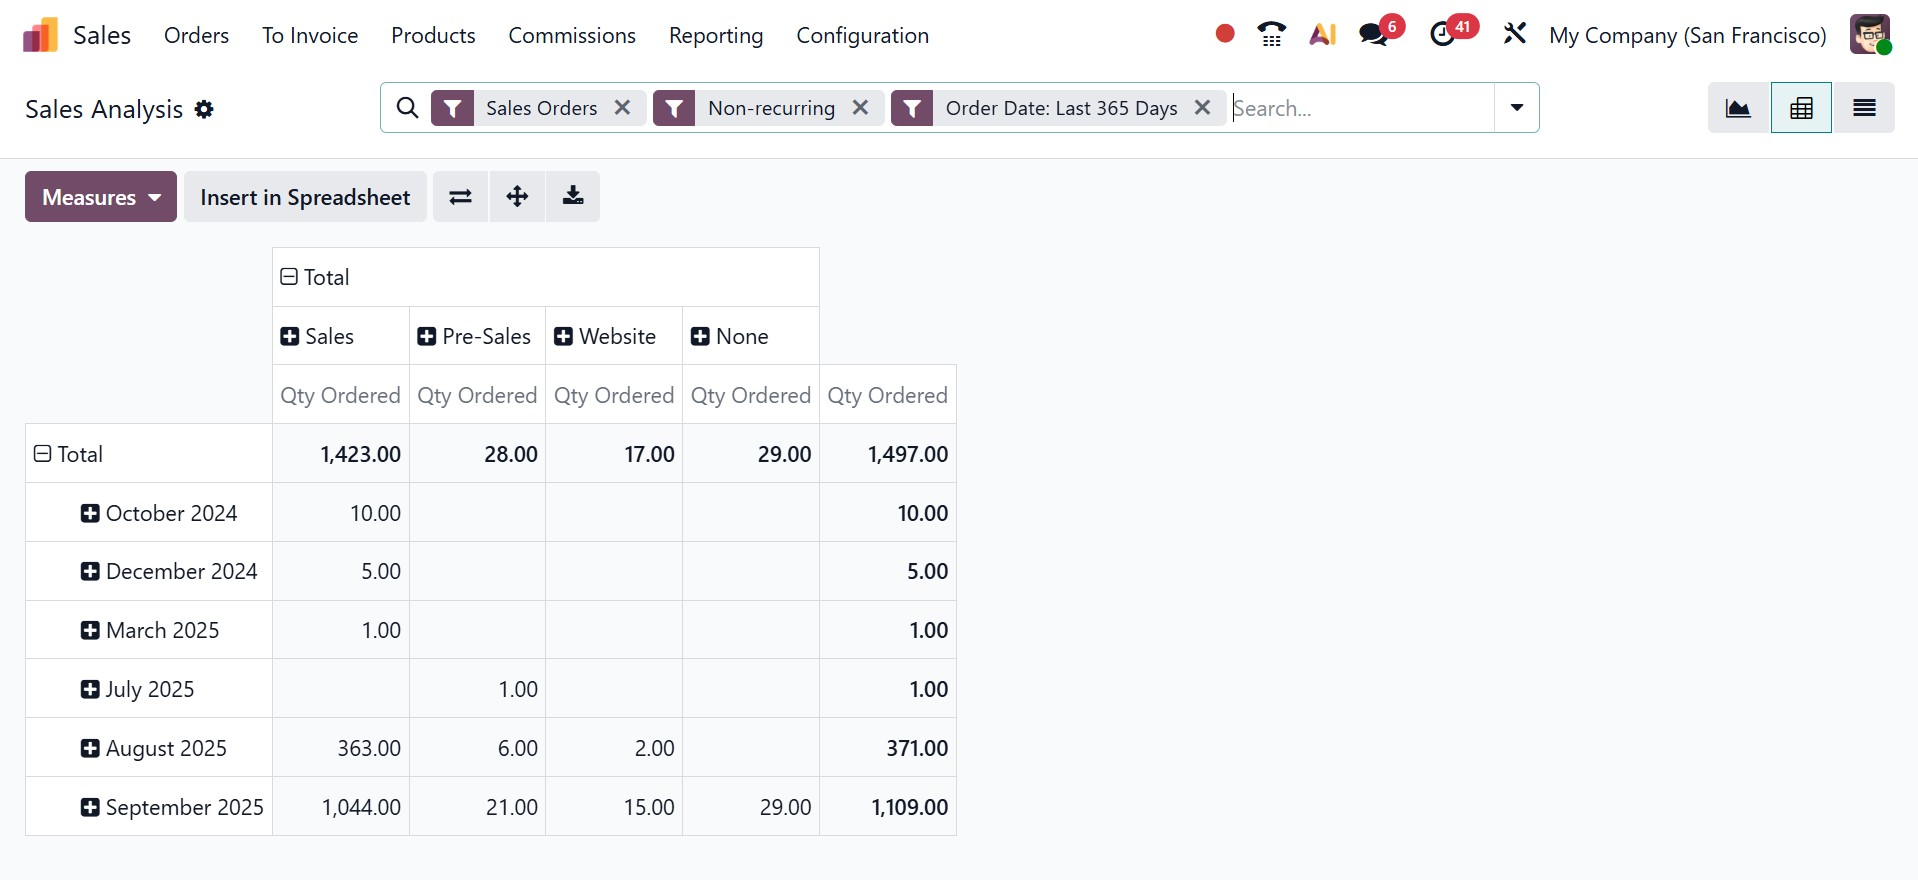
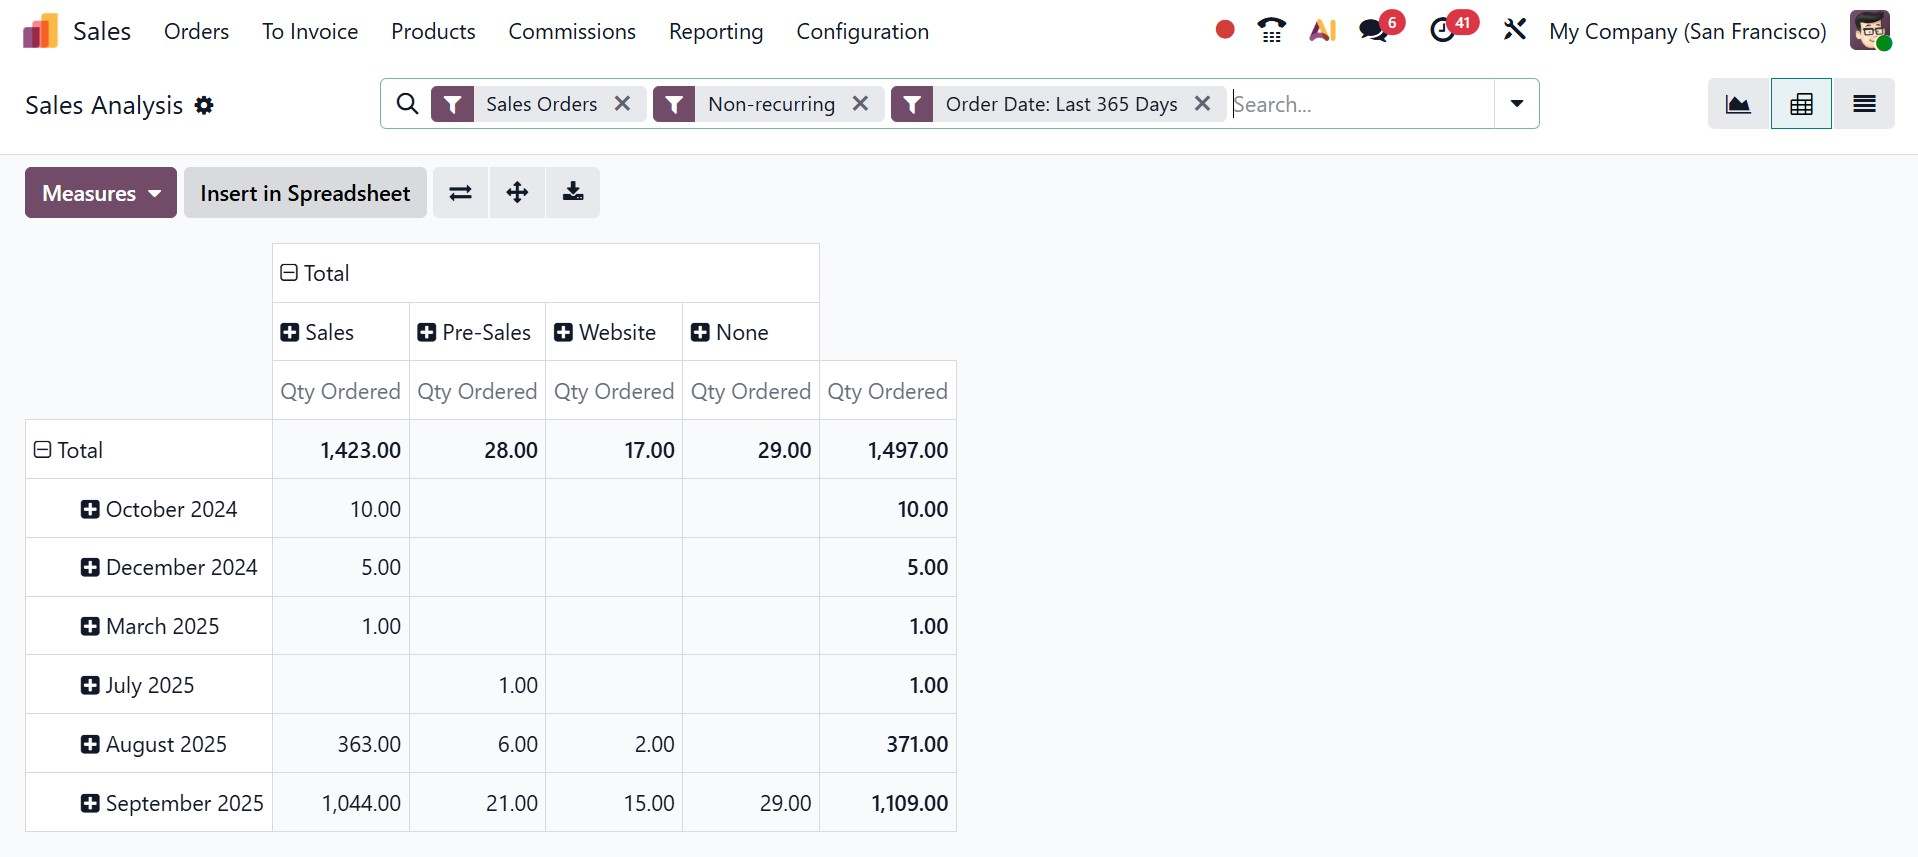
Your sales report is shown in tabular form in the Pivot view, which facilitates extensive data analysis. Furthermore, you can export the data to an Excel file using the Download xlsx tool and flip the axes for improved viewing with the Flip Axis icon. For a more thorough inspection, you can drill down into the records' specifics using the Expand all option. With the ability to filter data for particular days, weeks, months, or years, filters further improve reporting capabilities by enabling you to create sales reports based on Order Date, as in the image below.
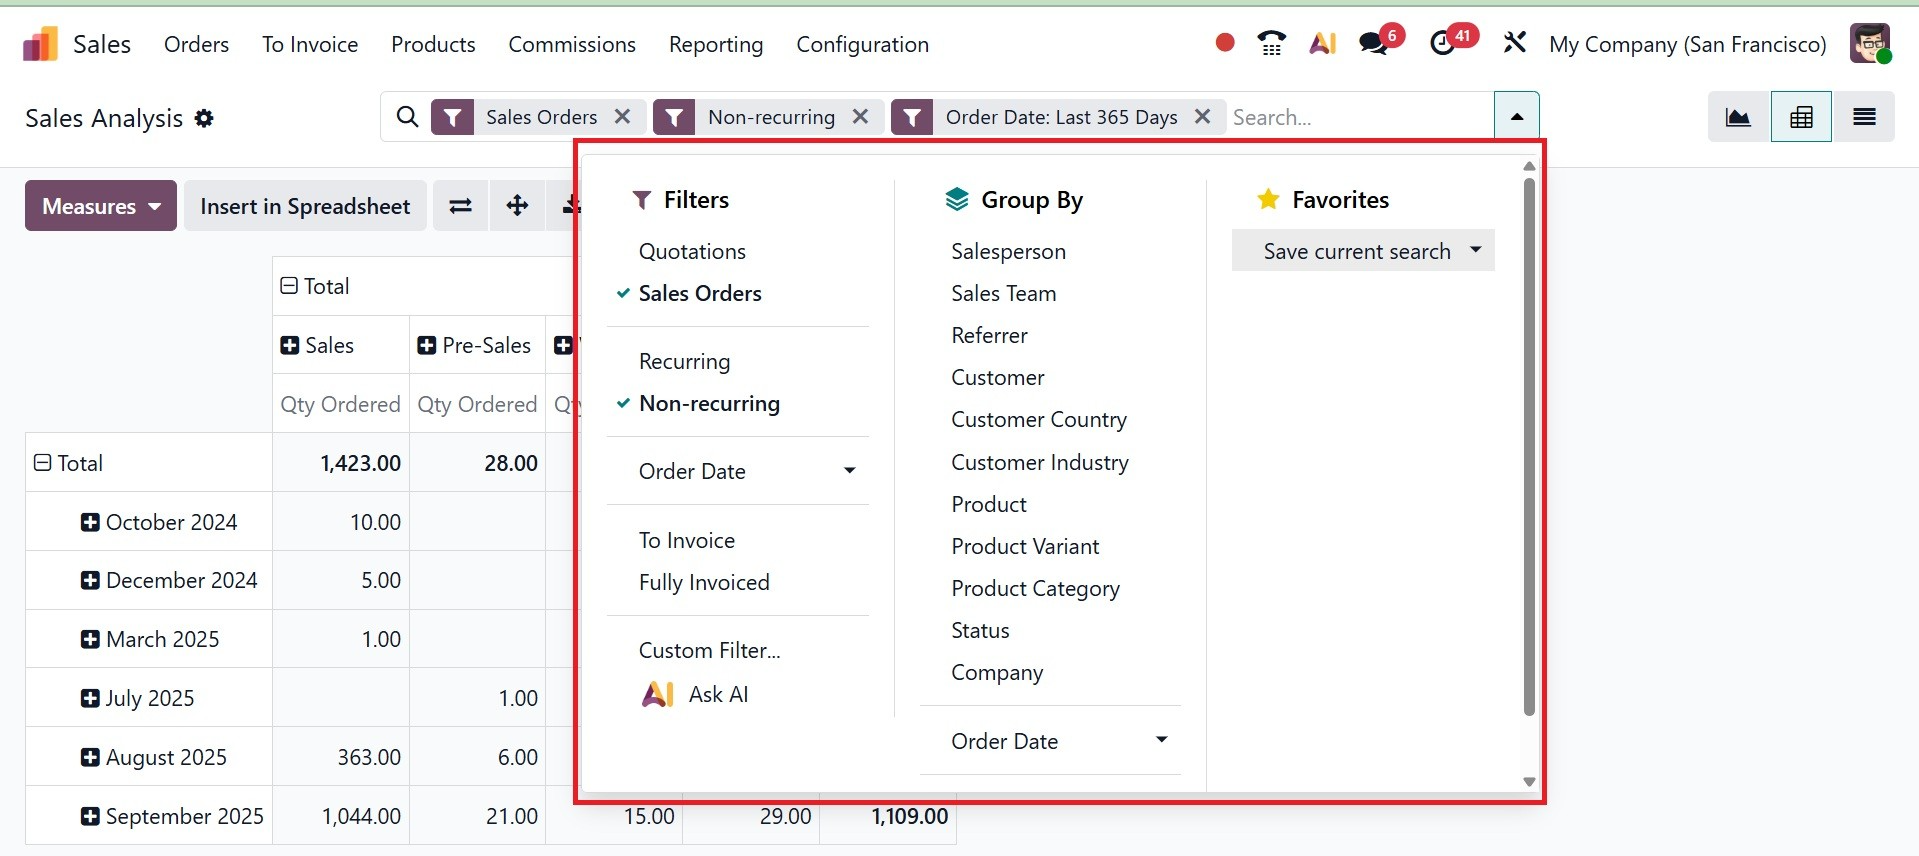
Both pivot and graphic types of visualization are available for the reports. The three chart types available in the Graphical view—the Bar Chart, Line Chart, and Pie Chart—each give distinct viewpoints to help comprehend sales trends and patterns.
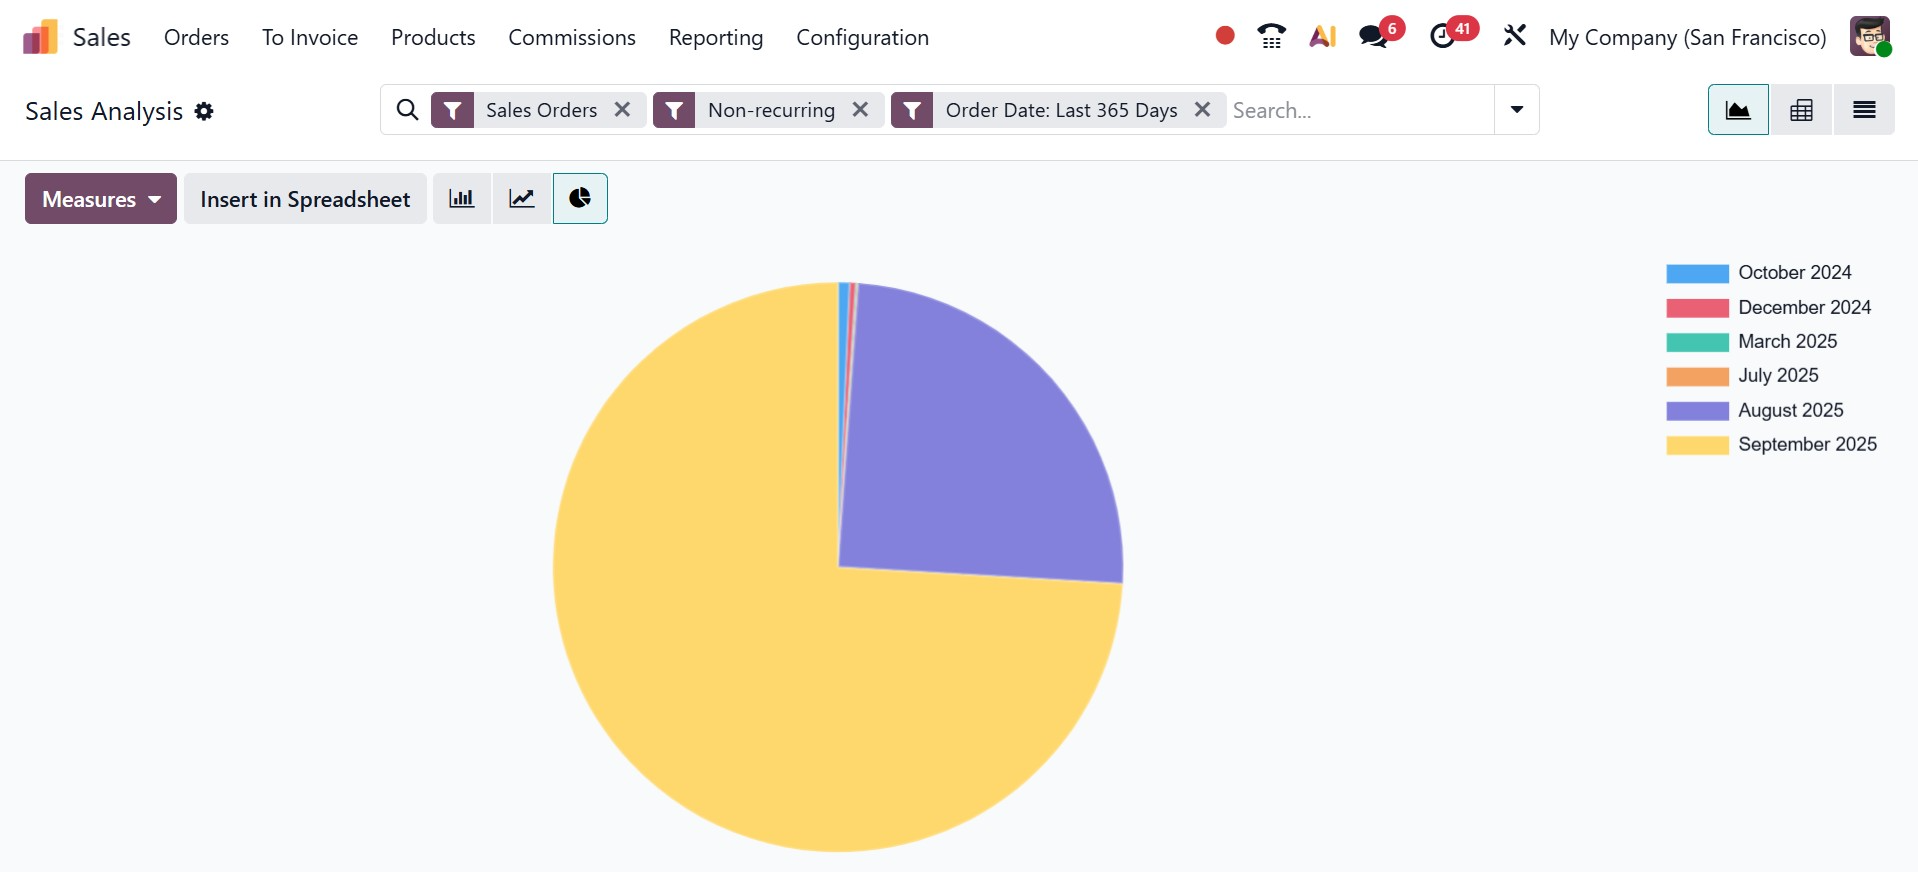
In addition to making managing sales activities easier, the Odoo 19 Sales module is an effective tool for micromanaging bids. Its sophisticated reporting and visualization tools guarantee smooth sales operations and provide useful insights to help your company expand and succeed.
1.2 Salesperson
Businesses can assess each sales representative's performance with Odoo's Sales Analysis by Salespersons tool, which facilitates improved monitoring, planning, and decision-making. This research helps determine areas for development or incentives and offers insights into how each salesperson contributes to the total revenue.
Go to the Sales module and choose the Reporting tab to use this feature. You can alter the data in the Sales Analysis By Salespersons pane to highlight particular salespeople. To see data broken down by specific sales representatives, use the Group By option and choose the Salesperson option. The study can be further refined by adding other criteria, like date ranges or particular sales orders.
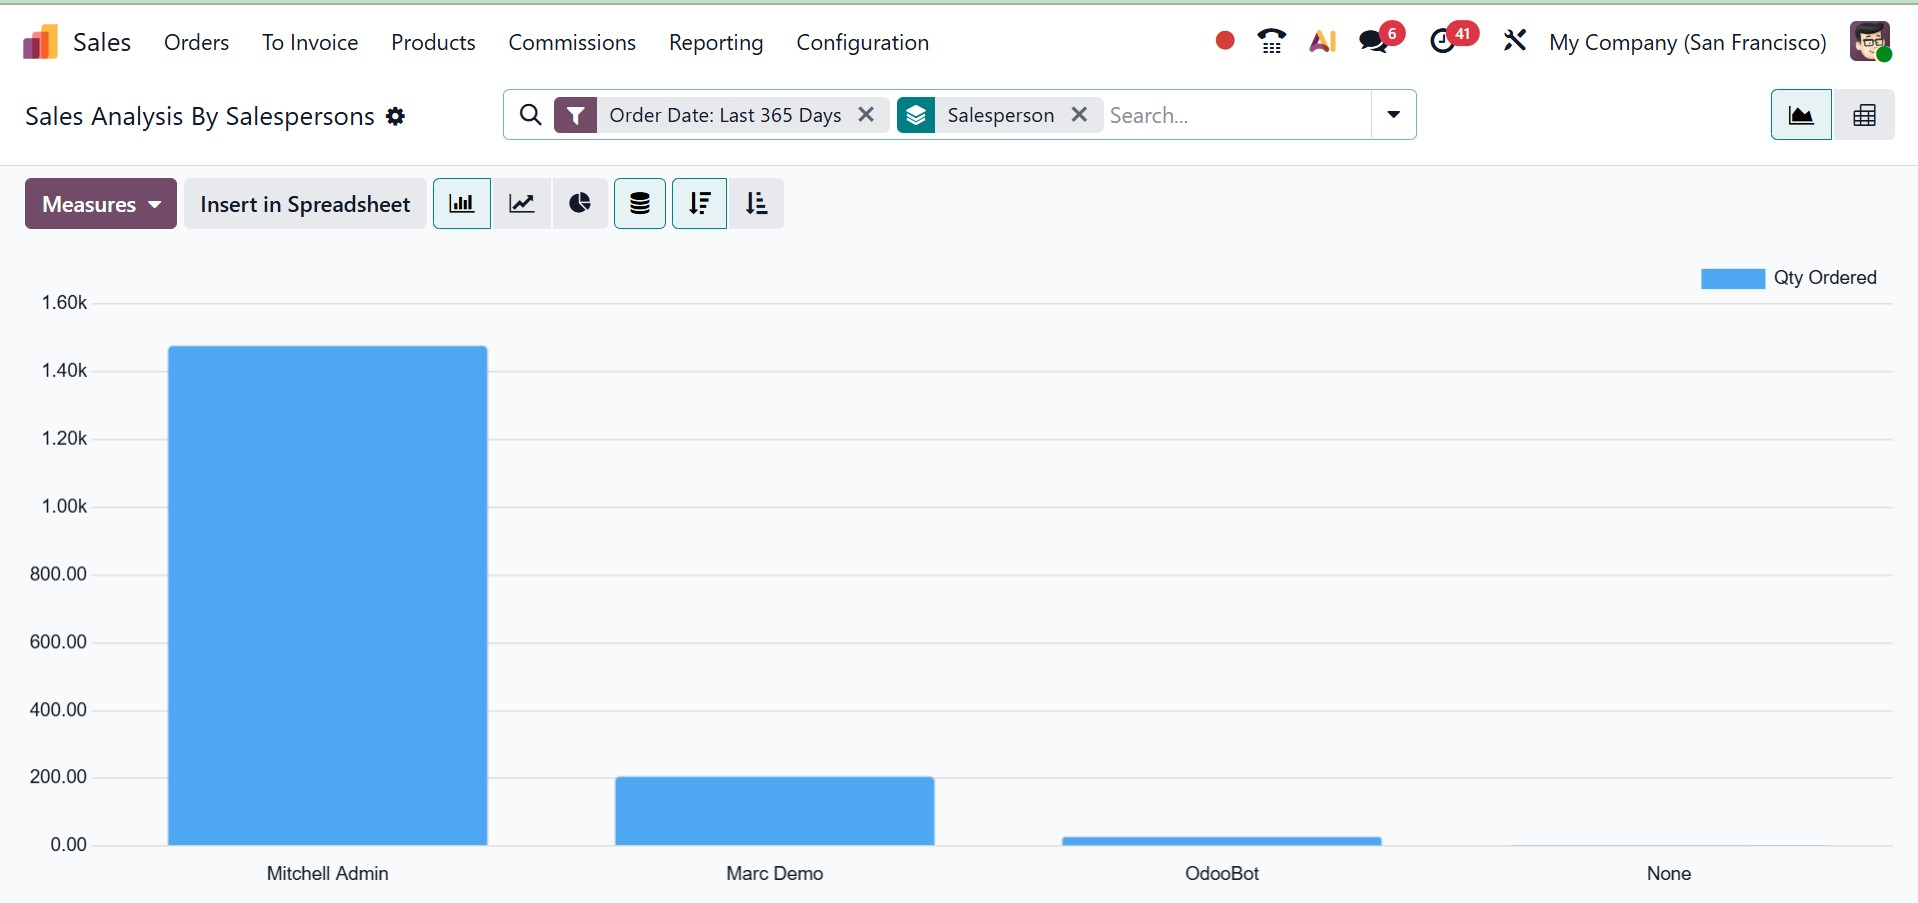
Both graphic and pivot versions are available for viewing the findings. A visual depiction of each salesperson's performance is provided via the Graphical view, which is accessible as:
- Bar Chart: Perfect for comparing individual performance, this chart shows sales numbers per salesperson in an easy-to-read style.
- Line Chart: Highlights growth or fall in each salesperson's sales performance over time.
- Pie Chart: Provides a clear picture of each salesperson's relative influence by breaking down the percentage of total sales that they contributed.
Indicators like total sales, revenue, and order quantities for each salesperson are among the indicators that are included in the comprehensive tabular representation of sales performance that is offered by the Pivot view. For in-depth examination or exporting data for external use using the Download xlsx option, this view is particularly helpful.
1.3 Product
The Odoo Sales module's product reporting provides thorough insights into product performance, assisting companies in streamlining price plans, inventory control, and sales processes. Users can get comprehensive information on product sales, revenue, and trends by going to the Reporting tab in the Sales module.
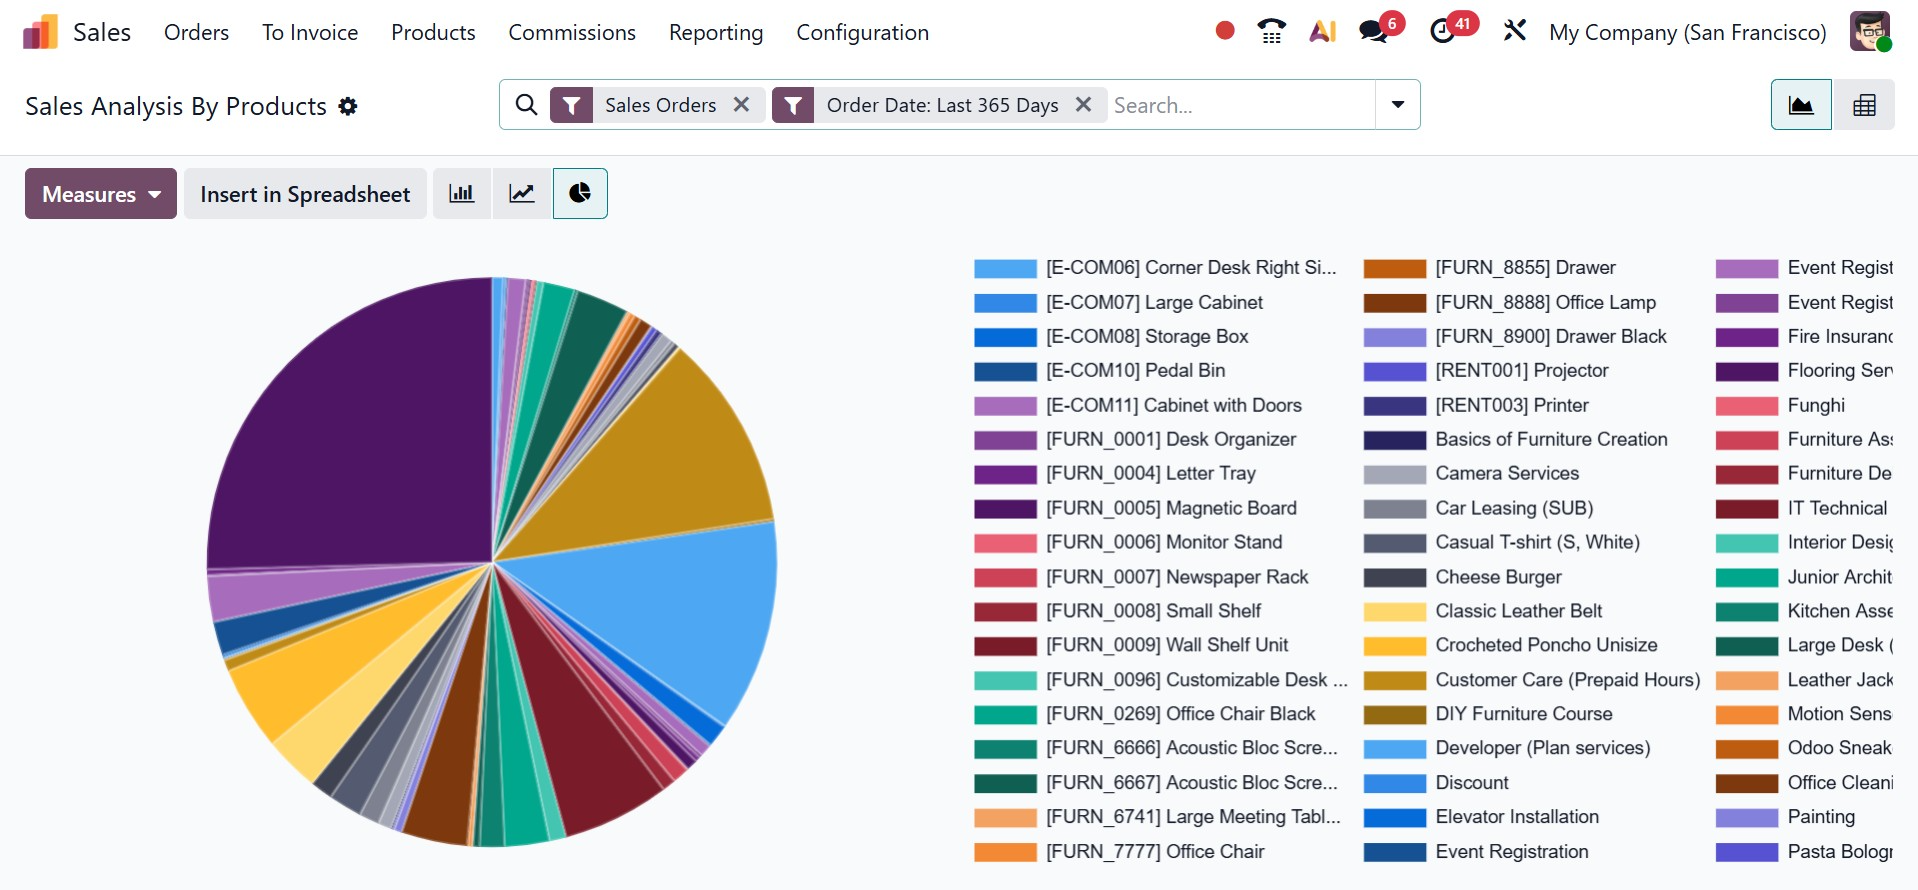
The module makes it possible to customize reports to meet certain requirements by using grouping options and filters. To examine sales patterns and pinpoint high- or low-performing products, users can, for instance, filter sales data by product, product category, or time period. Furthermore, the reports can be seen in a variety of formats, including pivot tables and graphical representations (bar, line, or pie charts), which facilitate data interpretation and actionable activities.
1.4 Customers
Businesses can assess customer-specific sales success by using the Odoo Sales module's sales analysis feature, which gives them vital information about revenue contribution, client value, and purchase trends. Users can examine sales trends and pinpoint important accounts by accessing comprehensive reports that are filtered by customer, by going to the Reporting tab in the Sales module.
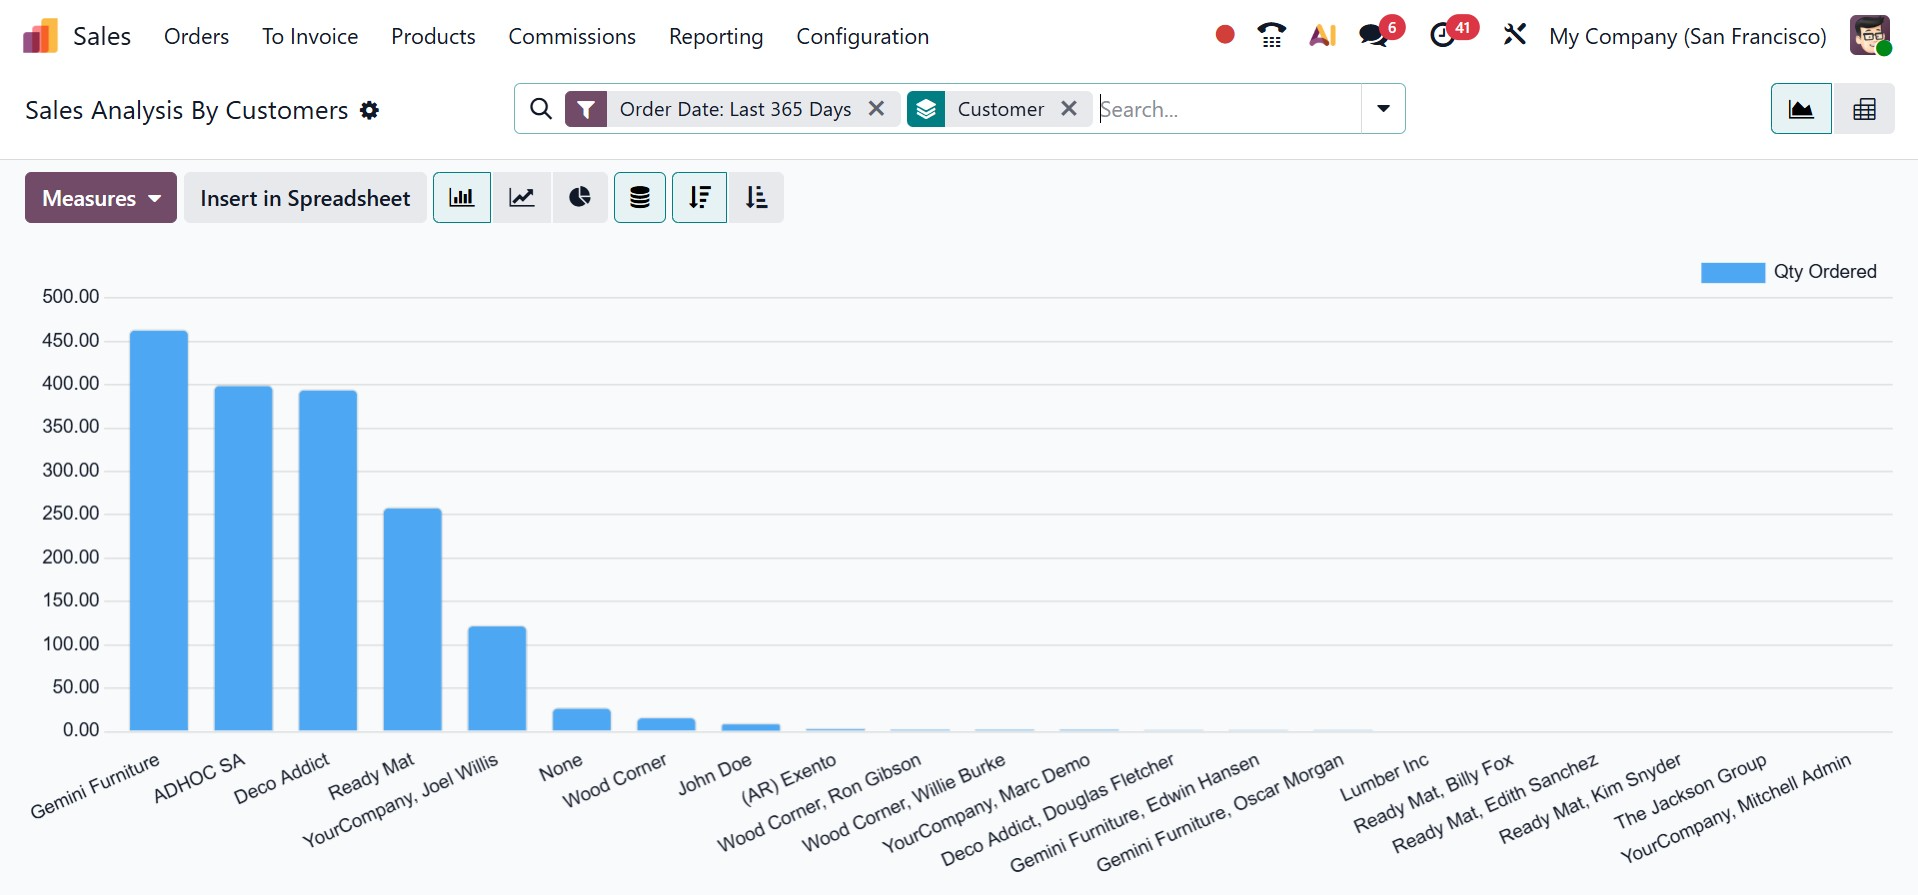
Filters and group-by options allow you to further tailor these reports to show data for particular time periods, customer types, or geographical areas. While the pivot view provides a comprehensive tabular format for in-depth research, the graphical view provides visual representations, including bar charts, line charts, and pie charts. Furthermore, metrics like income, amount sold, or total sales can be chosen to match the study with corporate goals.
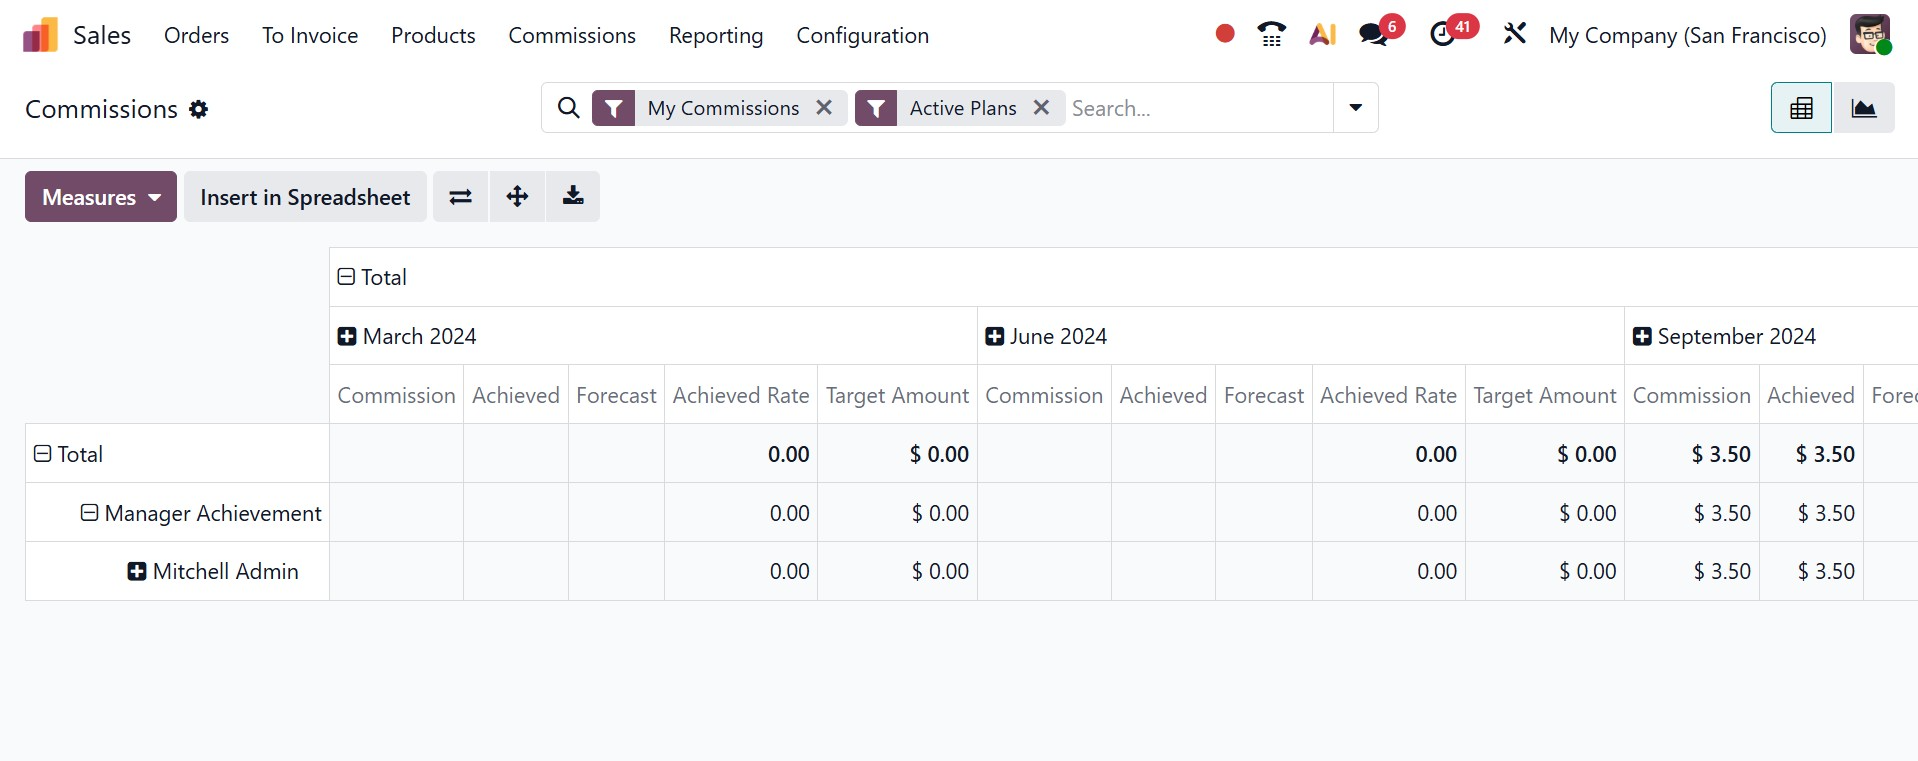
1.5 Commissions
The percentage or fixed sum of sales revenue awarded to a salesperson or sales team as a reward for closing deals is referred to as commission in the Odoo Sales module reporting. Reports are kept track of in order to assess sales success, encourage employees, guarantee commission computation accuracy, and examine profitability by contrasting commission expenses with sales income.
From quotes to order confirmation, delivery, invoicing, and marketplace connection, the Odoo Sales module offers a comprehensive and adaptable way to handle the whole sales process. It is quite versatile for both B2B and B2C enterprises thanks to features like units of measure, packaging, pricing, promotions, and integrations with platforms like Amazon and Shopee. Odoo Sales improves customer experience, lowers errors, and streamlines operations by centralizing product, customer, and order data. To put it briefly, it is an effective tool that helps companies improve sales performance, keep correct records, and become more efficient.