Odoo 19 Accounting's Balance Sheet report offers a concise overview of a business's financial situation at a particular moment in time. It displays what the company owns and owes by summarising its assets, liabilities, and equity. Businesses can use this report to evaluate their financial stability and make well-informed choices regarding growth, expenditures, and investments. The Balance Sheet becomes interactive with Odoo 19, enabling users to go deeply into specific accounts for comprehensive insights. Businesses may preserve openness, enhance financial planning, and guarantee accurate record-keeping by making appropriate use of this report.
Before starting the Balance Sheet, let's check the Chart of Accounts. Which account types are visible under this balance sheet report? In Odoo 19, the charts of account types are arranged according to how they are visible inside the Reports.
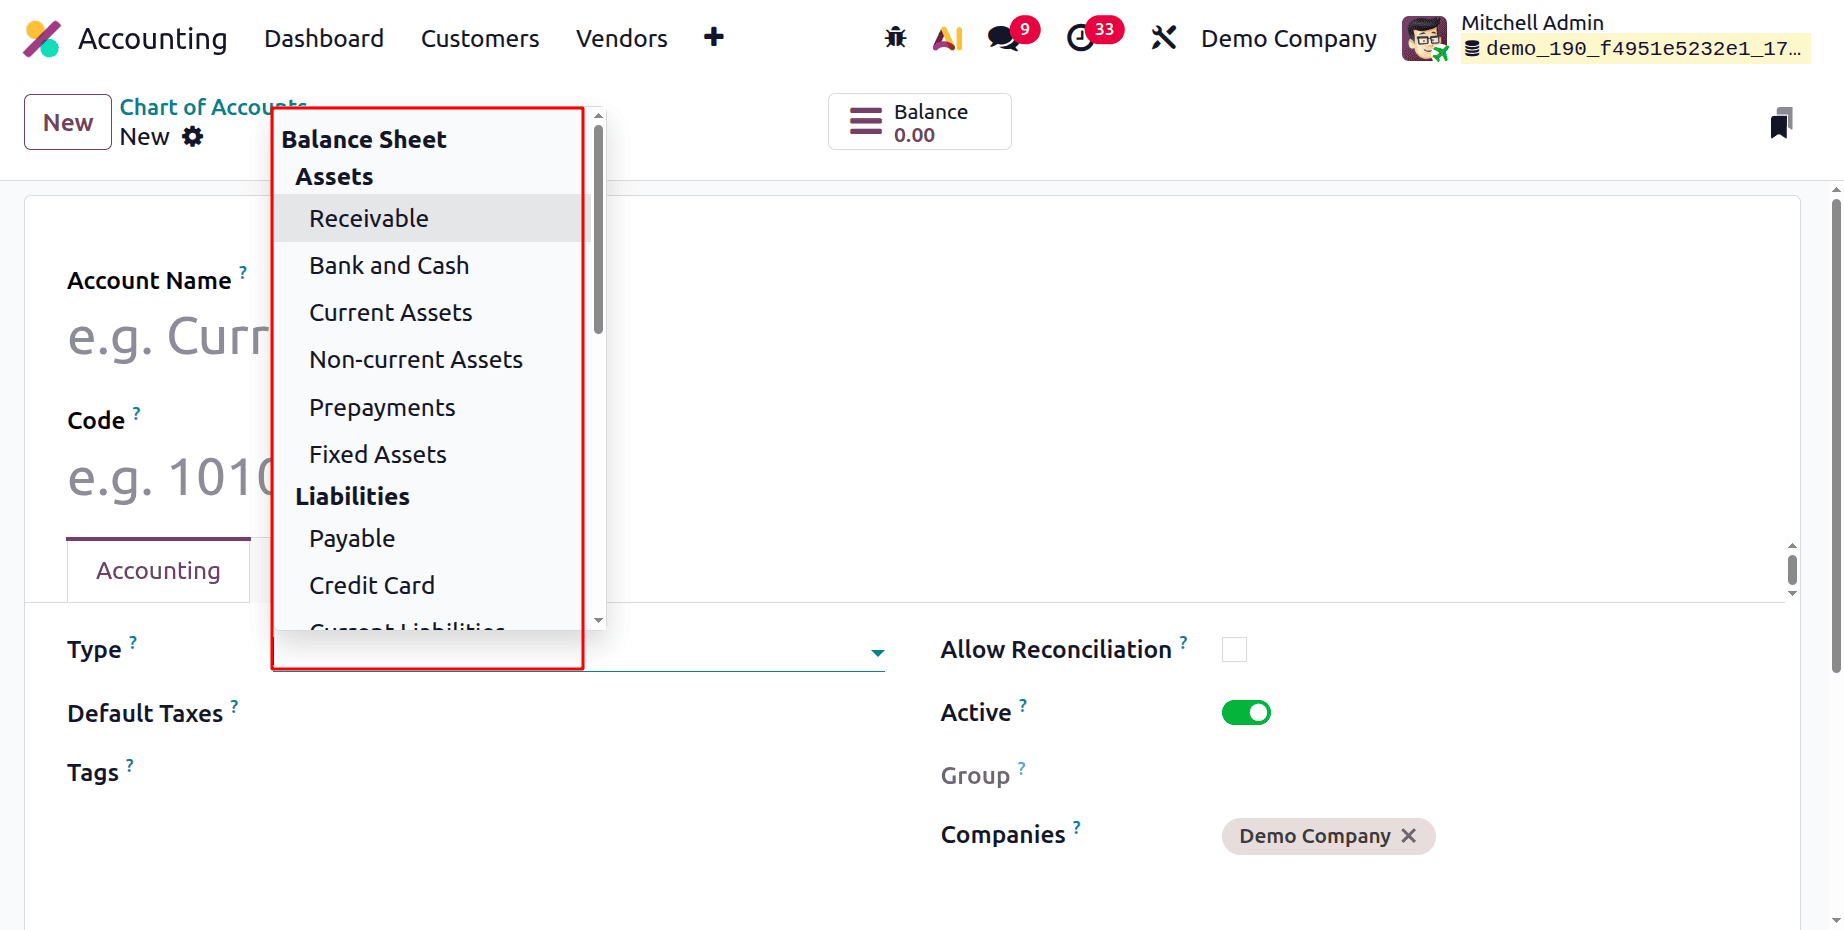
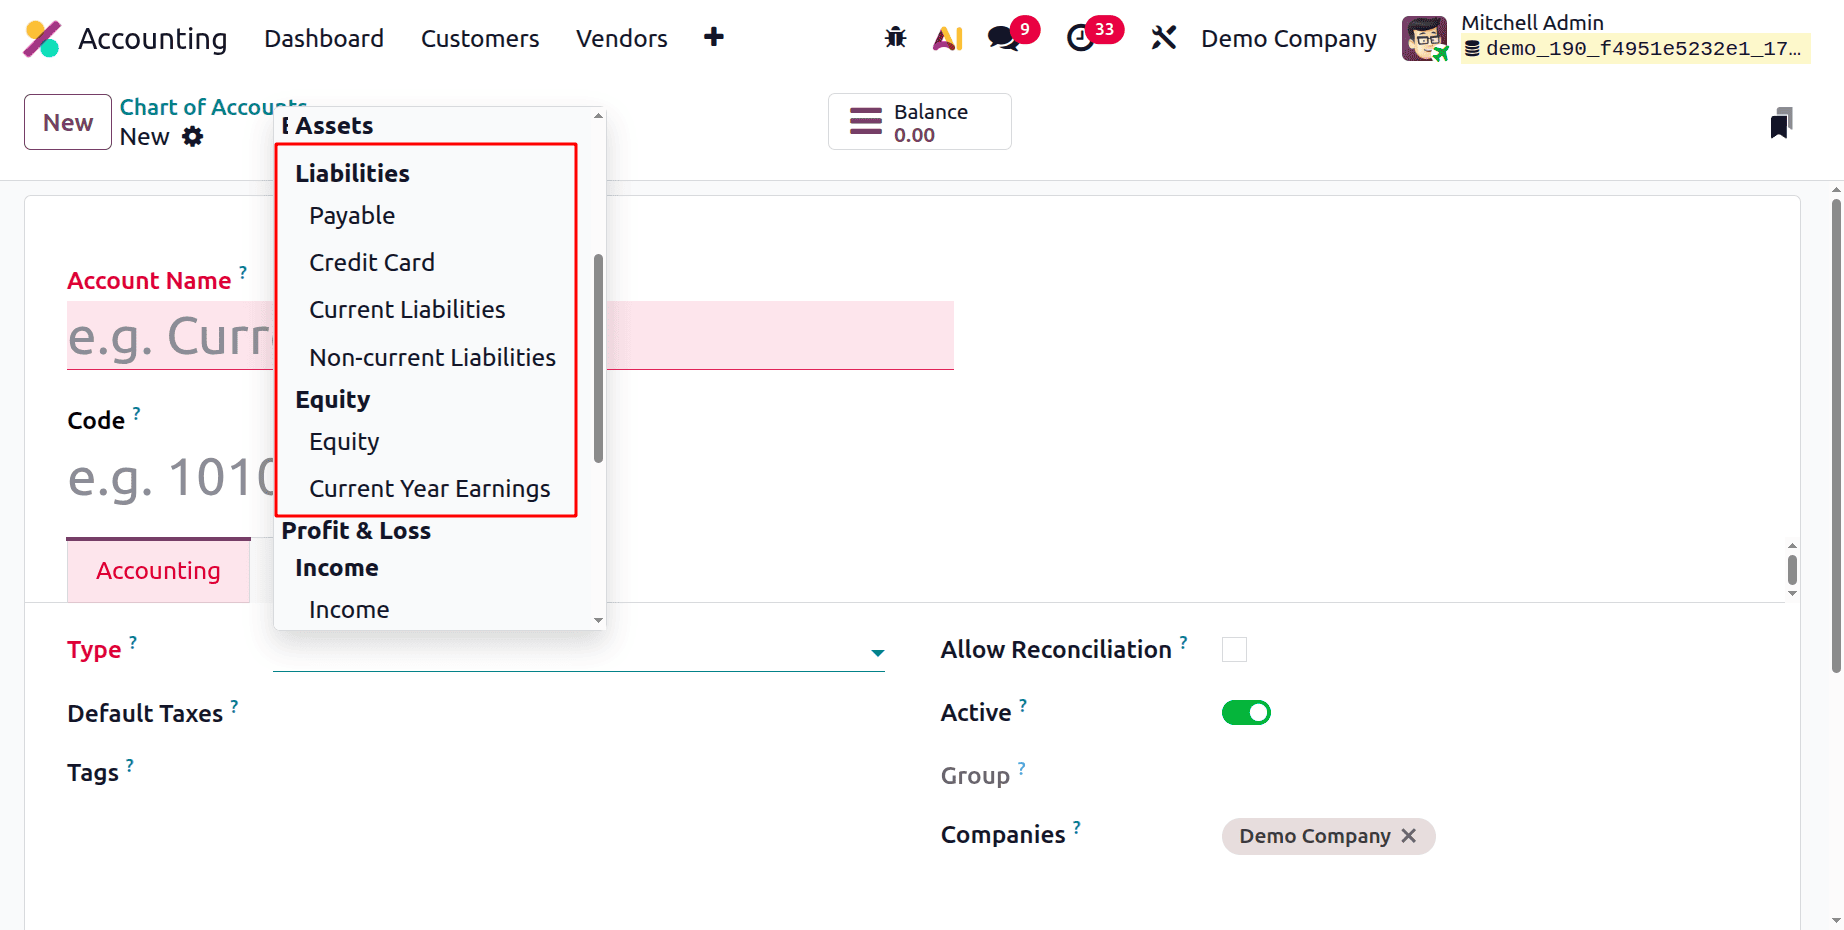
The Assets section of the account types chart lists Receivables, Bank and Cash, Current Assets, Non-Current Assets, Prepayments, and Fixed Assets. The Liabilities area includes credit card, current, non-current, and payable liabilities. Then under Equity, the accounts Equity and Current Year Earnings are available.
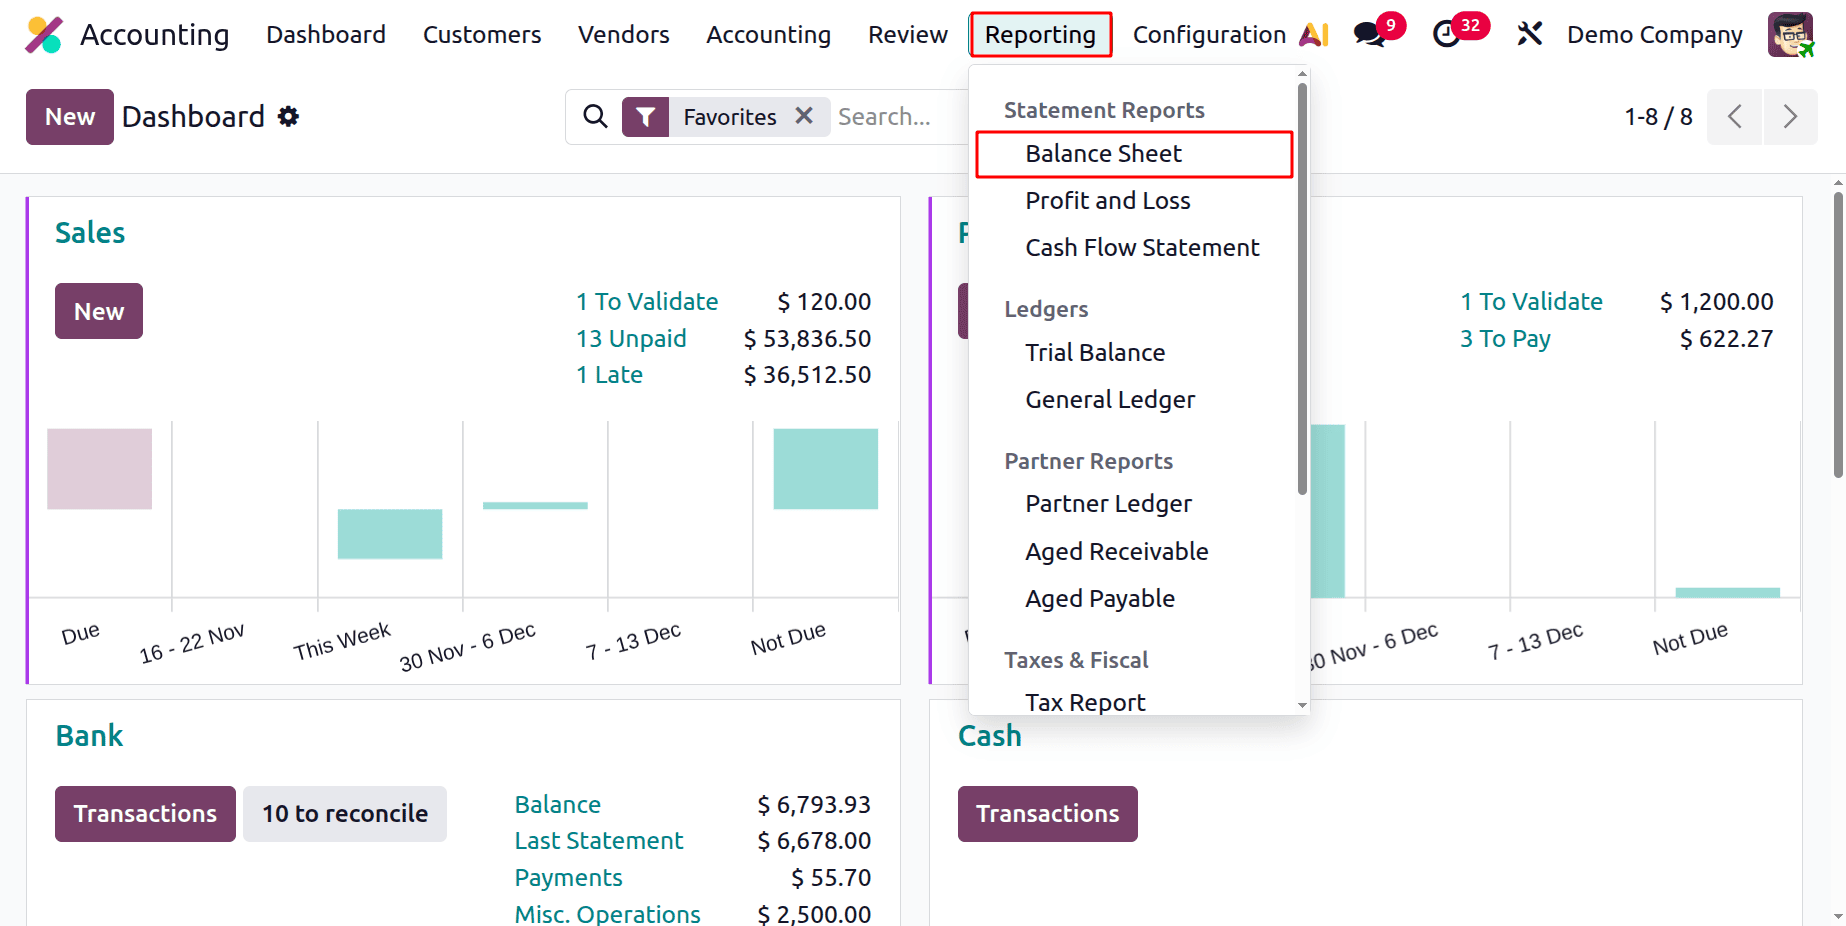
To get the Balance Sheet Report in Odoo 19, open the Accounting module. Then click on the Reporting menu and open the first report, which is the Balance Sheet Report.
Reporting > Balance Sheet
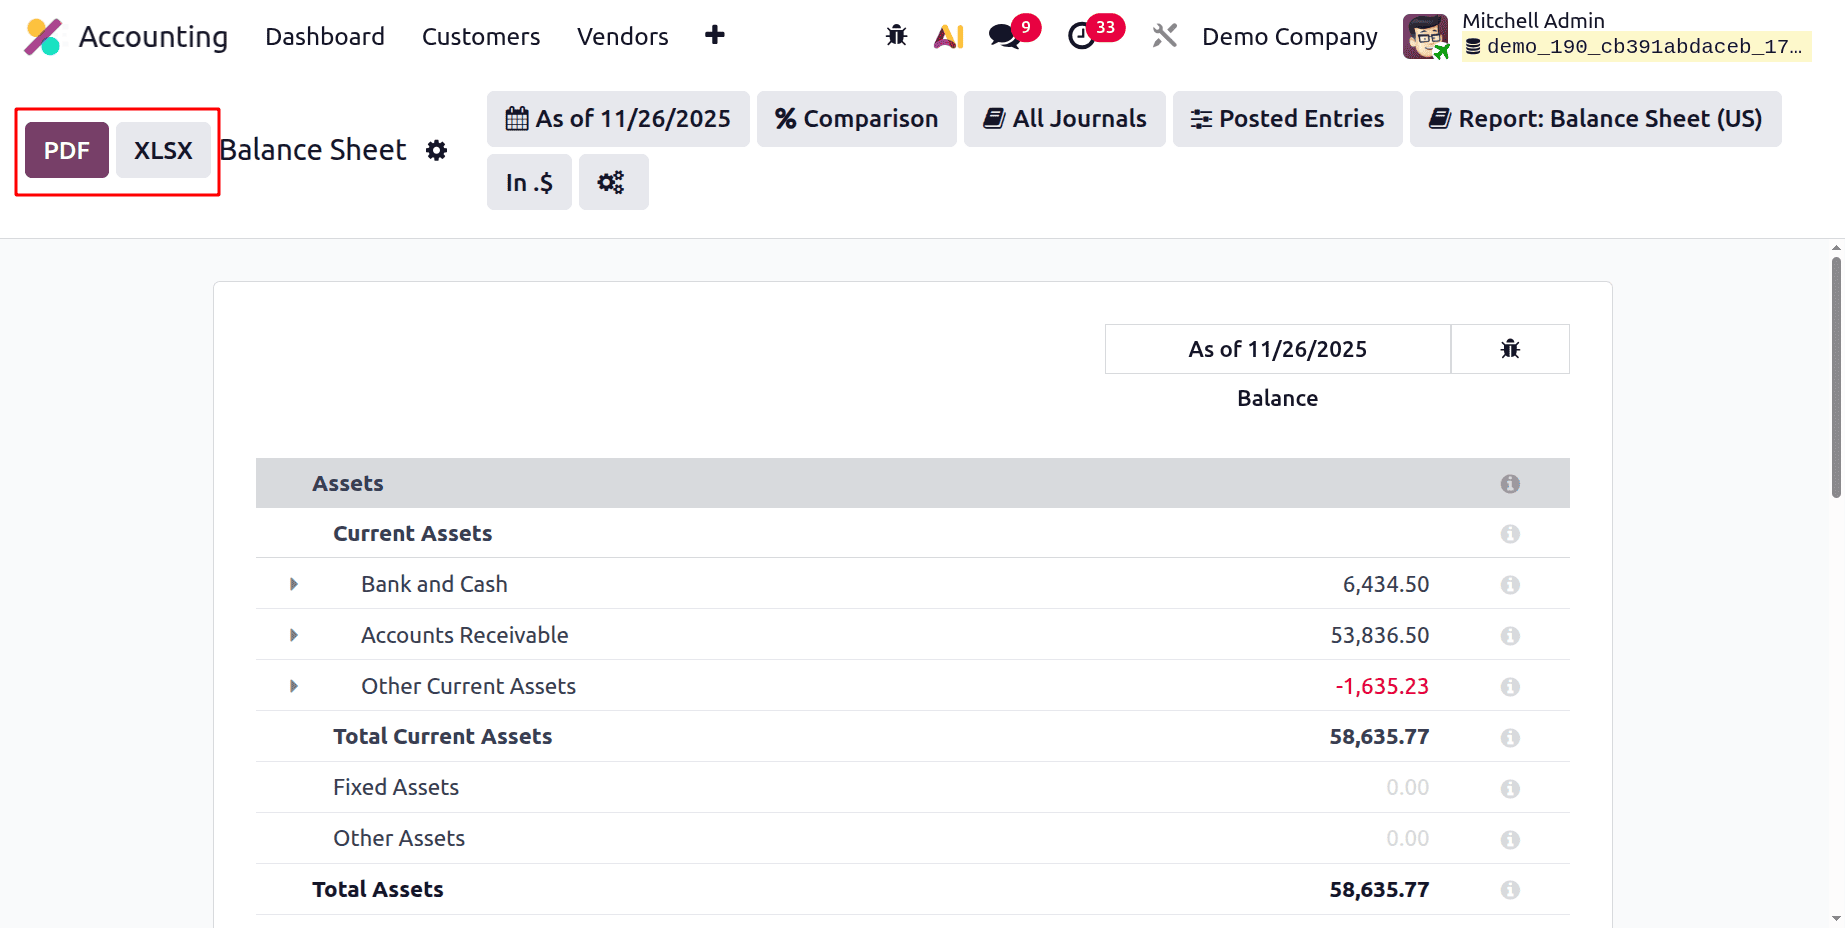
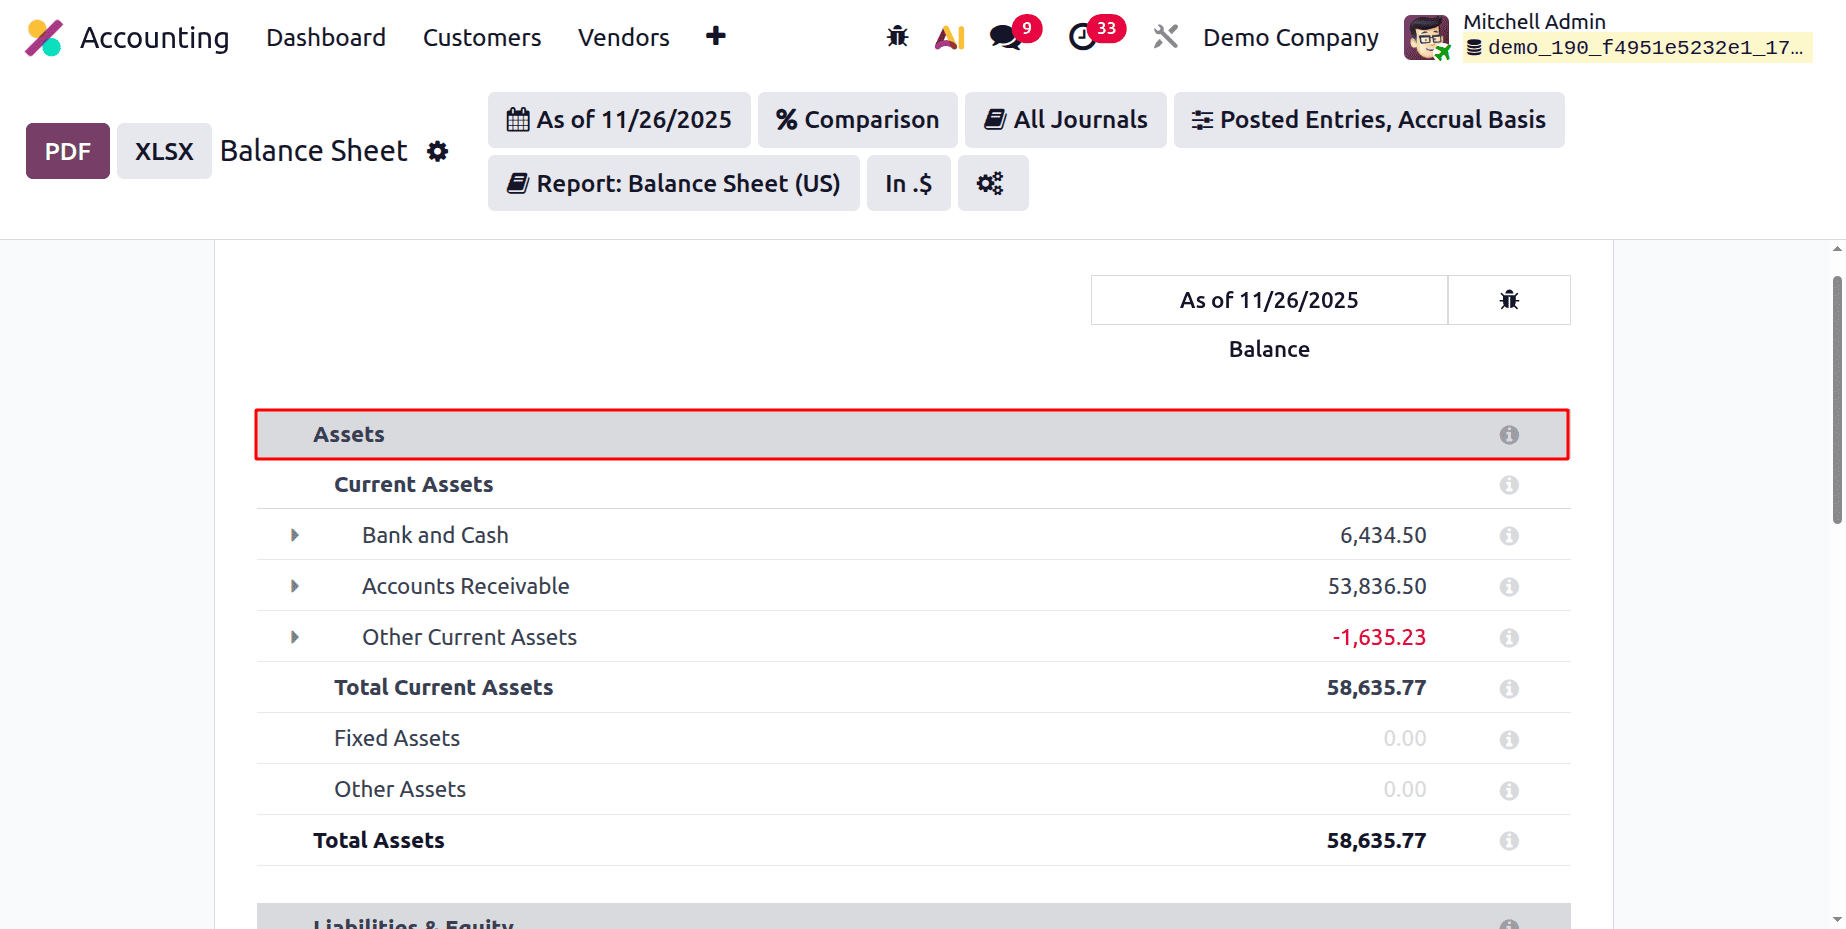
Here, the balance sheet report shows Assets, Liabilities, and Equity. Users can see Current Assets, Fixed Assets, and Other Assets under Assets.
Both PDF and XLSX versions of the balance sheet report are available for download. As seen below, these buttons are located in the screen's upper left corner. By selecting the choices icon, you can choose whether to export the report in PDF or XLSX format.
We can export the report by copying it to the Documents module.
Filters
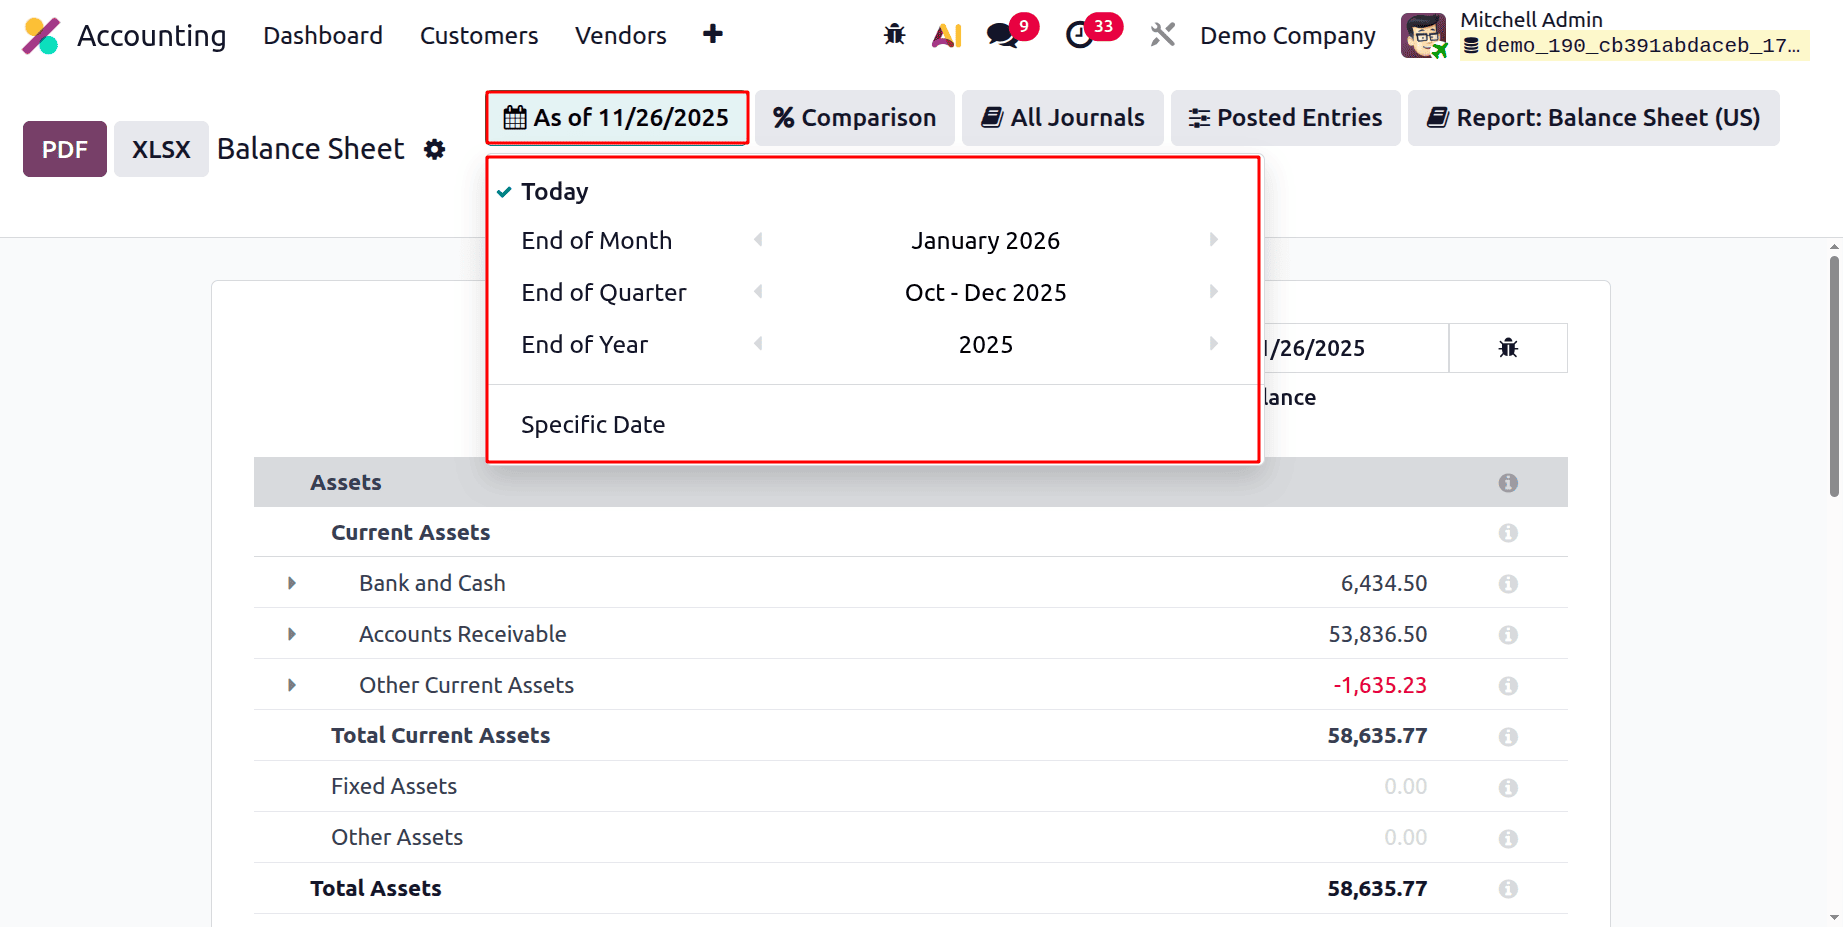
You can filter the report according to today, the end of the month, the end of the quarter, or the end of the year. Additionally, users have the option to base the balance sheet report on a certain date.
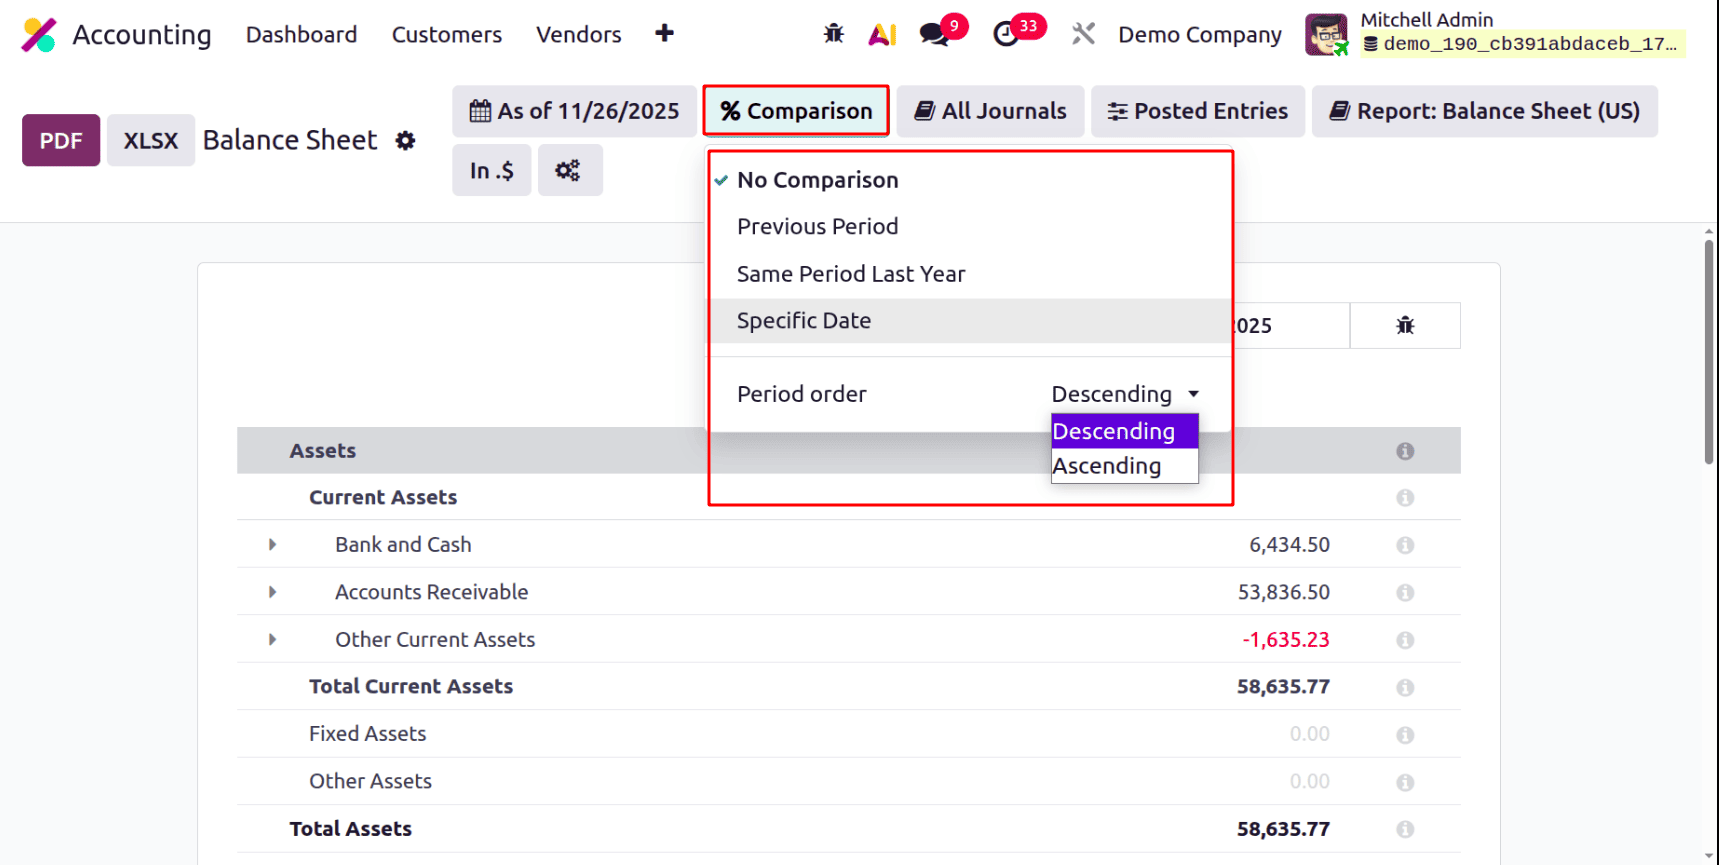
Options like No Comparison, Previous Period, Same Period Last Year, and Specific Date are available with the % Comparison option. One can select between an ascending or downward period order.
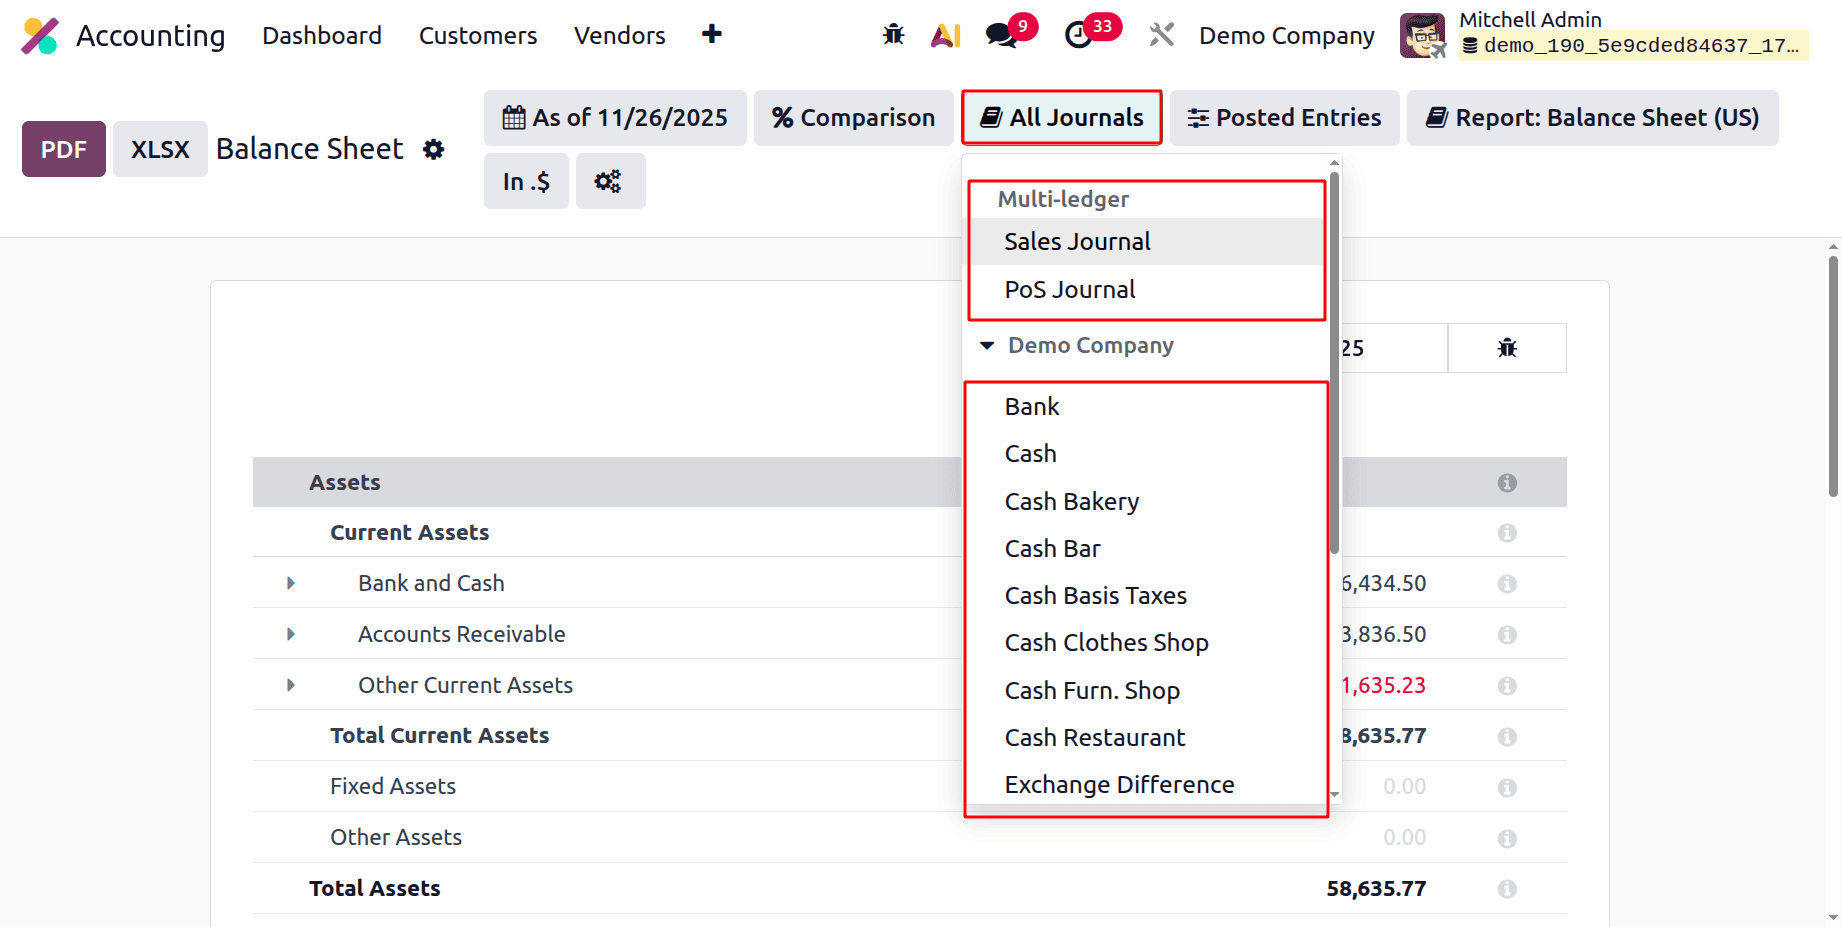
Next is All Journal Filters, by using this, the users can filter the resorts based on Journals. While choosing that filter, the users can view the Journal Groups and the Journals.
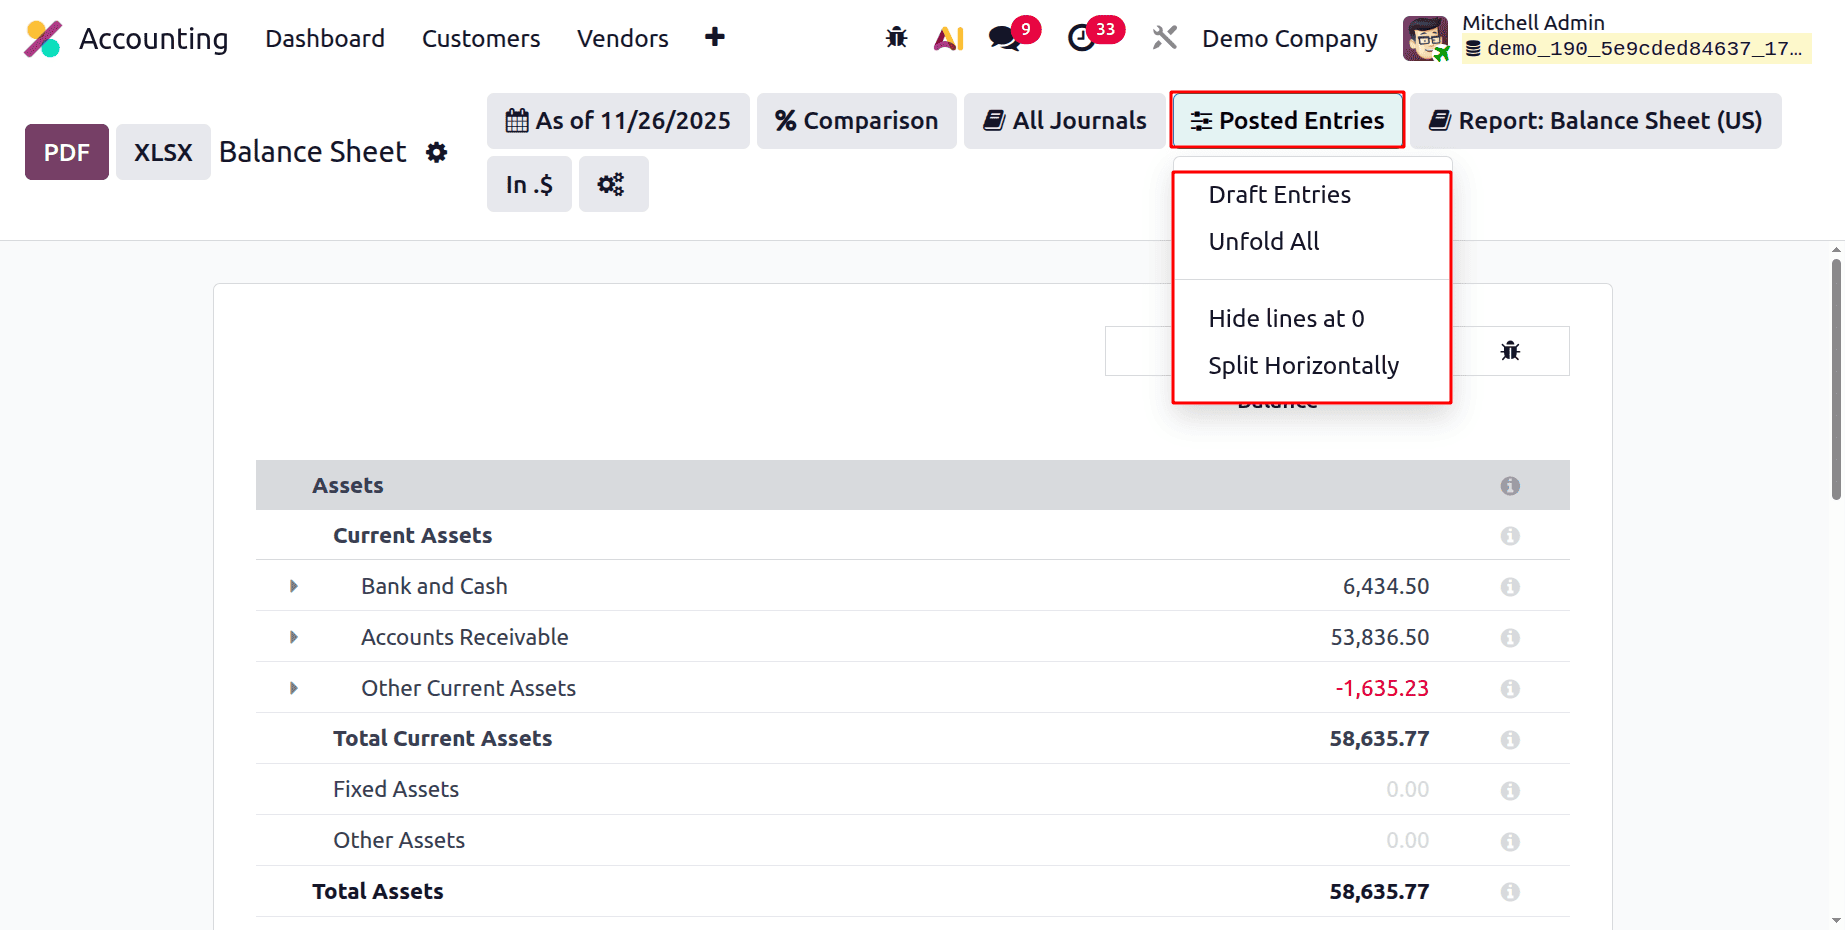
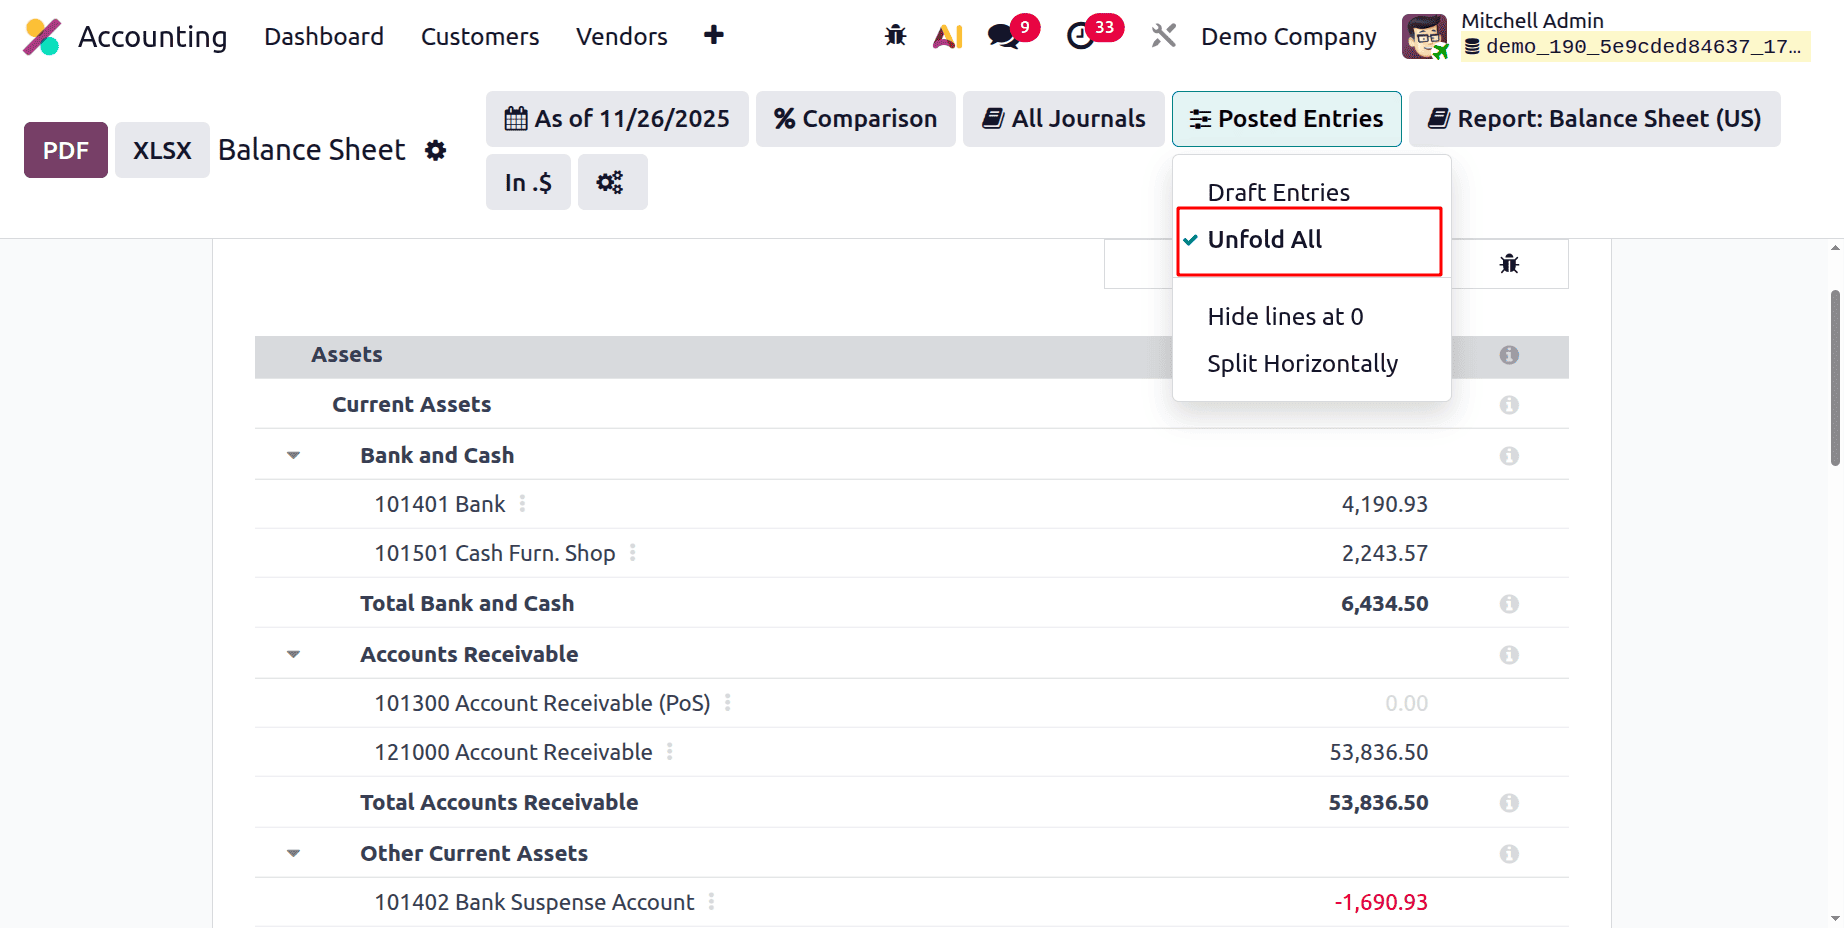
While clicking on the Posted Entries, the users can view 4 options. Draft Entries, Unfold All, Hide lines at 0, and Split Horizontally.
If the Draft Entries are enabled, then all the draft entry values can be viewed inside the balance sheet report. If the Unfold All is selected, then all the account entries will unfold as shown below.
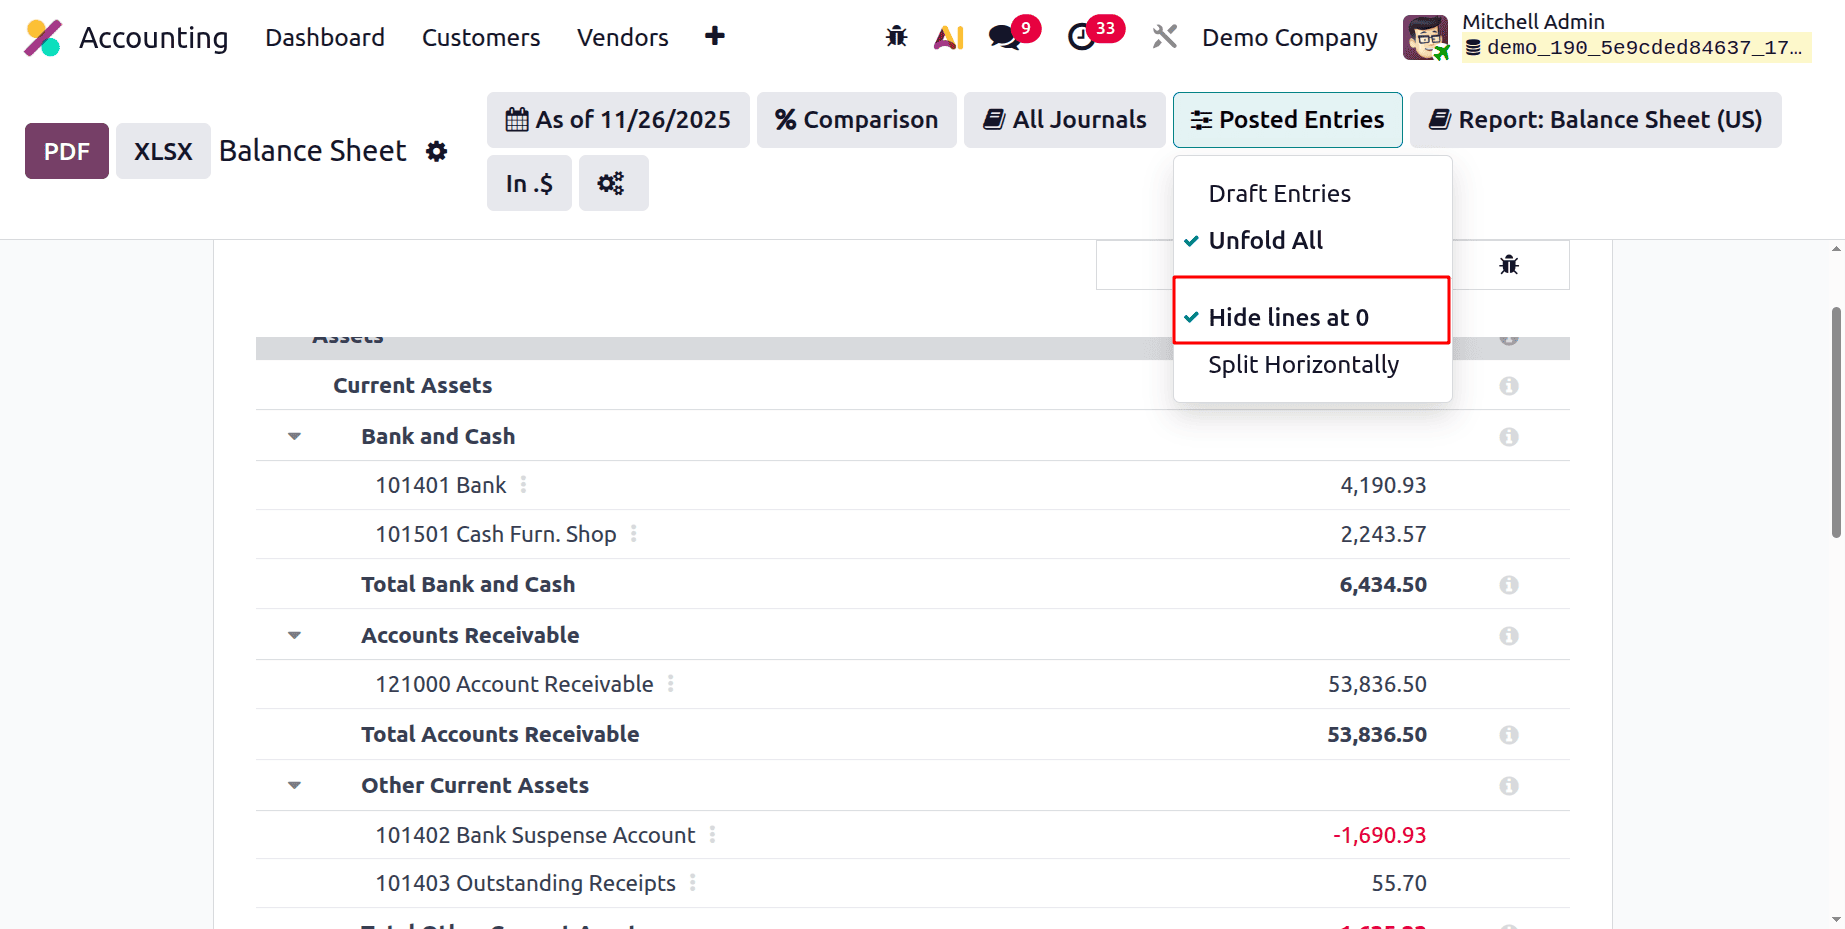
While checking the above image, the Accounts Receivable (POS) account has no value. Let's enable the Hide lines at 0; the same Account is showing as in the image below. All lines with zero values will be hidden by the filter Hide lines at 0.
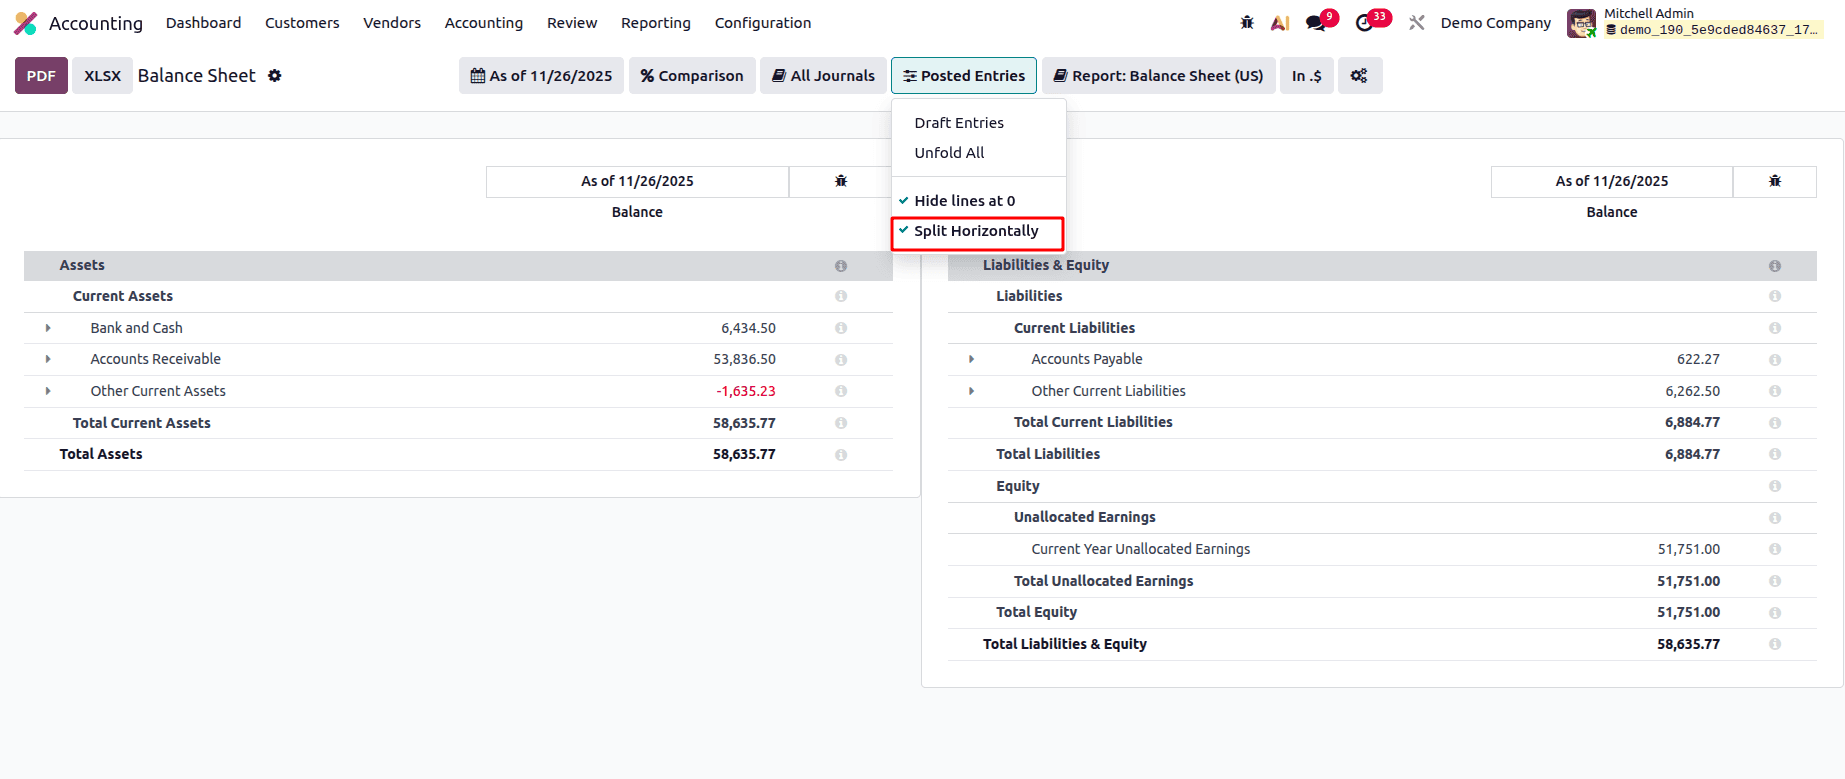
If the filter Split Horizontally is enabled, then the balance sheet report splits into two, as shown below.
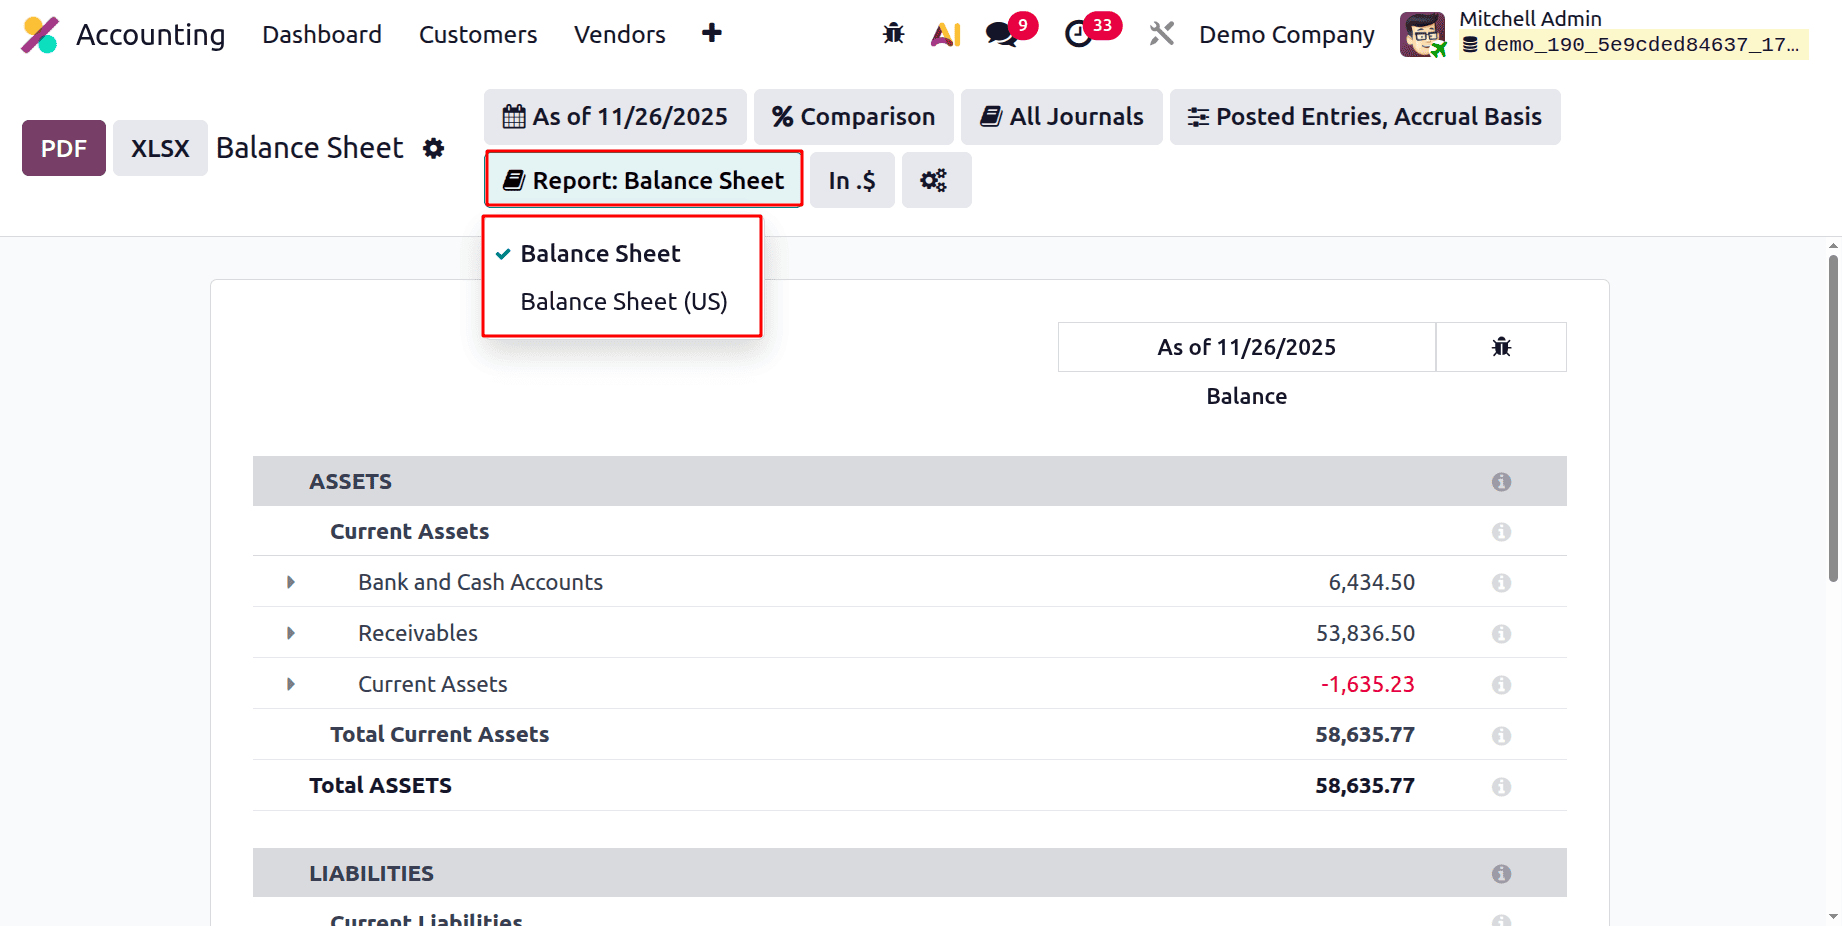
Next filter is Report: Balance Sheet. There are two options, one is Balance Sheet and the second one is Balance Sheet (US).
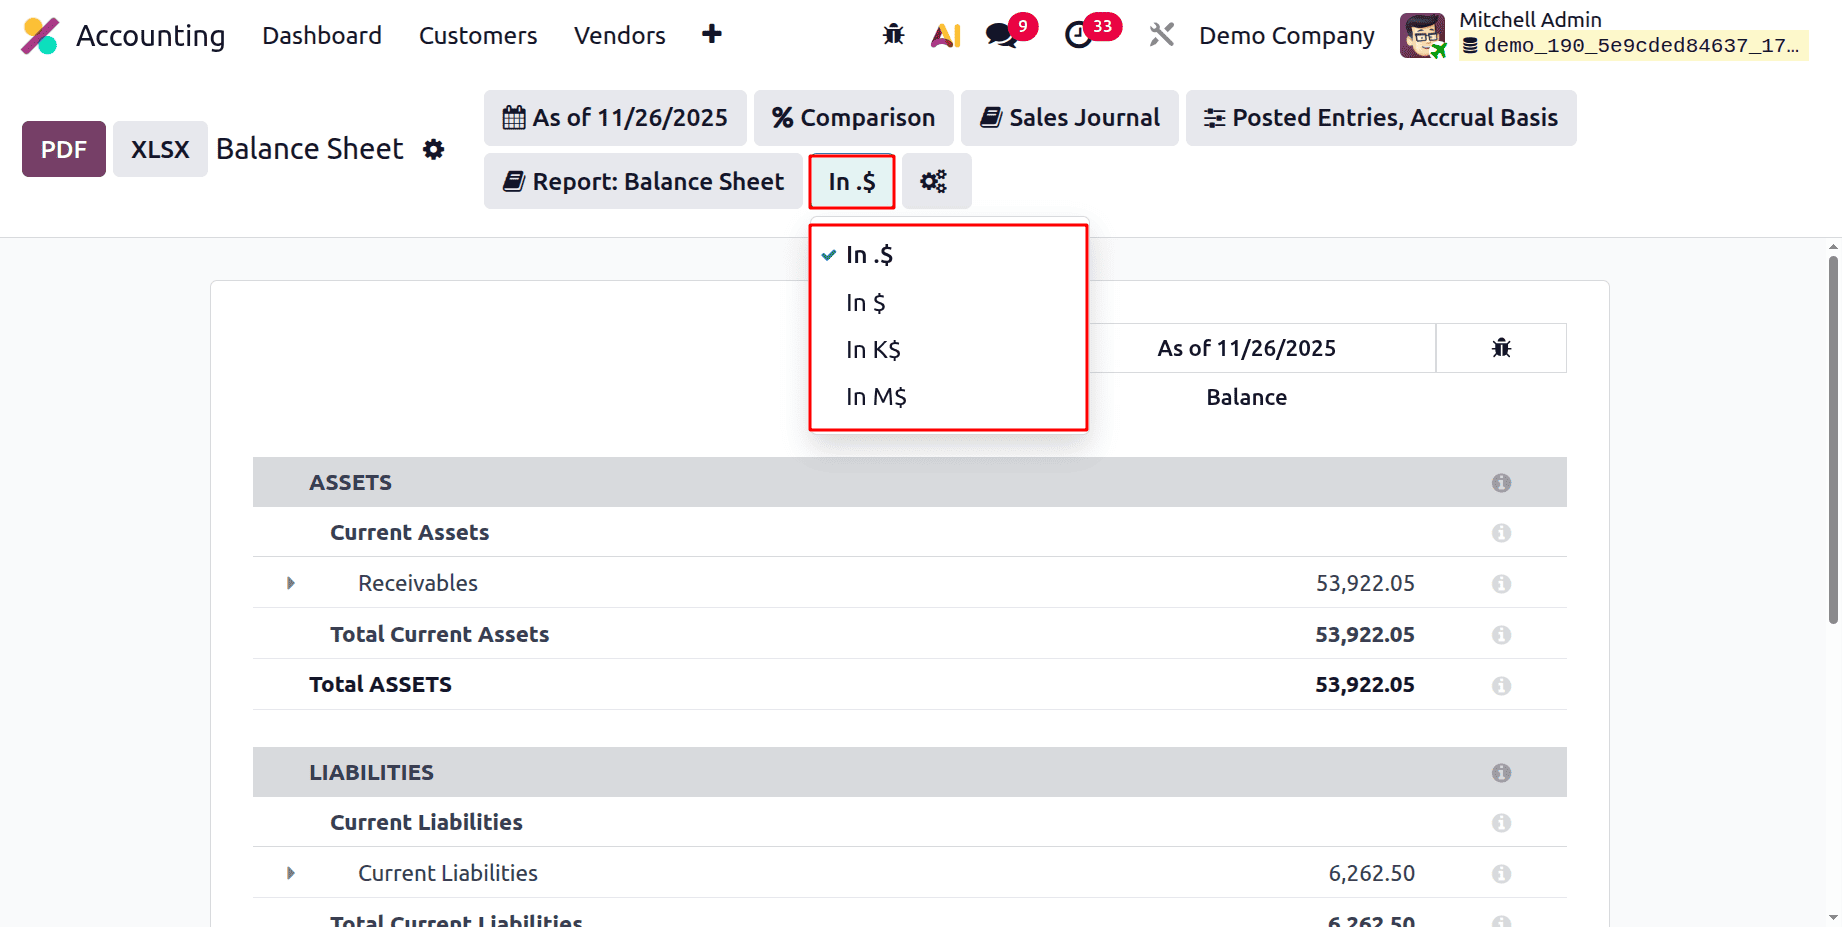
The filter based on currency formats comes next. The quantity can be shown in a number of ways.
In.$, the amount is displayed in the report with two decimal places.
The amount is displayed as an integer In $.
The sum is displayed as thousands In K$.
The amount is displayed in millions of dollars in In M$.
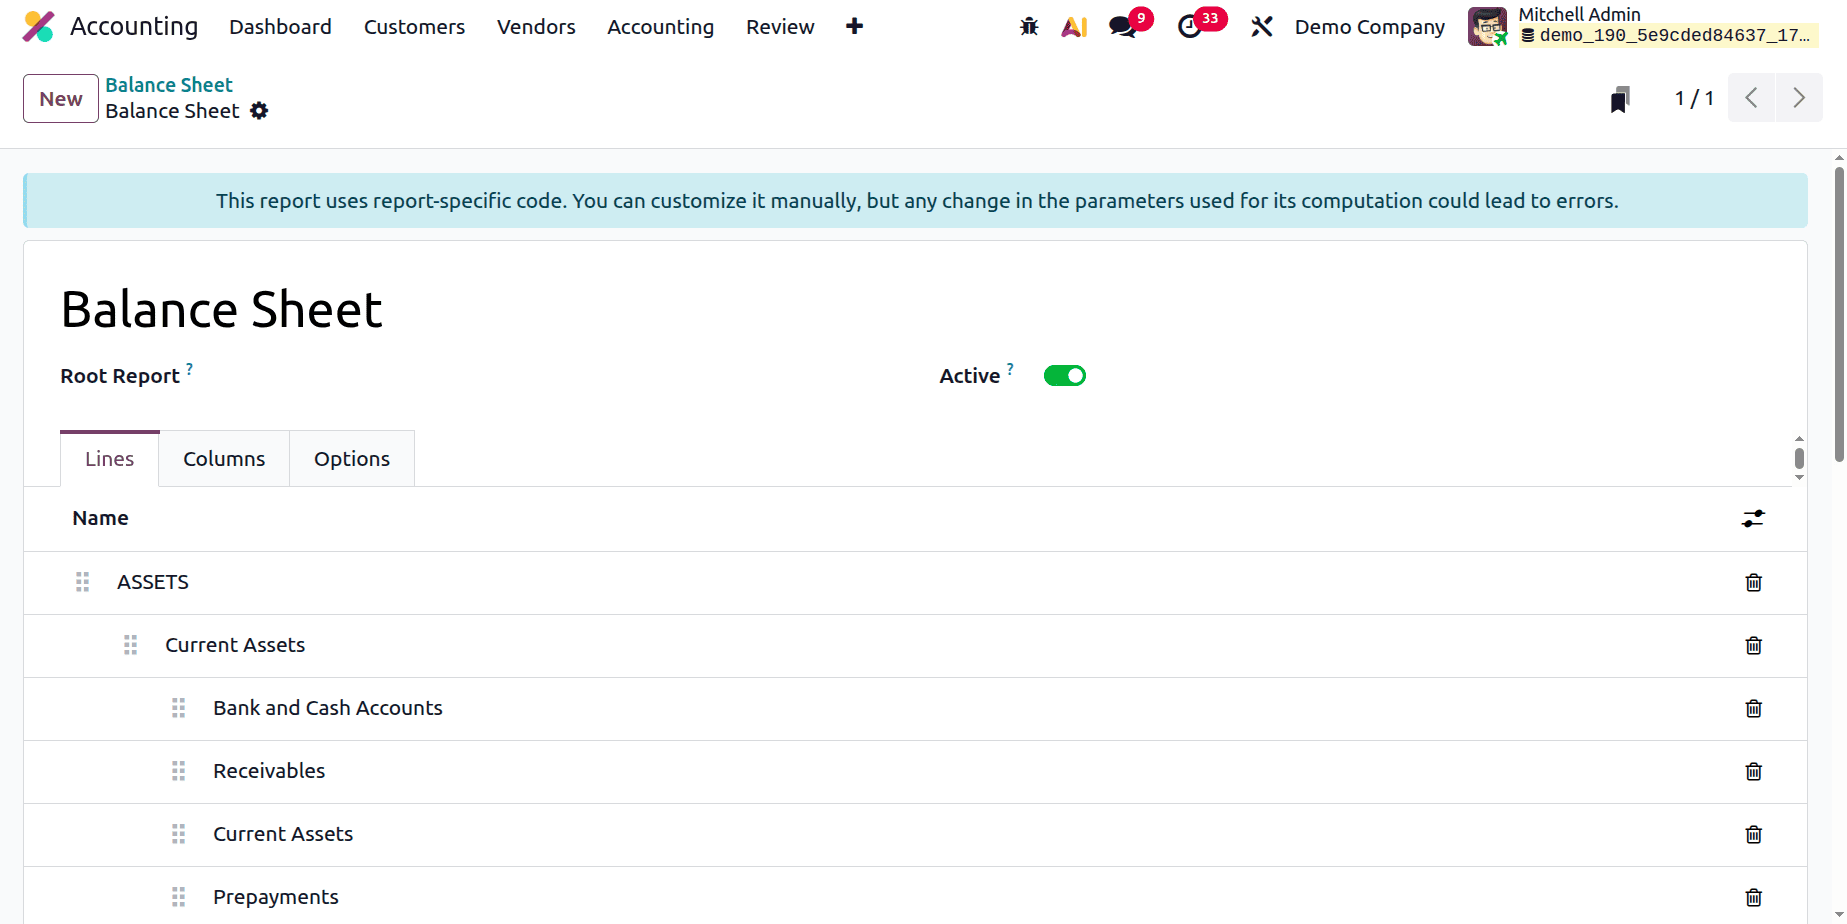
And the last one icon, click on it, which will lead to Accounting Reports.
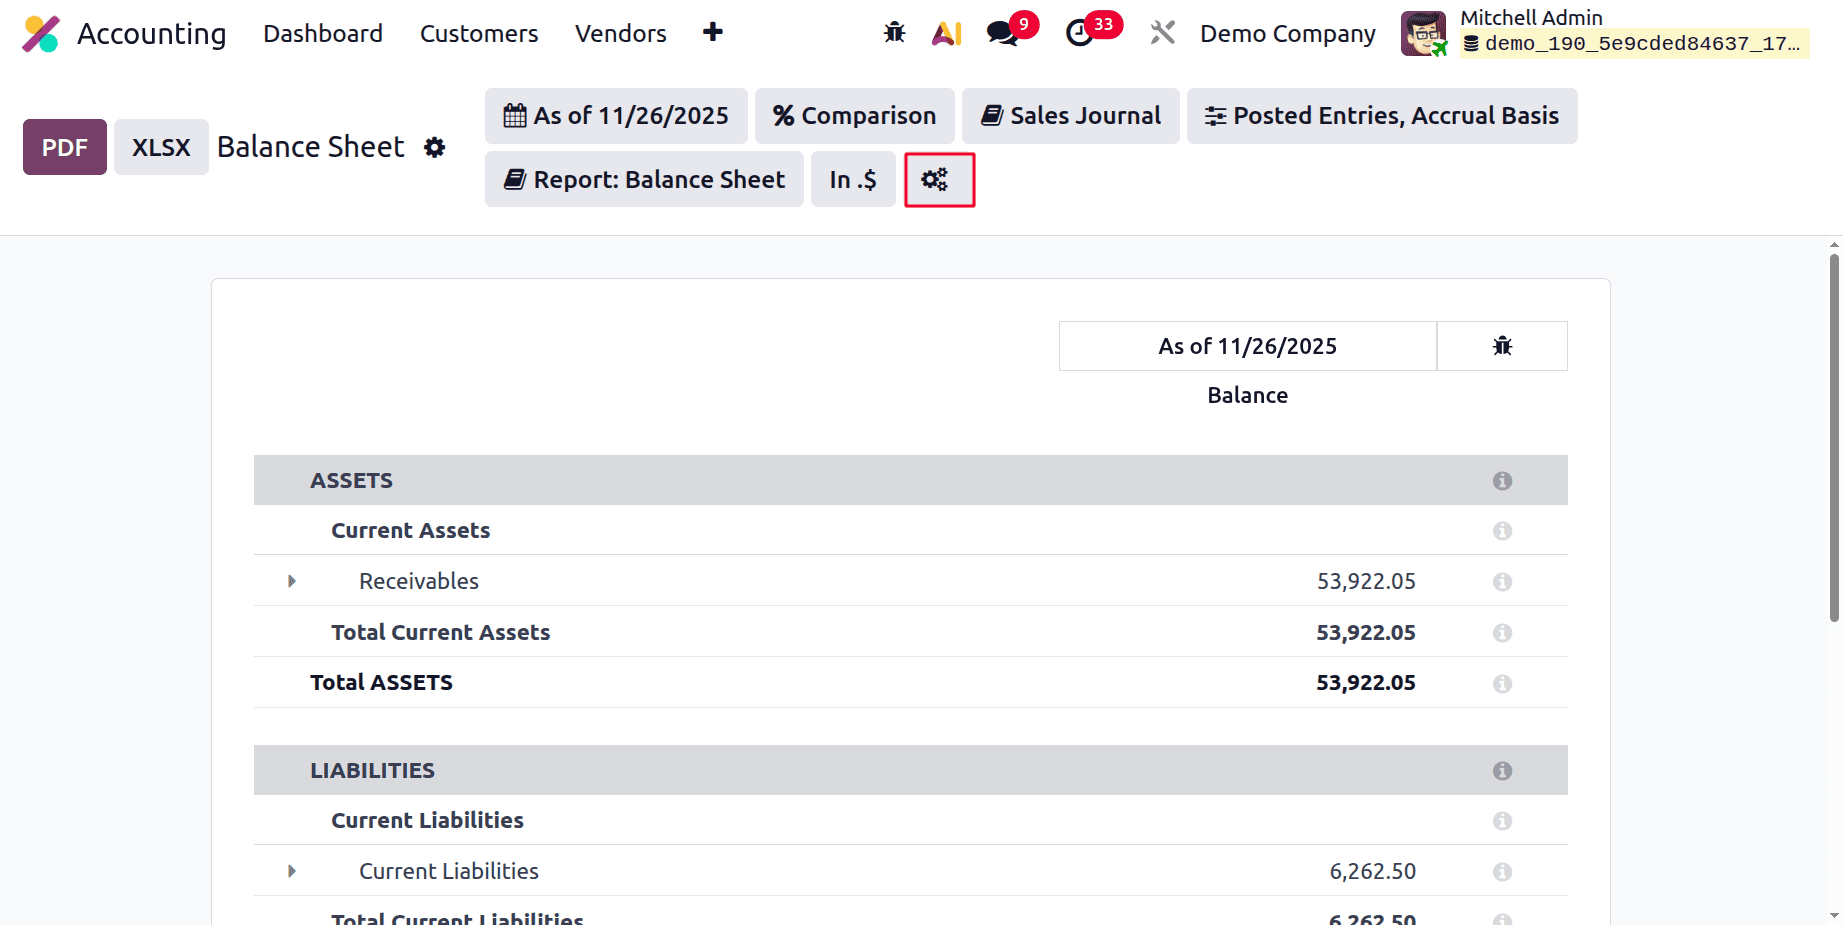
From there, the users can customize the balance sheet report as shown below.
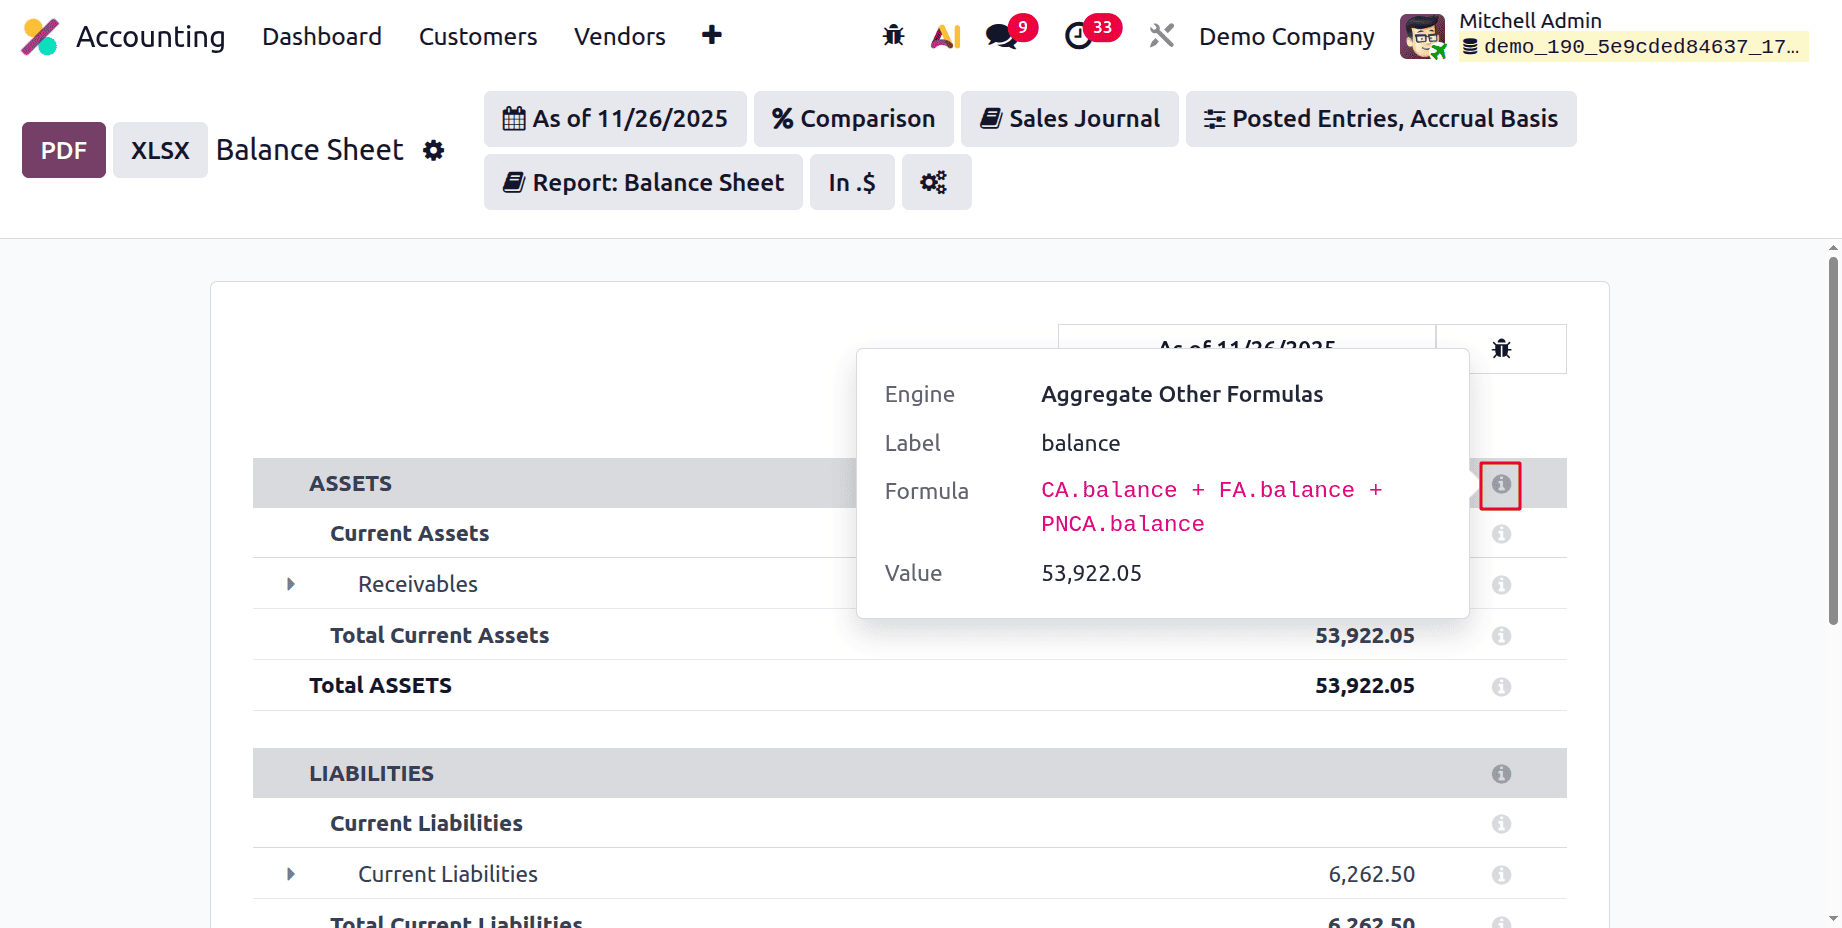
When the "i" indicator on a line is clicked, some metadata, such as the calculation formula, is displayed.
Let's look at the balance sheet report
An asset is everything that a company owns that has monetary value and the potential to generate future profits. They are separated again into assets that are in use and those that are not.
Current Assets: These assets are expected to be sold, converted into cash, or depleted within a year or during the course of a normal business cycle.
Resources that offer financial advantages to a company for a duration longer than a year are referred to as Non-Current Assets.
A fixed asset is a long-term tangible resource, such as buildings, vehicles, or machinery, that a company owns and uses to make money.
It is anticipated to yield financial gains for multiple reporting periods and is not meant for resale. It is shown on the balance sheet at cost and gradually decreased through depreciation.
While enabling the Developer Mode, users can view the Formula to calculate the values.
Assets can be calculated as the sum of current assets, fixed assets, and other assets.
Asset = (CA.balance + FA.balance + OA.balance)
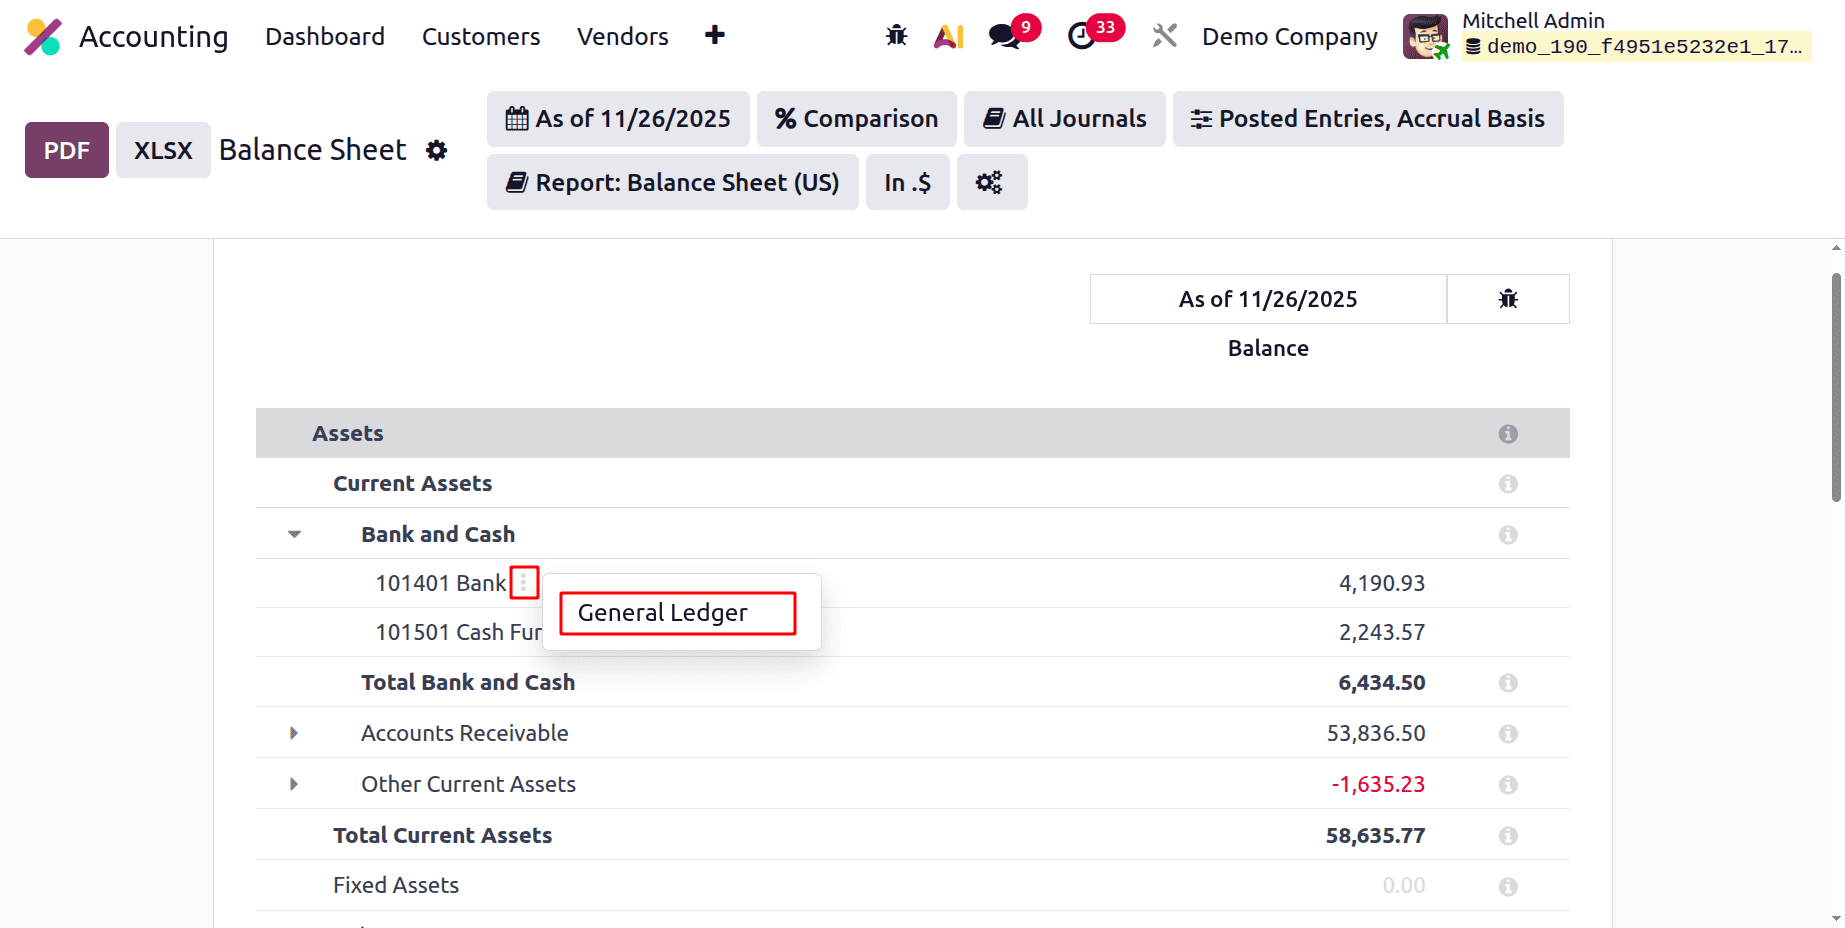
Under the Current Assets section, the entries added to the Bank and Cash, Account Receivable, and Other Current Asset accounts are included. While clicking on the 3 dots, the General Ledger can be opened.
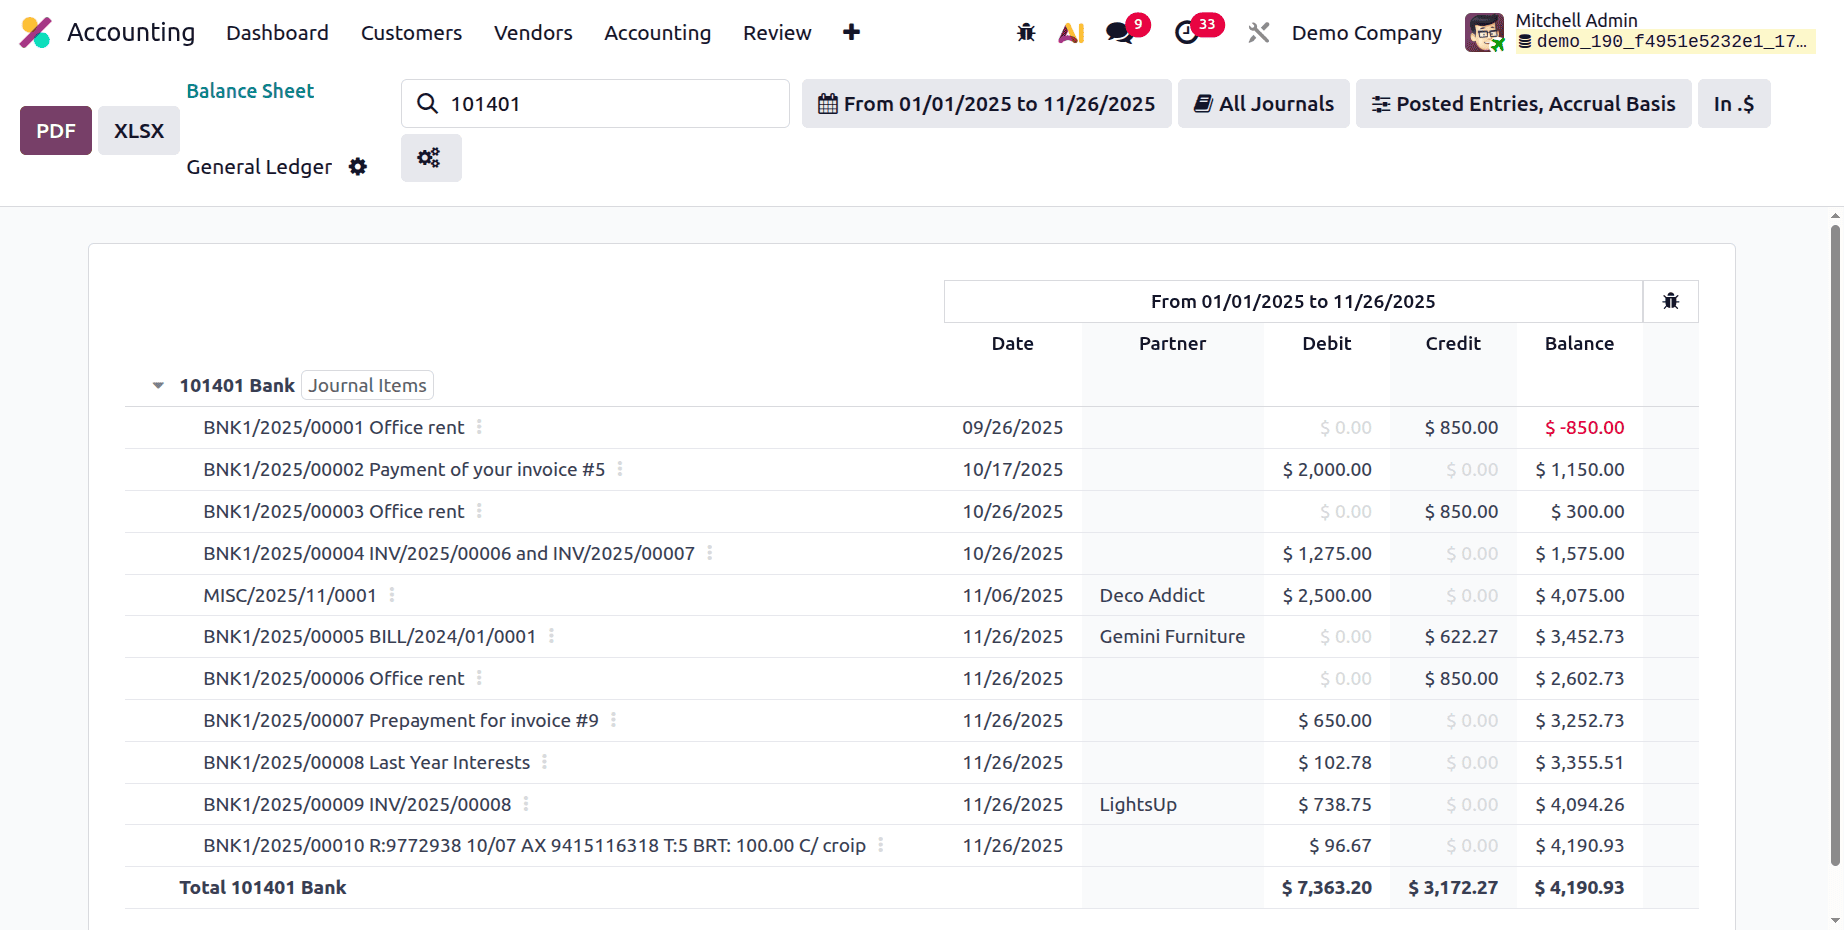
While clicking on the General Ledger which will open the General Ledger report for the Bank account.
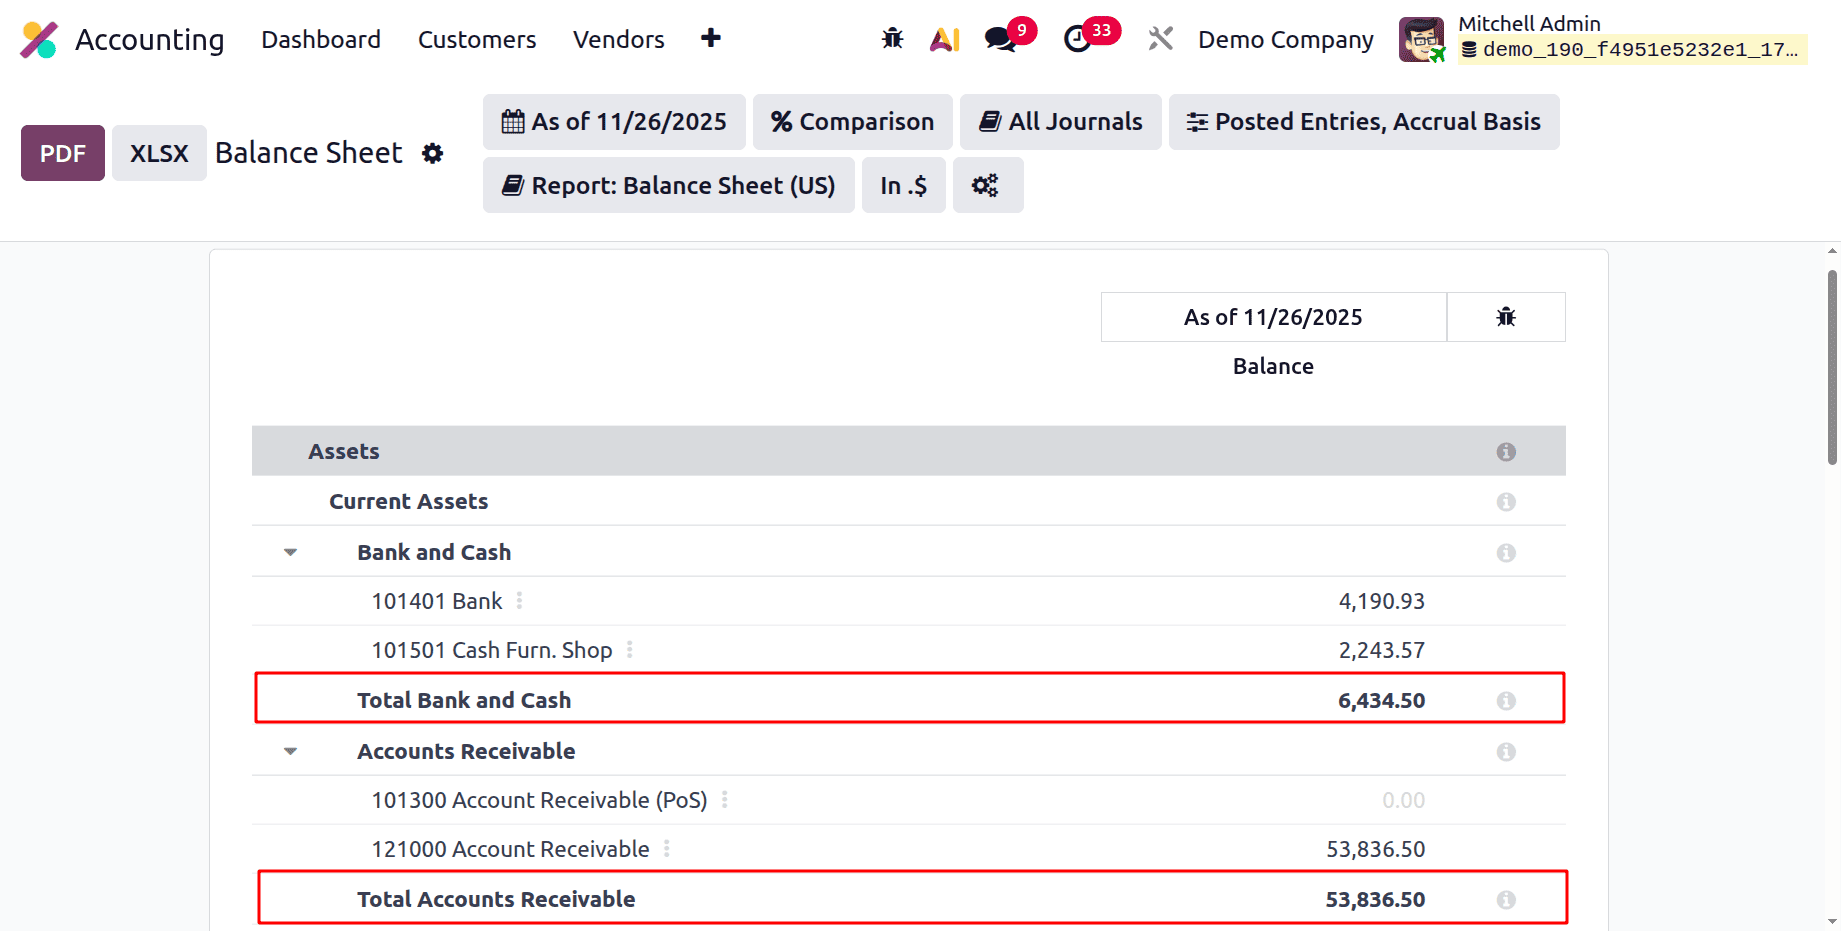
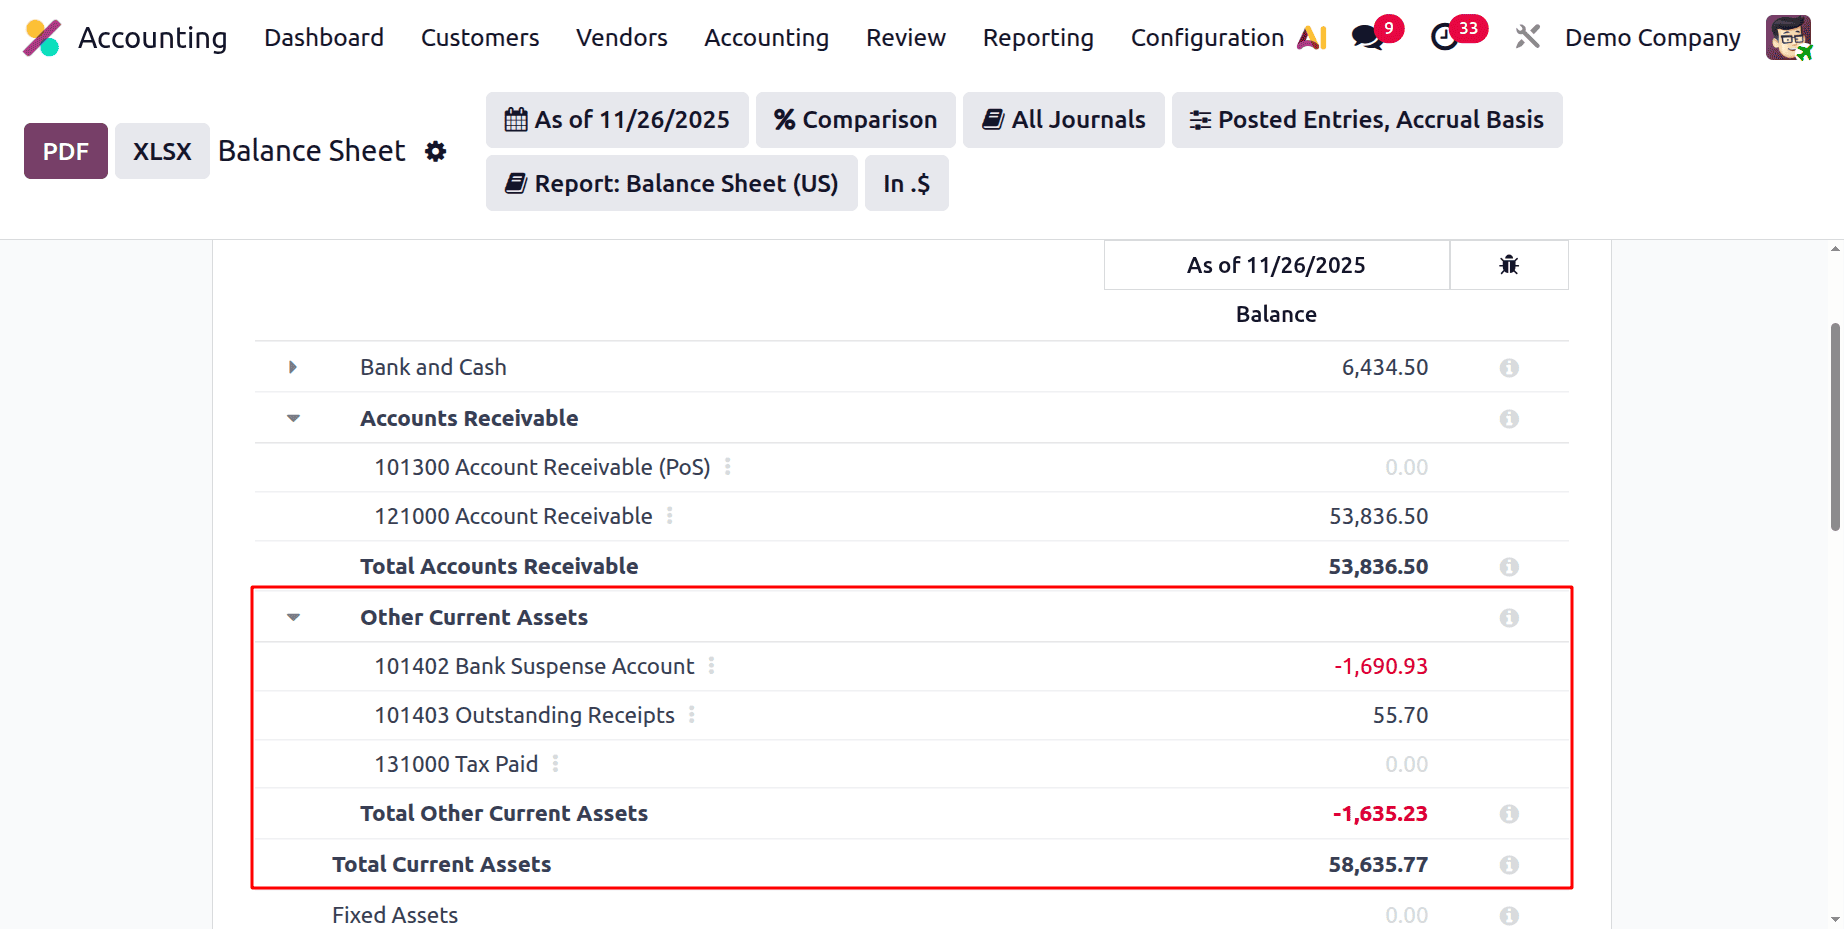
The total of all accounts is shown under each section. The total of Bank and Cash accounts and the Total of accounts Receivable are shown as marked below.
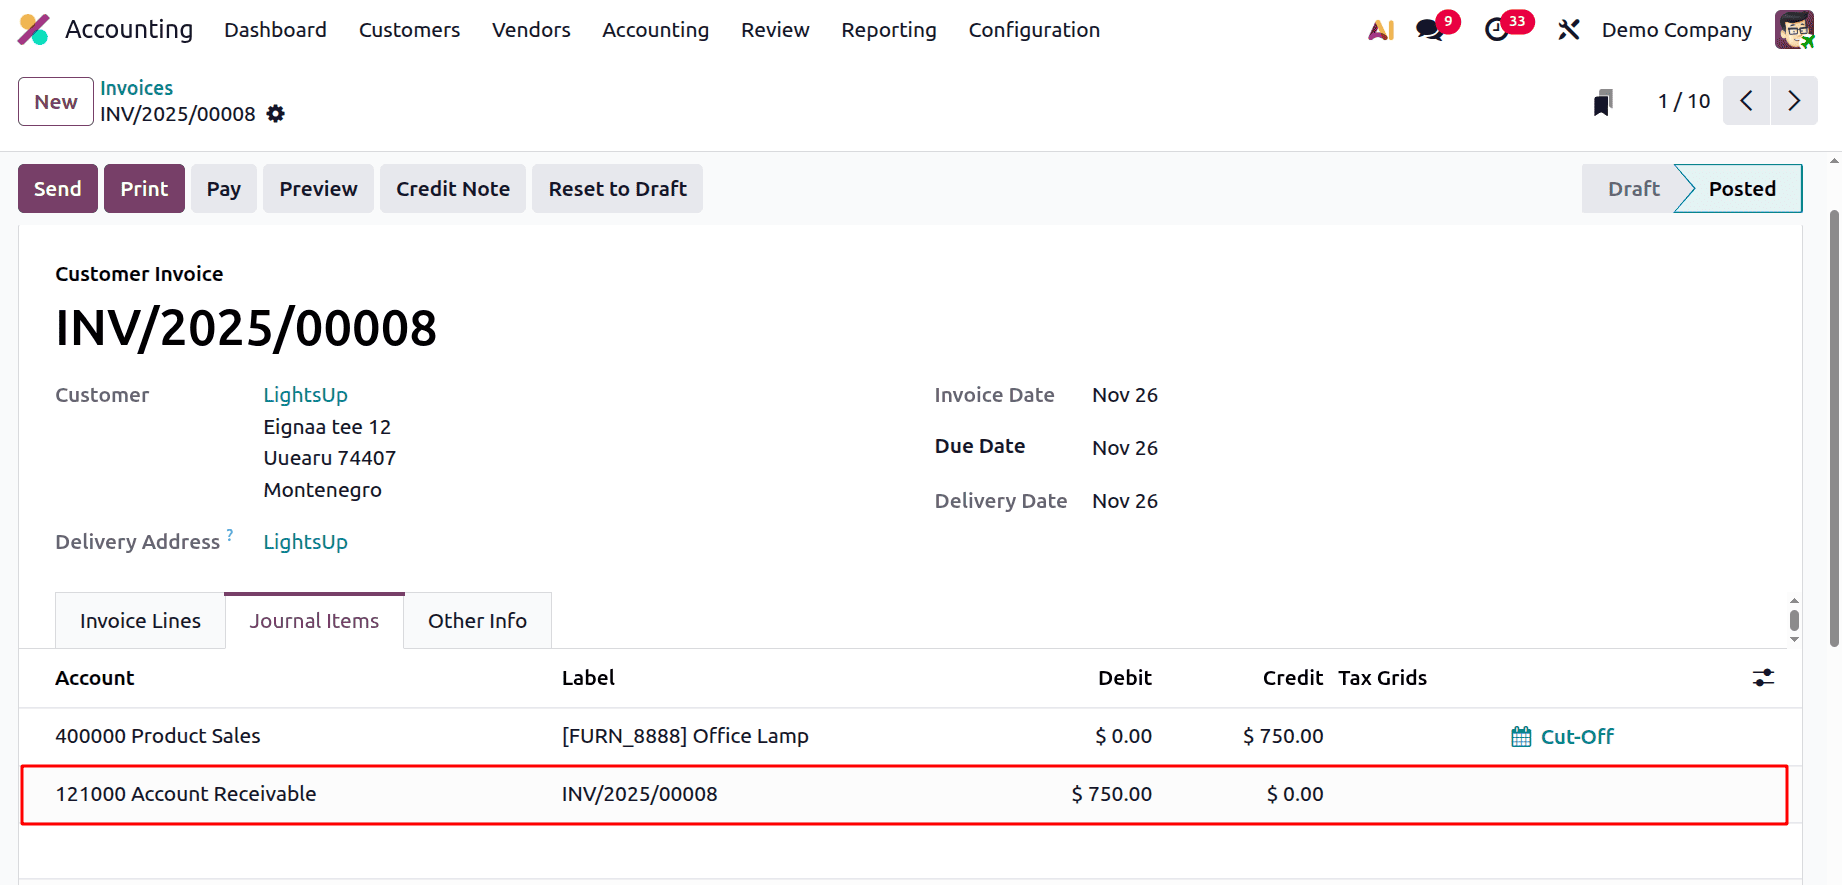
The account Receivable will be shown inside the Invoice, and the amount will be shown inside the balance sheet under the Account Receivable.
Under this, the Other Current Asset section included accounts Bank Suspense Account, Outstanding Receipt Account, and Tax Paid accounts.
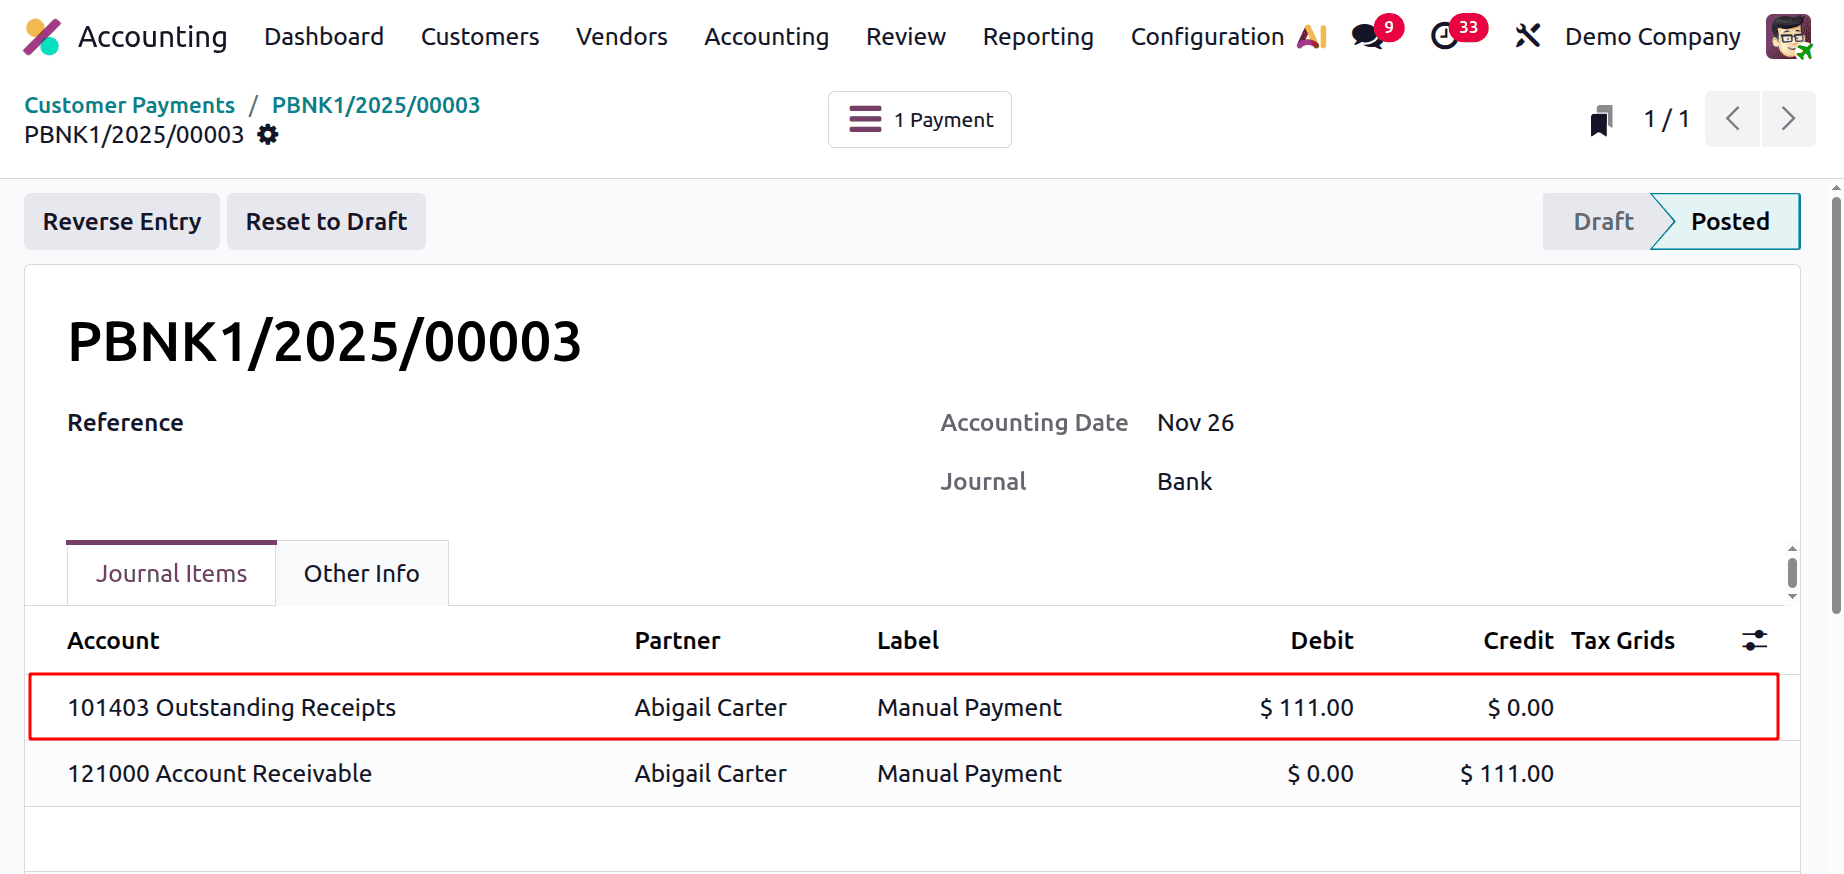
The customer payment will be added to the Outstanding Receipt account. And the amount will be updated inside the Balance Sheet report.
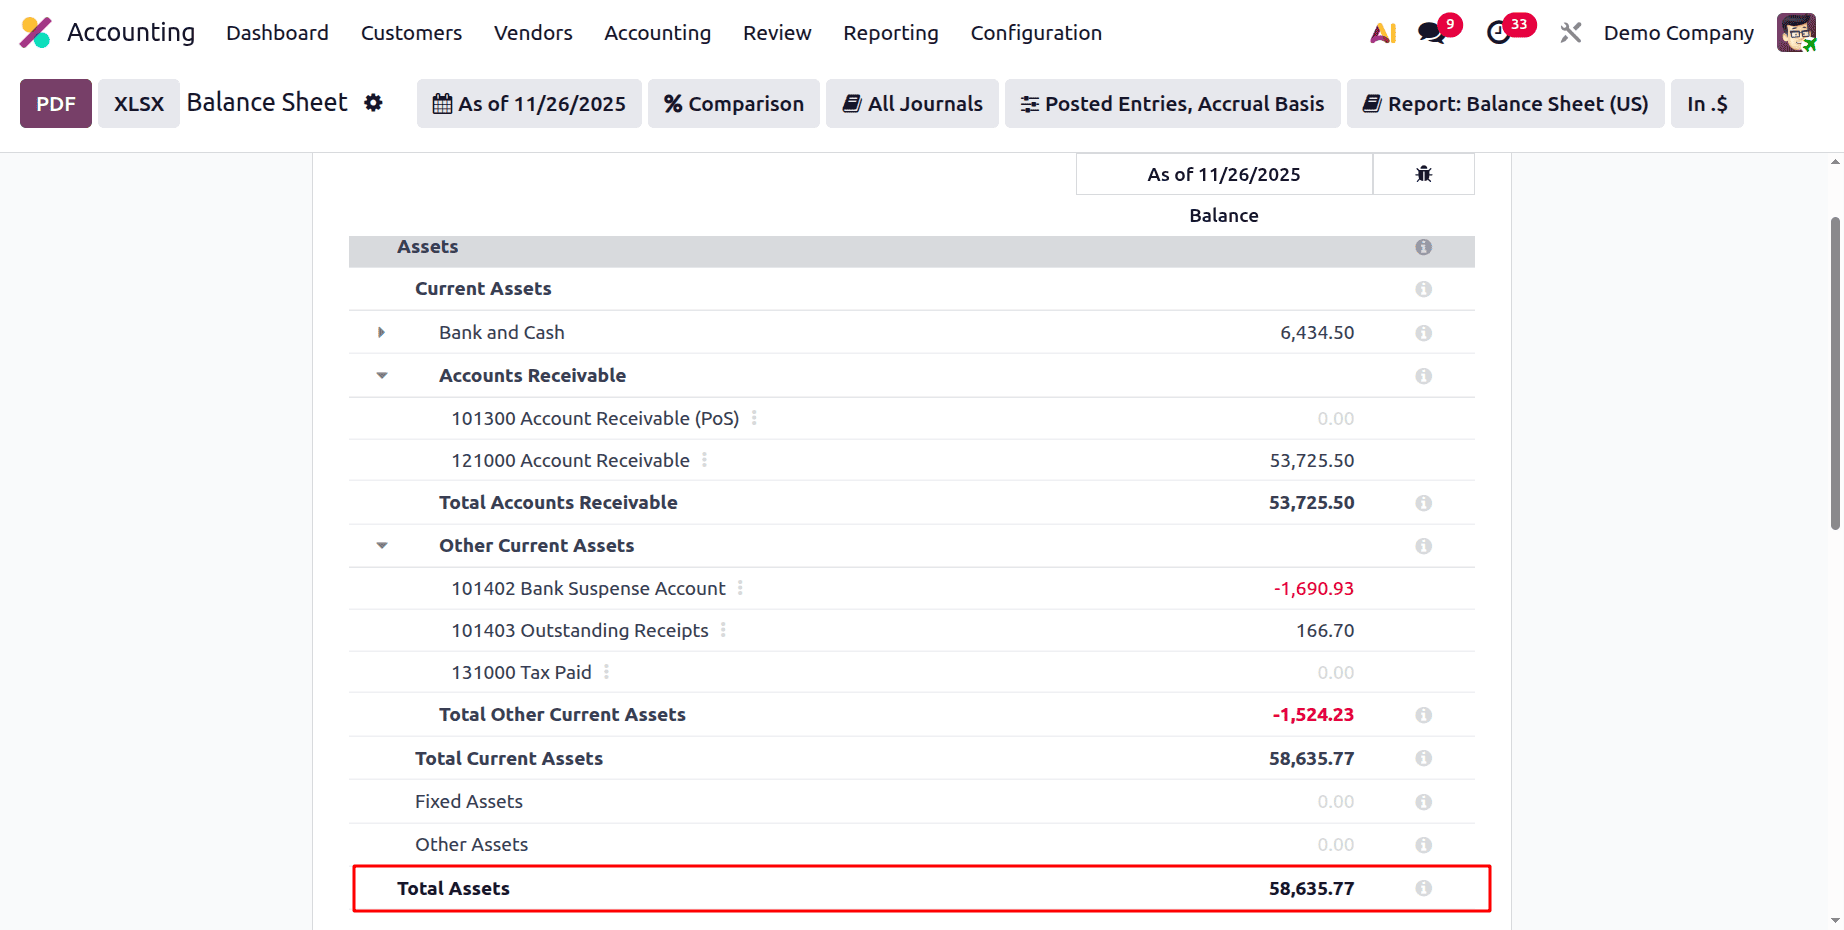
Fixed Assets and Other Assets come last. At the conclusion of the section, the sum of the assets is displayed. Here, the Total of Assets is the sum of Total Current Assets, Fixed Assets, and Other Assets.
Liabilities, which are the inverse of assets, show what a business owes other people. They are separated into Current and Non-Current Liabilities once more.
Current liabilities are debts that the business anticipates paying off within a year or during the course of its regular business cycle.
Liabilities that are not anticipated to be paid off in the upcoming year are known as non-current liabilities.
The total of Liabilities and Equity is Liabilities & Equity.
Liabilities & Equity = ( LI.balance + EQ.balance )
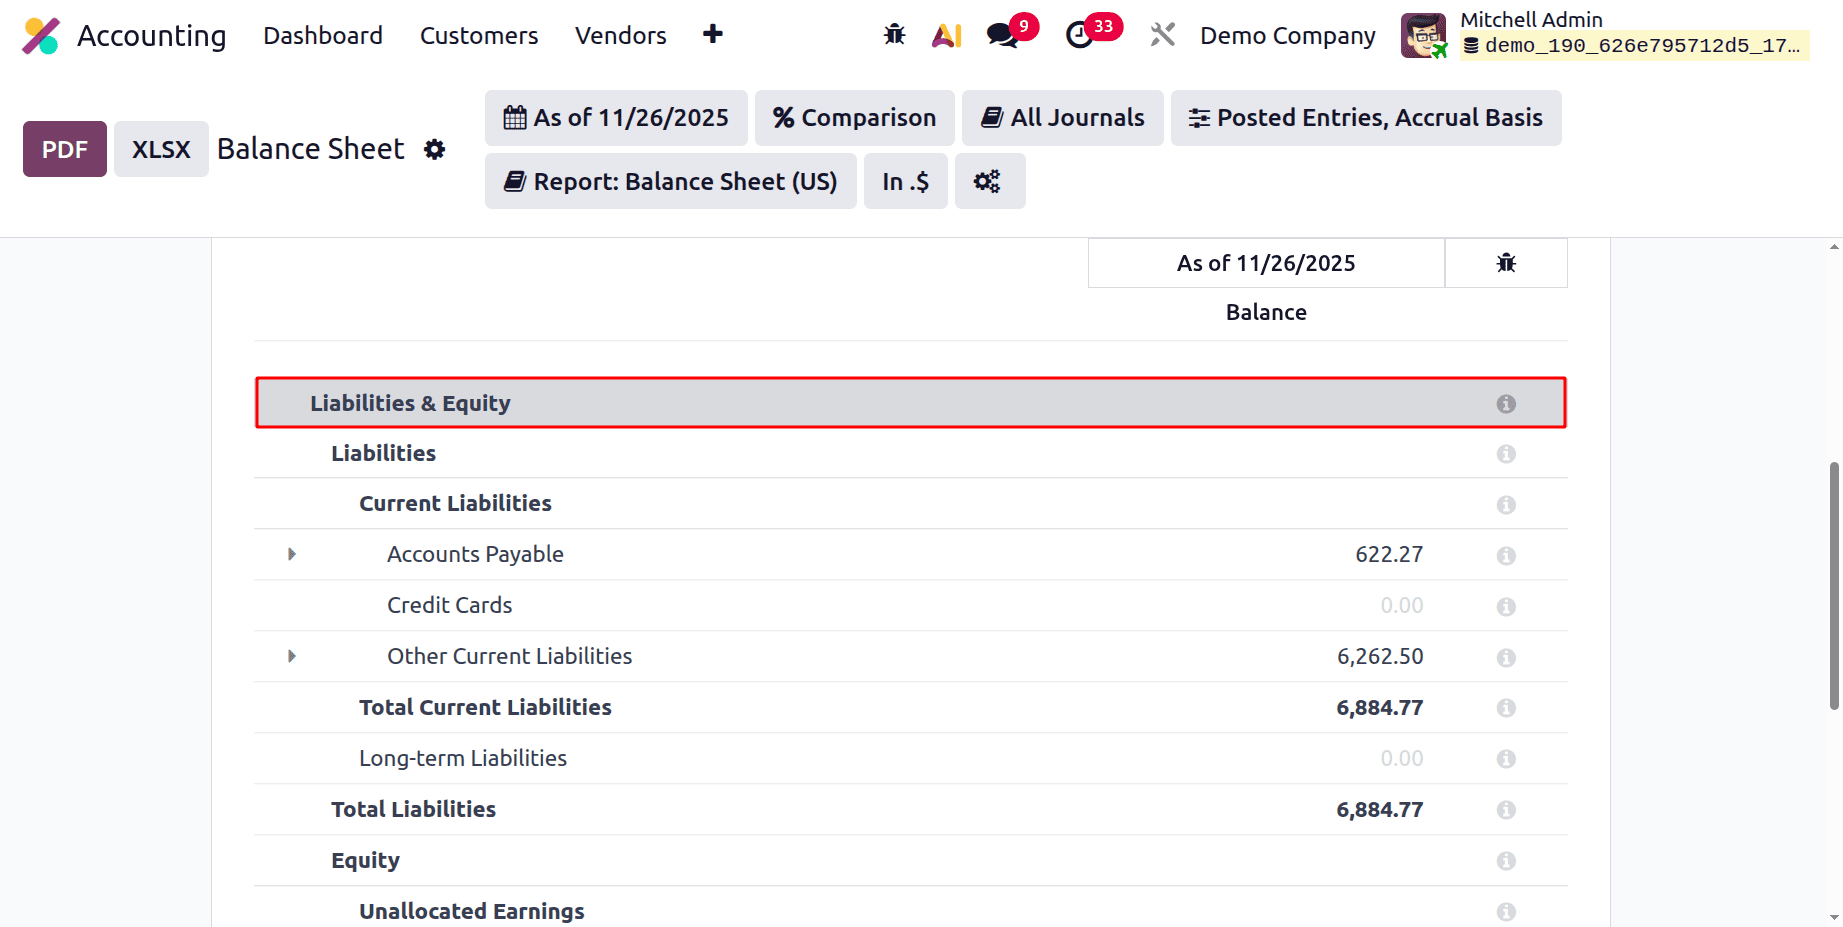
The Liabilities section includes accounts of the types Payable, Credit Card, Current Liabilities, and Non-Current Liabilities.
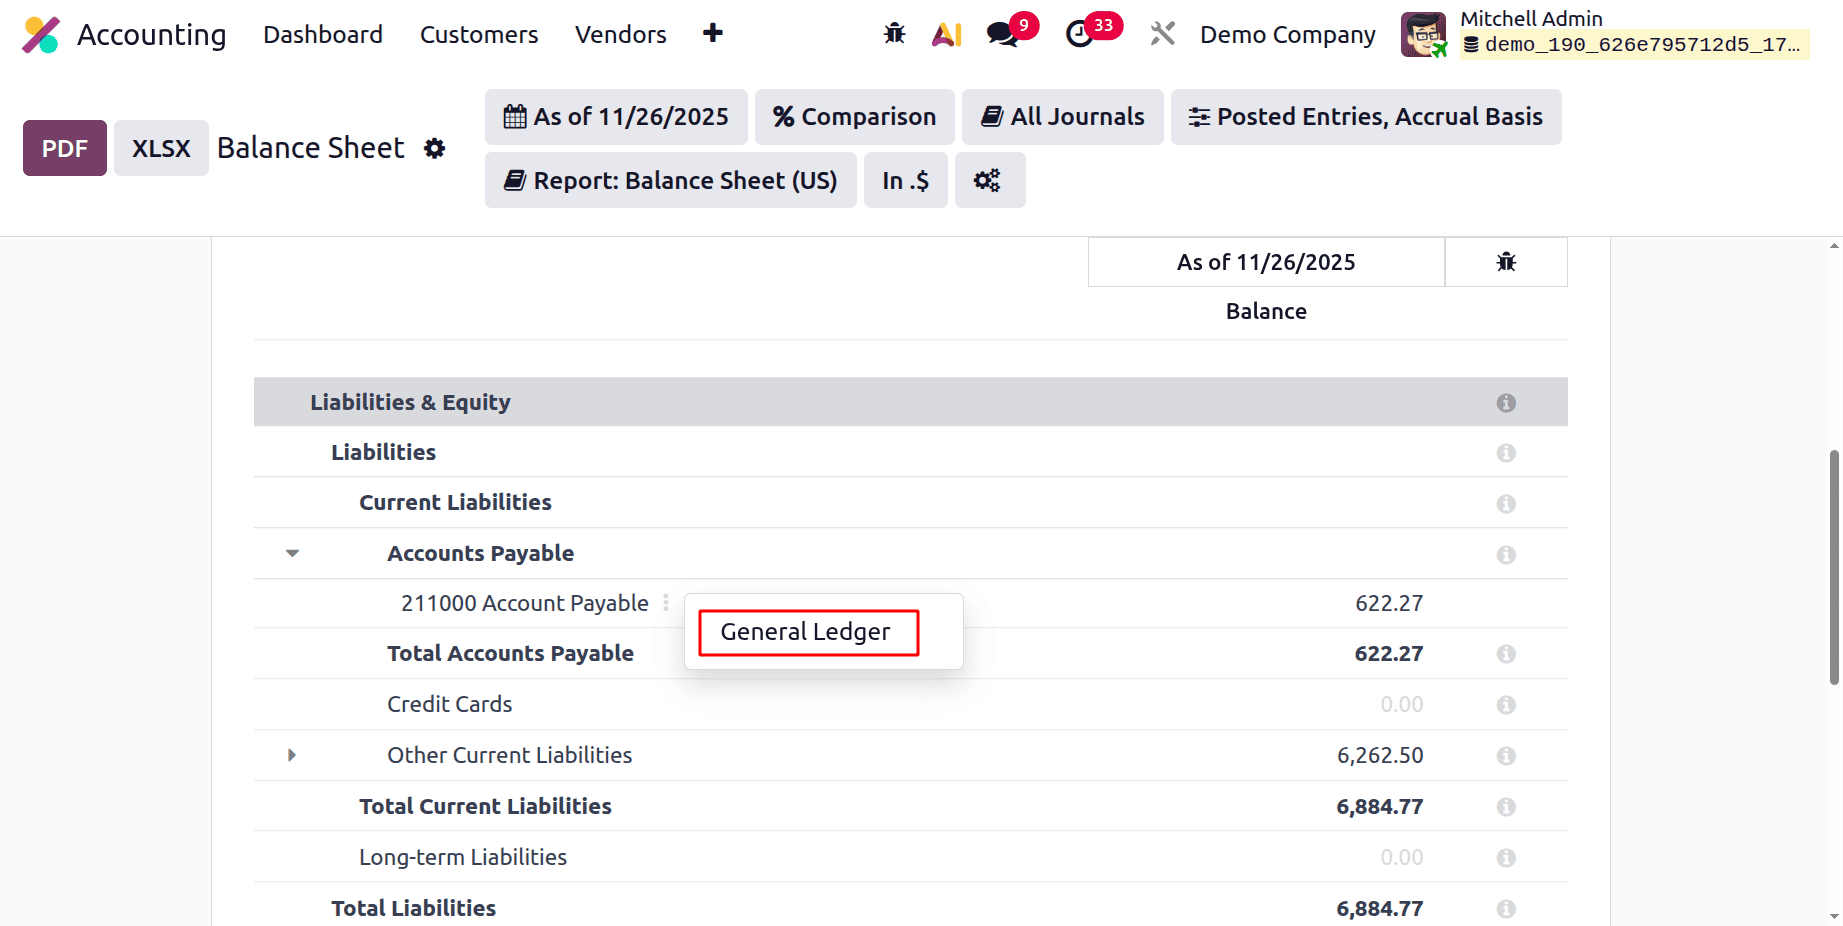
You can access the General Ledger report for an account by clicking on its three vertical dots.
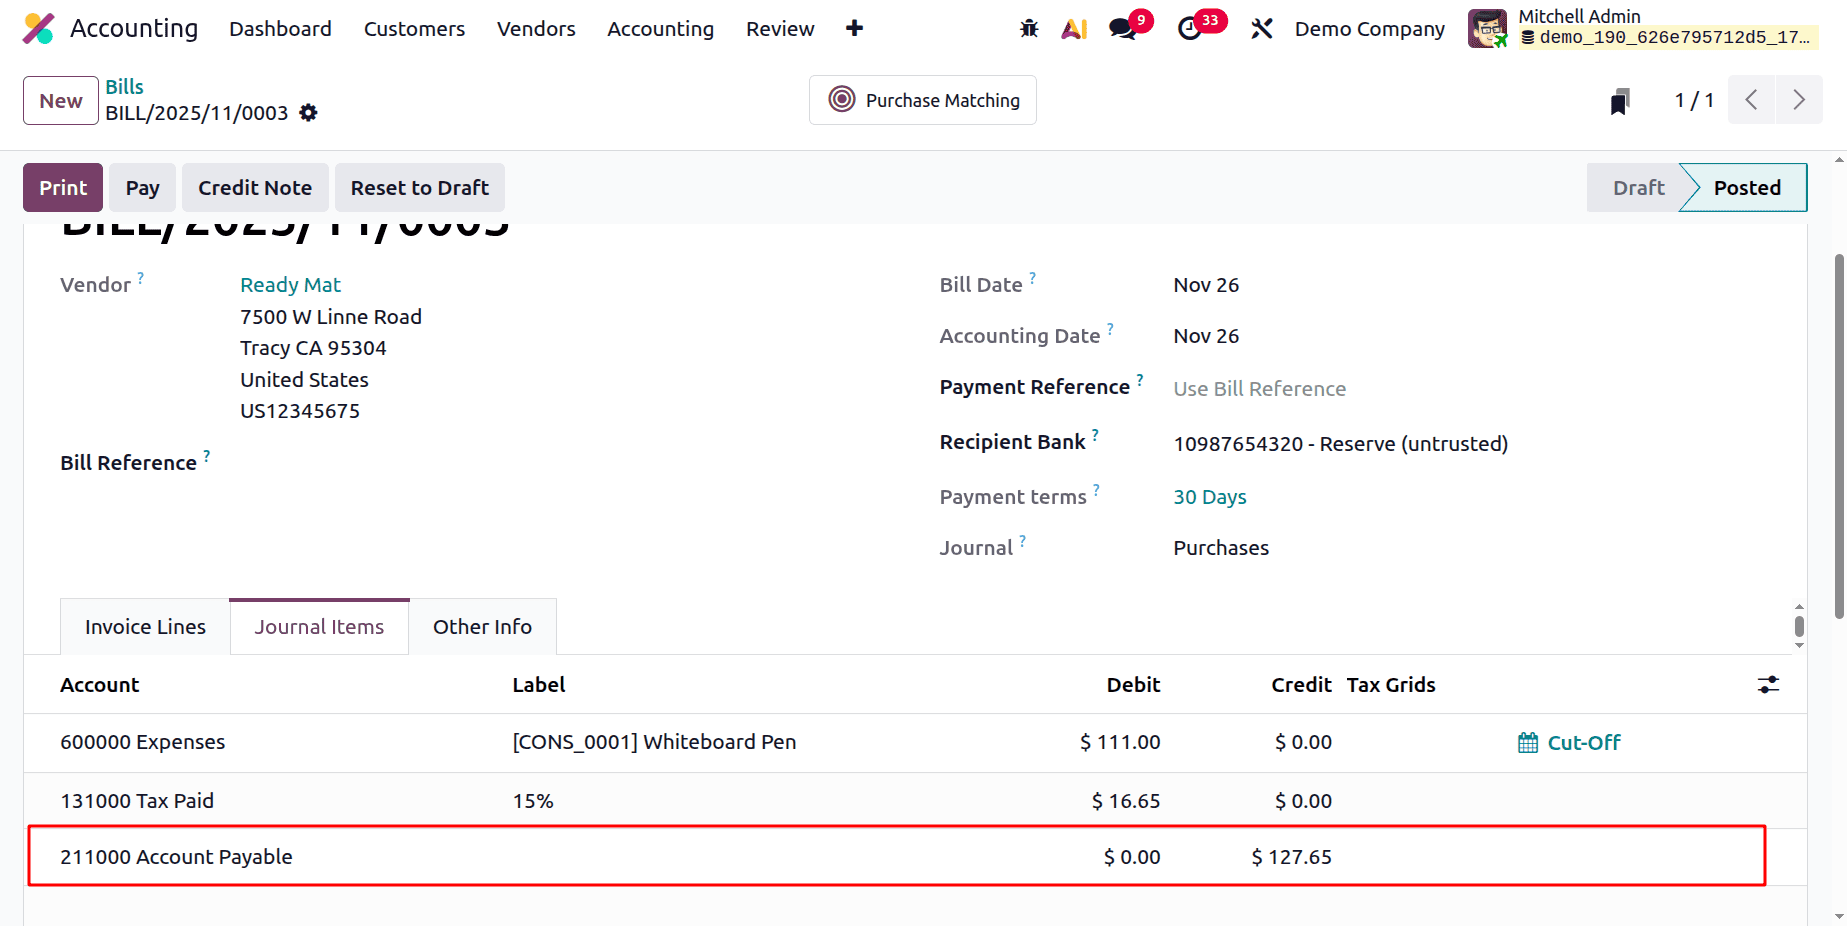
When a bill is generated, the money will be credited to Accounts Payable.
Then the entry will be updated inside the Balance Sheet as shown below.
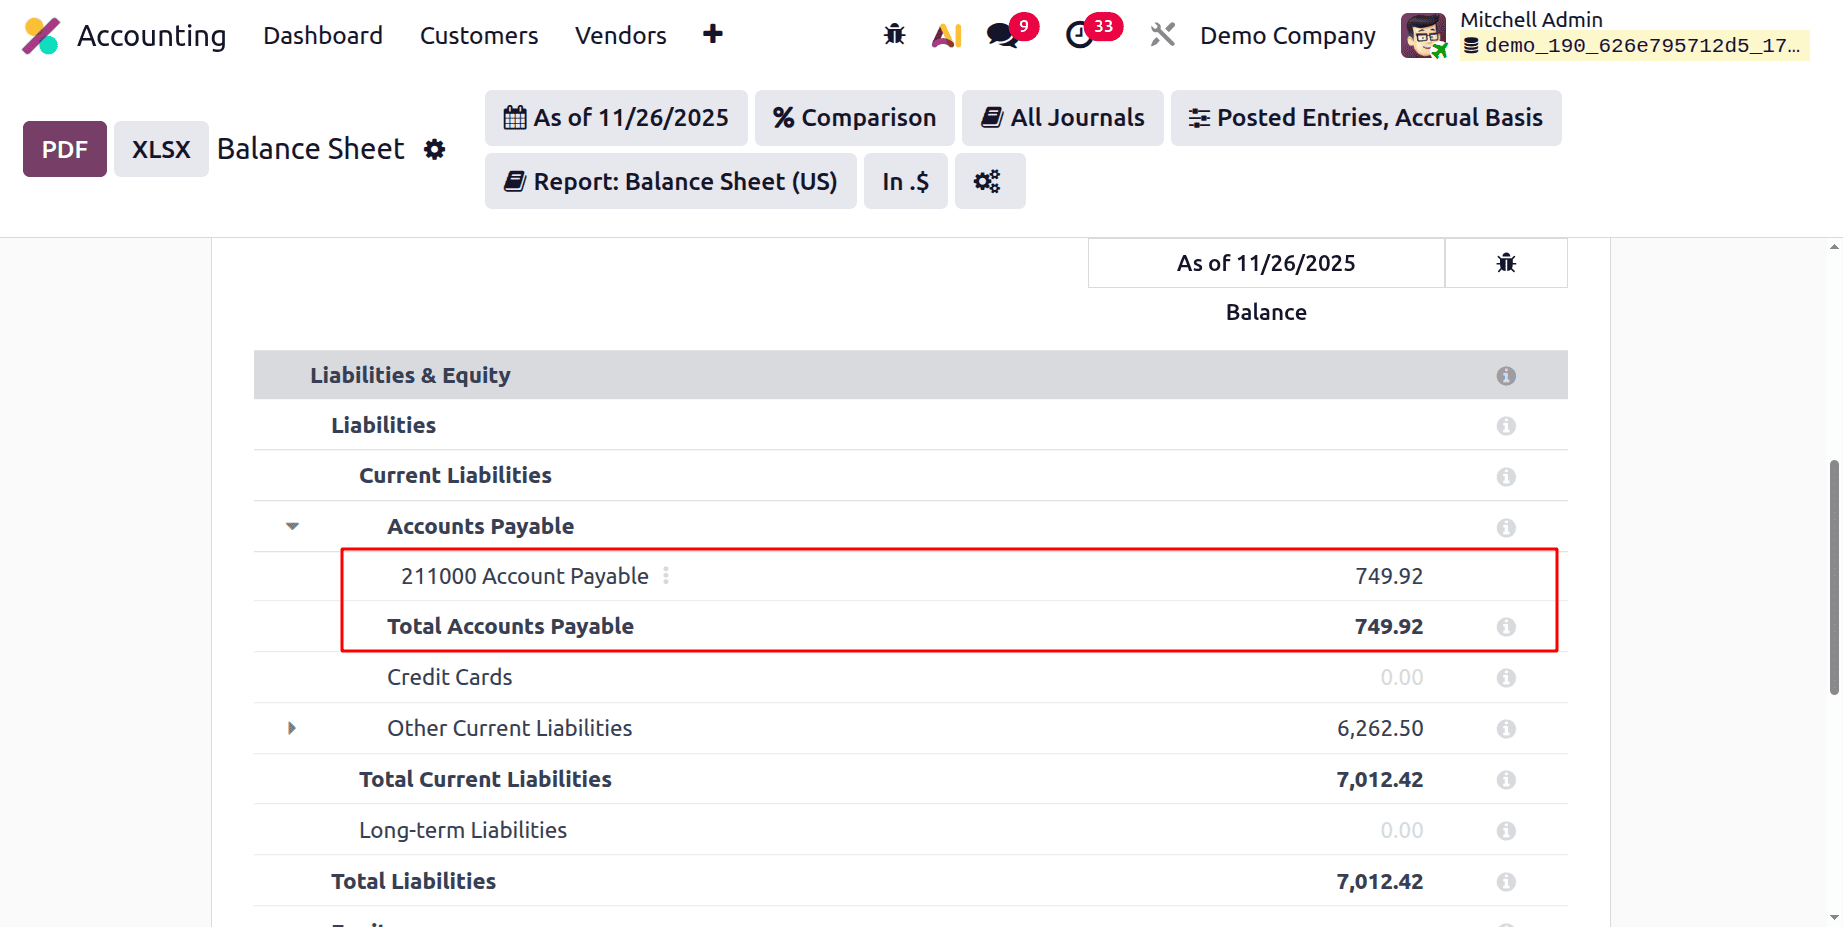
At the end, the total of the liabilities is also shown there. What is the sum of Total Current Liabilities and Long-term Liabilities?
After all liabilities have been settled, equity is the owners' remaining portion of the business's assets. It is essentially what the business owes its owners.
Accounts of the type Equity & Current Year Earnings are shown in the Equity Section.
The Unallocated Earnings and Retained Earnings sections are also shown in this section.
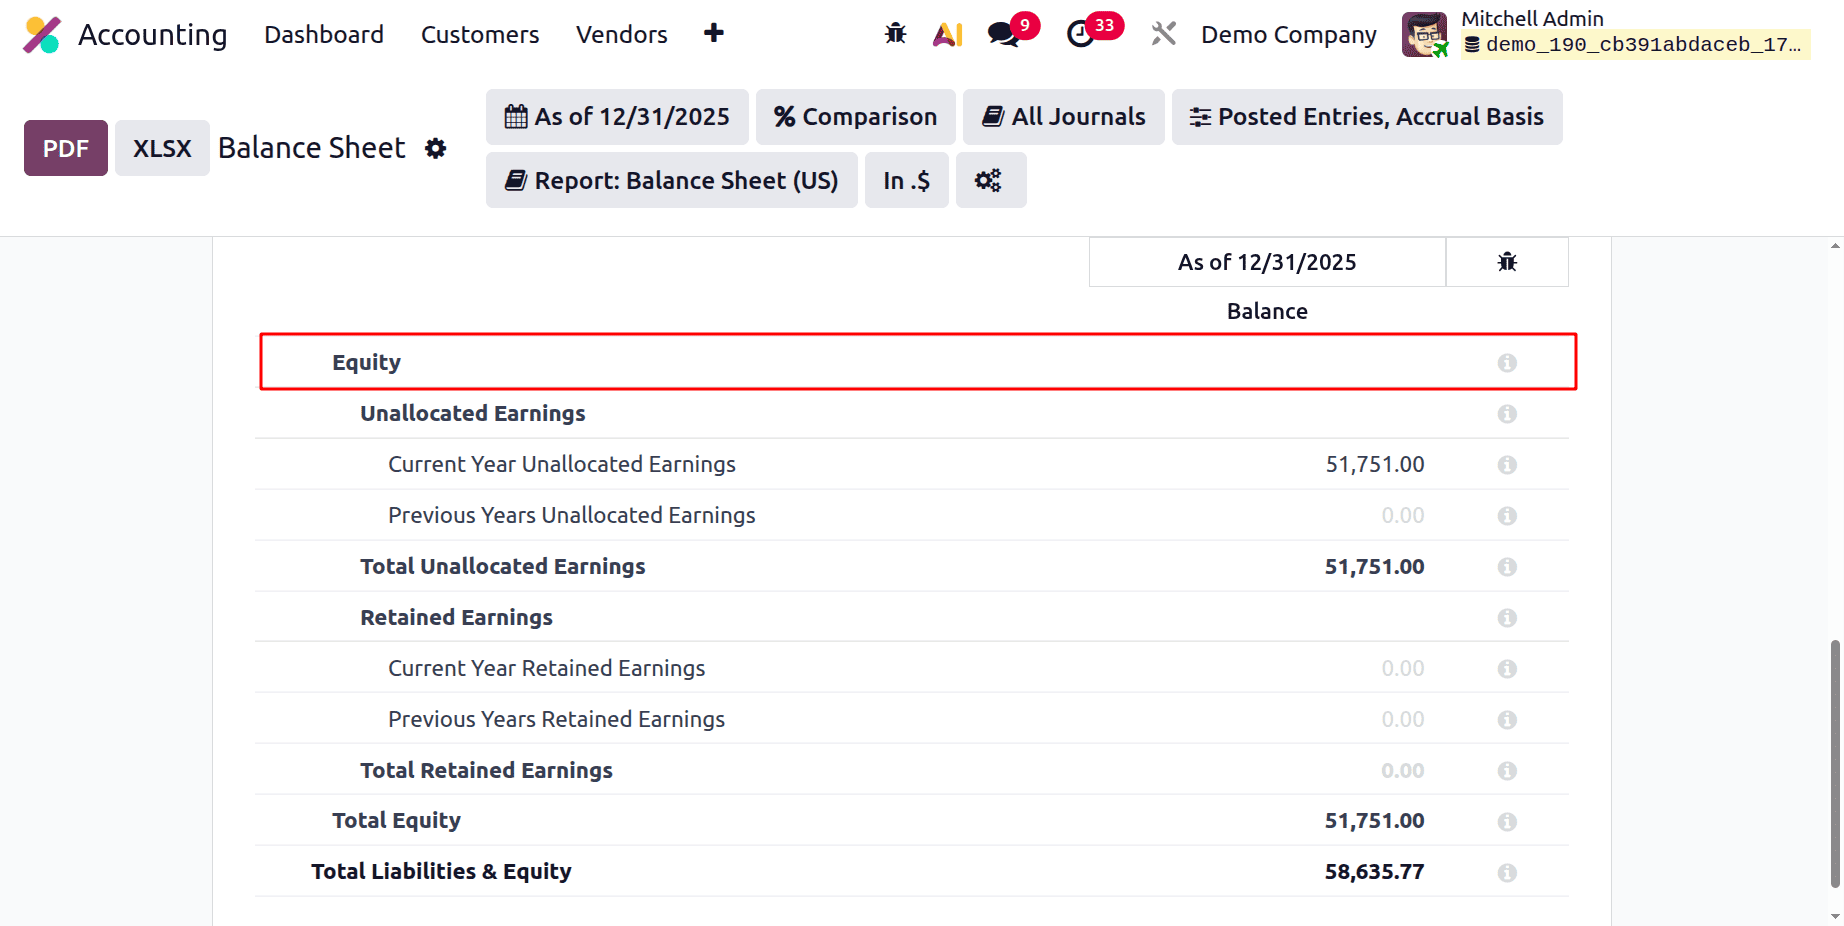
The net profit or loss for the current year that hasn't yet been transferred to retained earnings is represented by unallocated earnings. They are essentially profits that a company has earned but has not yet decided how to distribute. Beneath that are the unallocated earnings from previous years. Current Year Unallocated Earnings shows the Net Profit; click the link to obtain the Profit and Loss report.
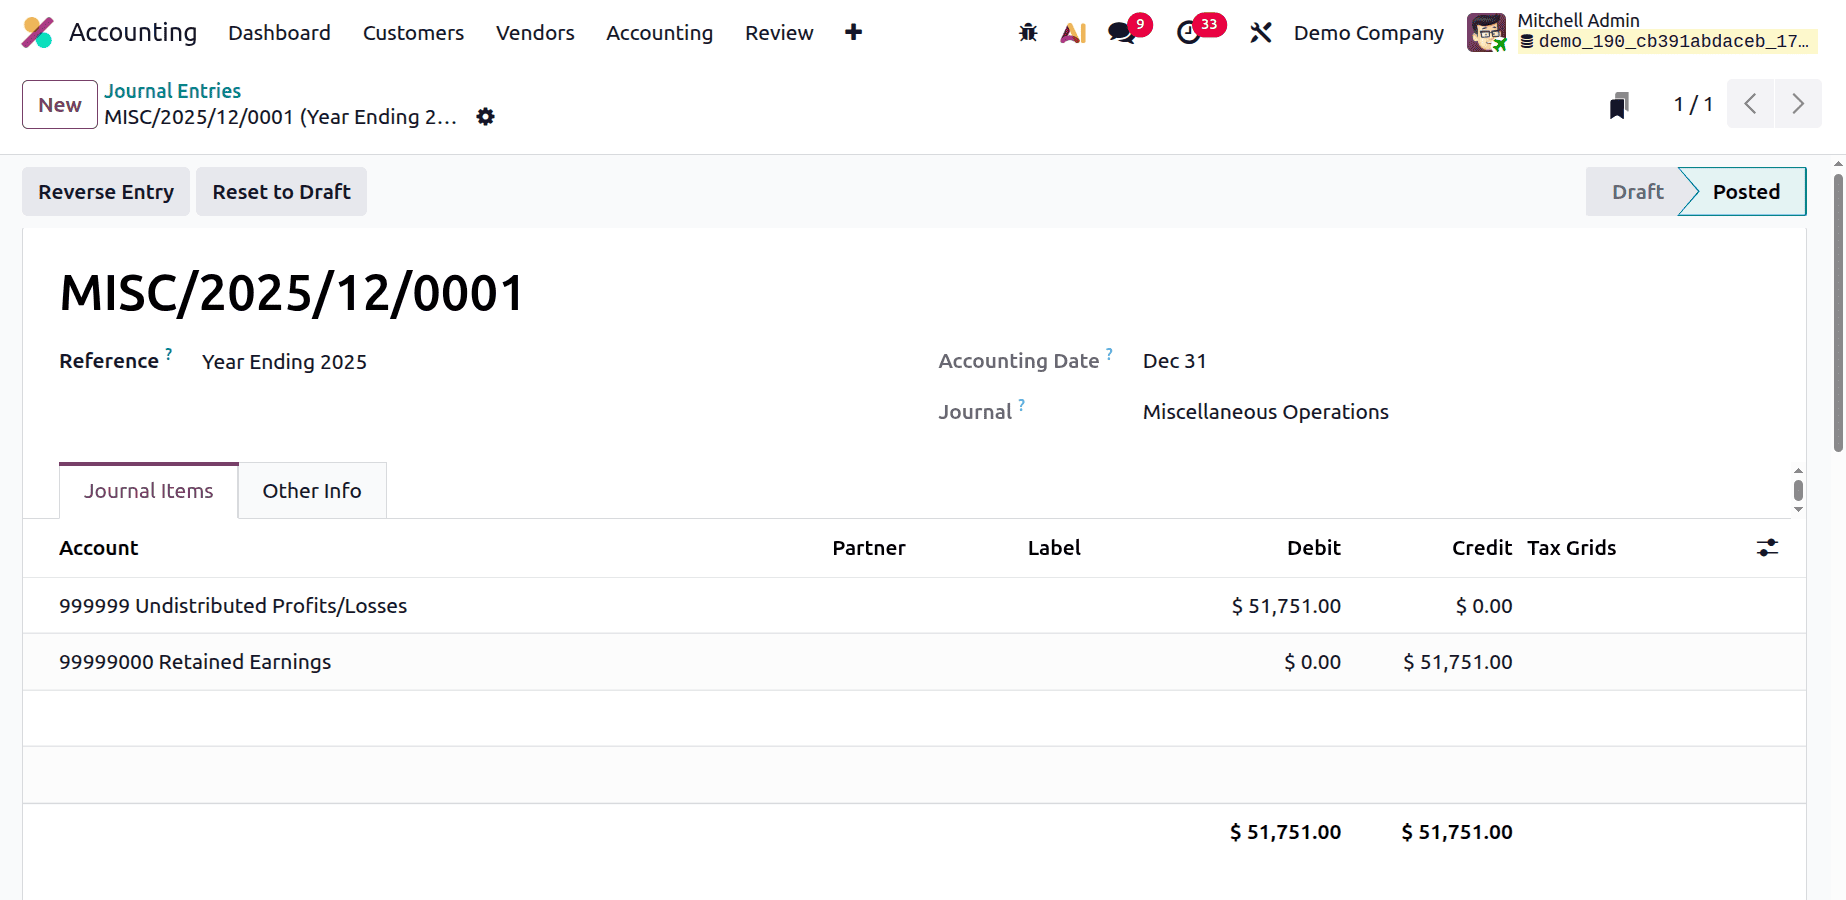
At the end of Fiscal Year, users need to transfer the Current Year Unallocated Earnings to Current Year Retained Earnings. For that, the user needs to post journal entries. They can transfer the amount inside the Undistributed Profit/Losses account to Retained Earnings.
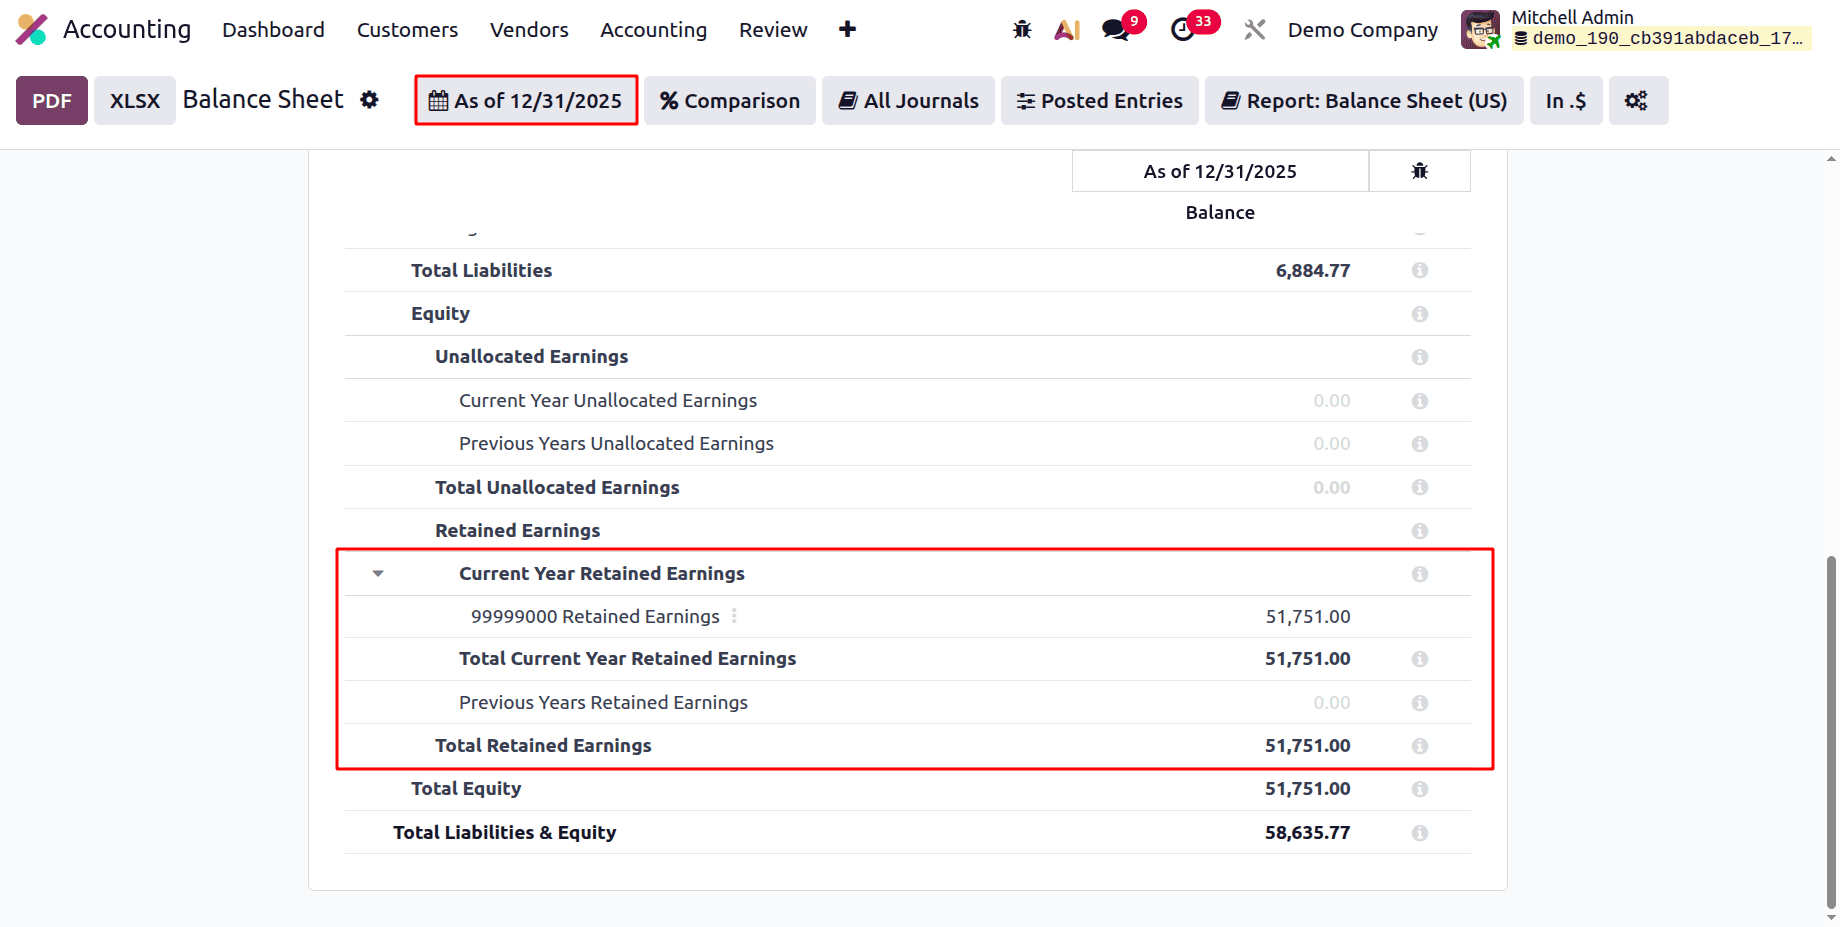
The total net income that a business has retained throughout time is known as retained earnings. At the end of a fiscal year, the unallocated earnings may be kept.
If the Date Filter is changed to End of the Year 2025, the amount will be changed to the Current Year Retained Earnings as shown below.
In the very next year, the same amount will be changed from the Current Year Retained Earnings to the Previous Year Retained Earnings.
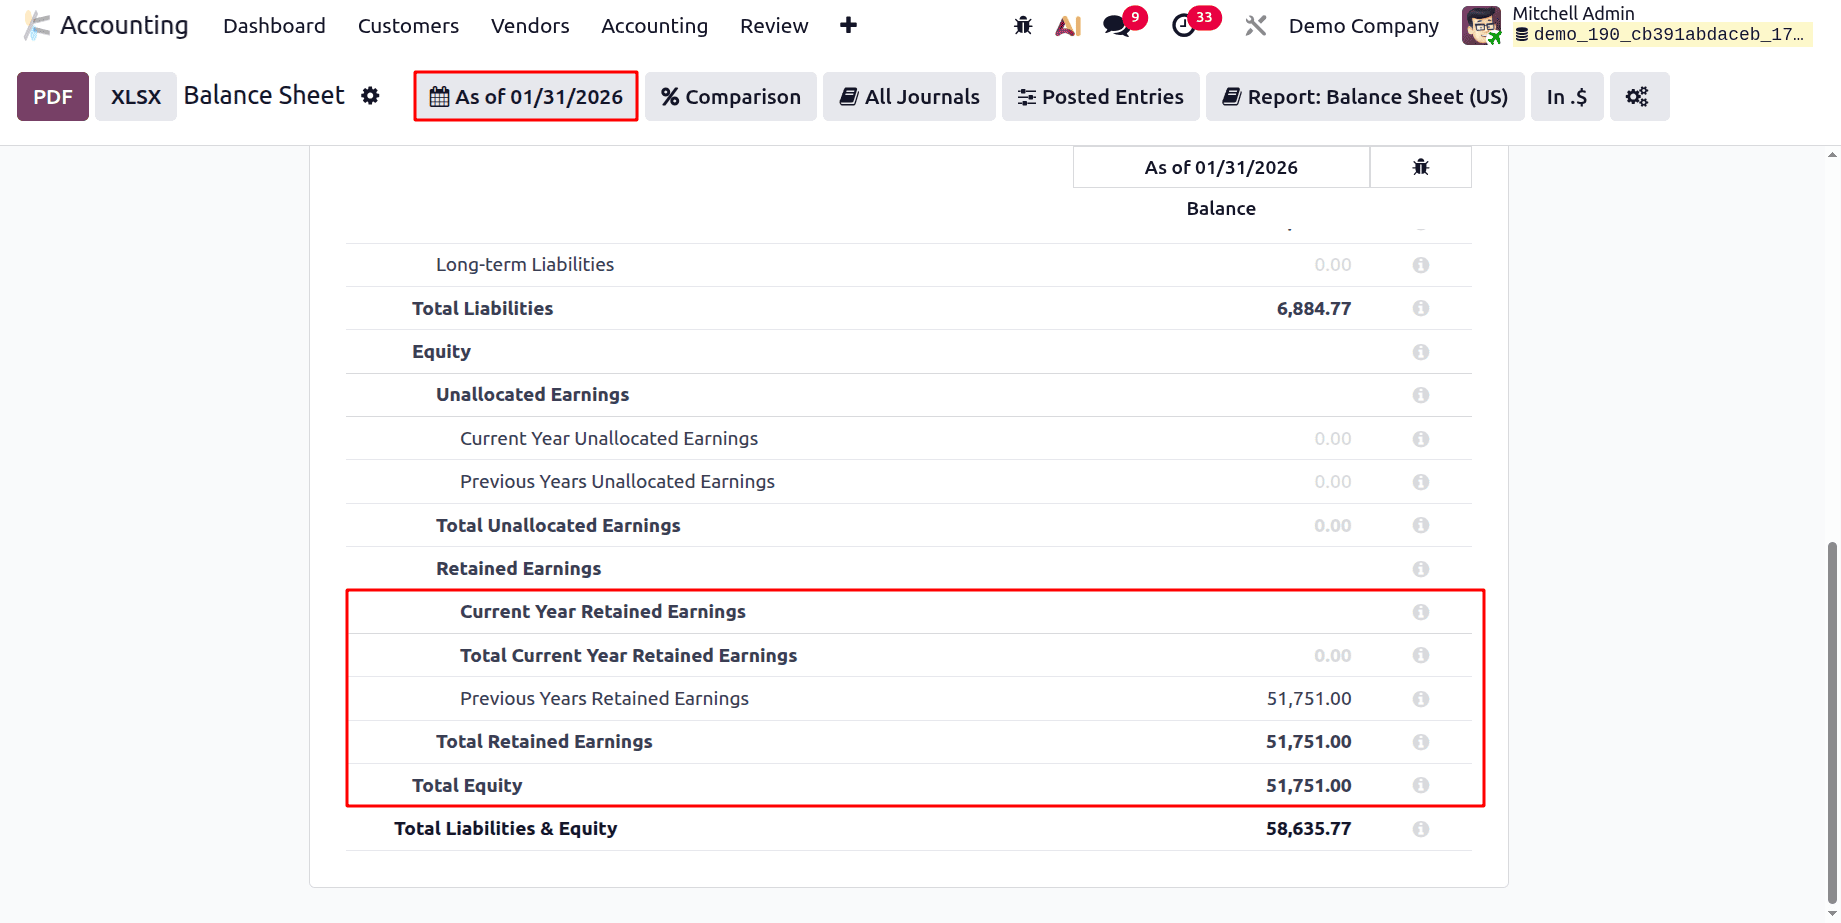
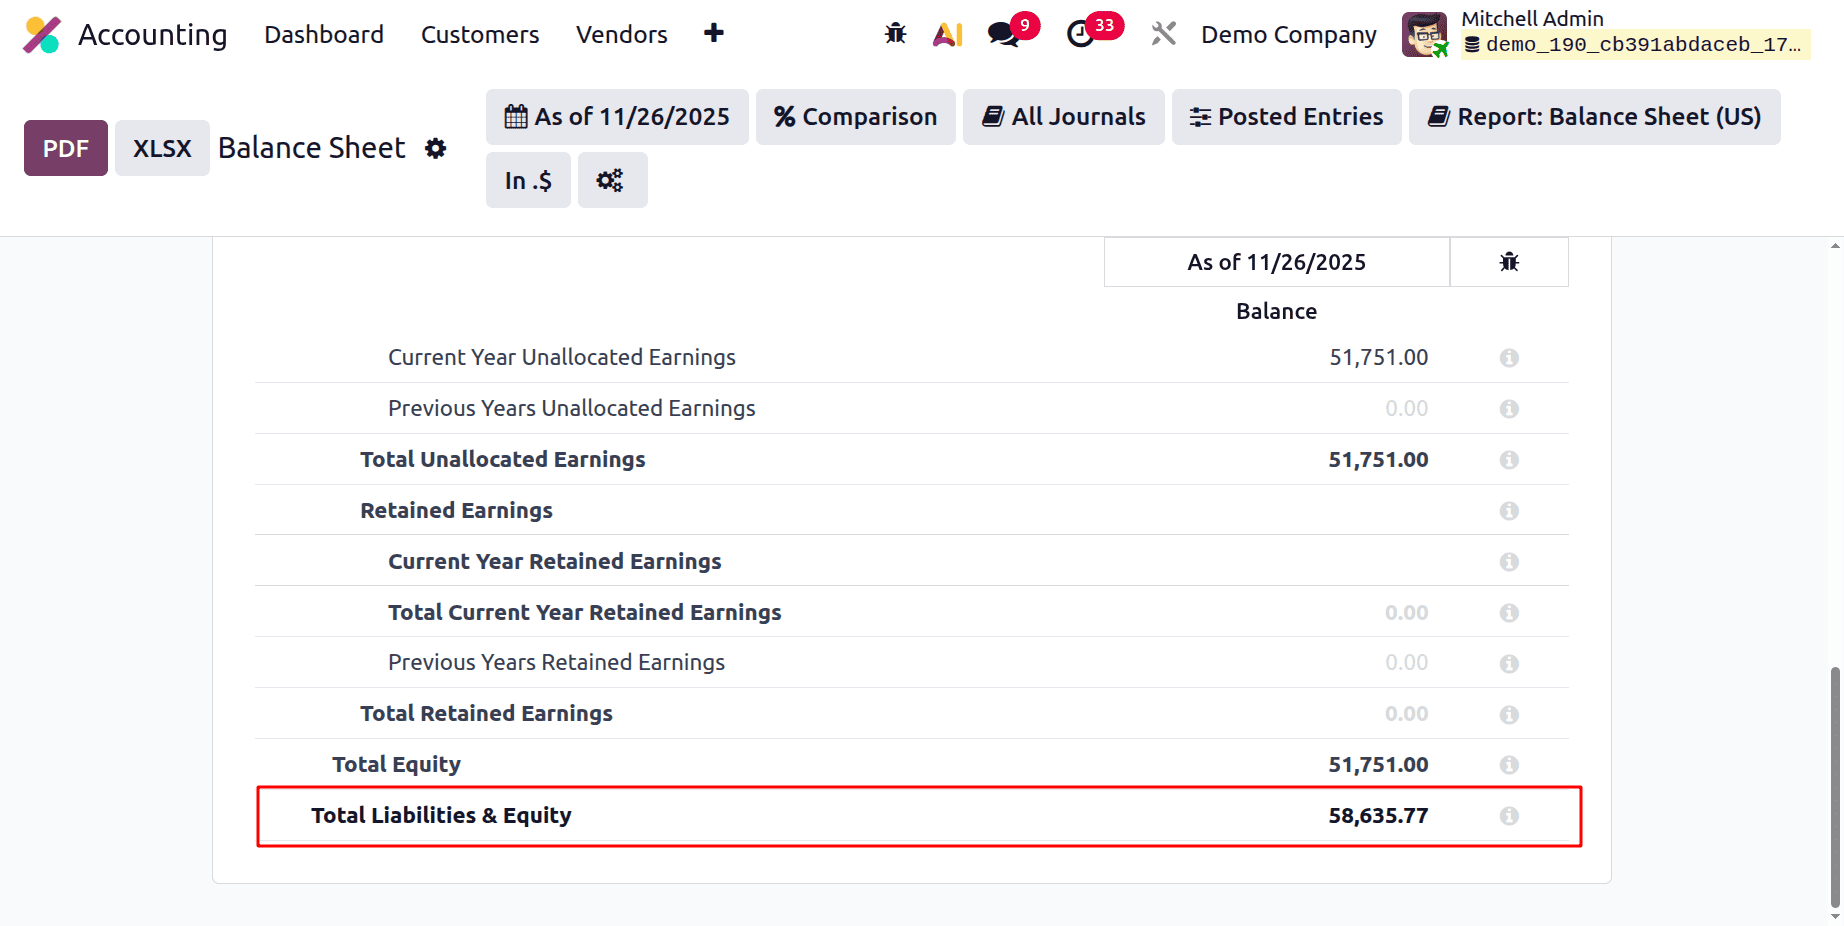
It also shows the Total Equity amount.
At the end of the report, the Total Liabilities & Equity shows, which is the sum of total liabilities and Total Equity.
Total Liabilities & Equity = ( LI.balance + EQ.balance )
In conclusion, companies looking for precise and comprehensive financial data will find the Balance Sheet report in Odoo's Accounting module to be a great resource. Users may make well-informed judgments thanks to its multi-currency adaptability, adaptable interface, and thorough data segmentation.
Businesses may face the challenges of the contemporary, dynamic marketplace and foster long-term growth and profitability by utilising a robust financial reporting system, like Odoo 19.
To read more about How to Create Balance Sheet Report in Odoo 18, refer to our blog How to Create Balance Sheet Report in Odoo 18.