The Profit and Loss (P&L) Report, often referred to as an Income Statement, is the definitive pulse check for any organization. It offers a concise overview of a company’s income, expenditures, and overall expenses during a defined period. In contrast to the Balance Sheet, which reflects the financial position of a business at a particular point in time, the Profit and Loss statement monitors financial performance across a specific timeframe, such as a month, quarter, or year. Ultimately, this report answers the most fundamental question in business: "Is this company making money or losing it?" In Odoo 19, the P&L report is a dynamic, automated tool that eliminates the need for manual spreadsheet calculations. By pulling data directly from your validated journal entries, Odoo offers a real-time view of your operational efficiency.
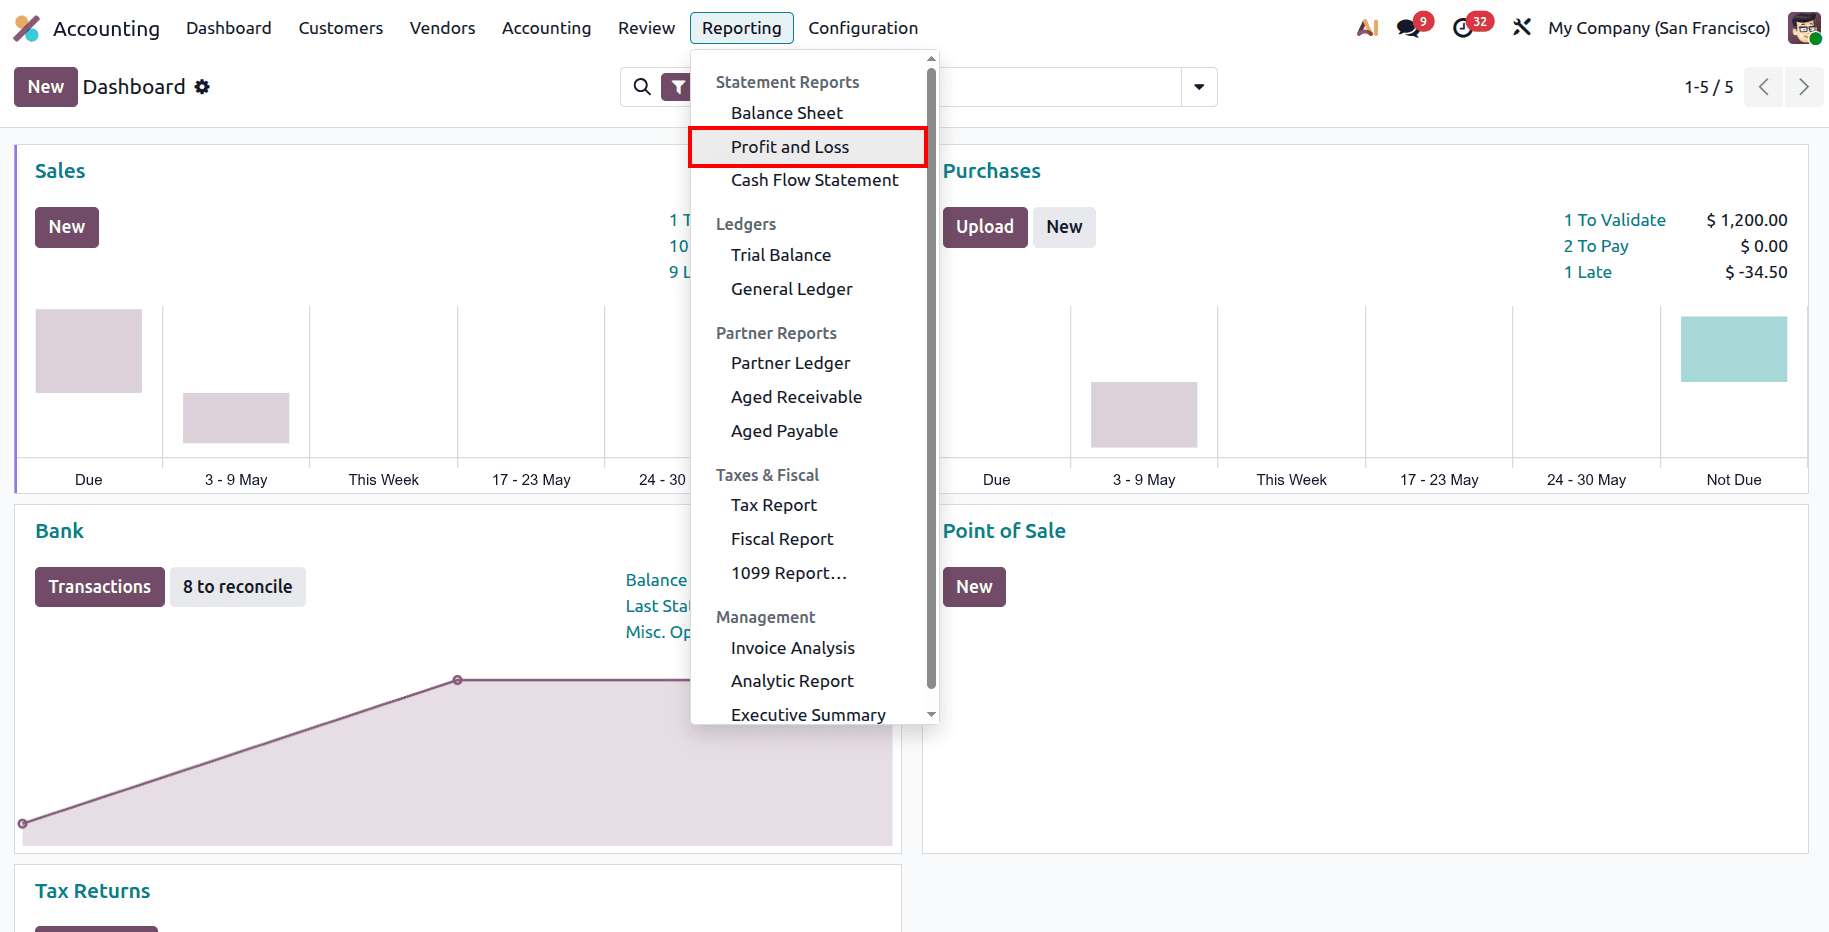
To view the report, you begin by opening the Accounting Module from your main dashboard. To access the report, start by opening the Accounting Module from the main dashboard. Once inside, locate the Reporting menu situated in the top navigation bar and look under the Statements section to find the Profit and Loss link. Clicking this will generate your real-time statement, which is immediately ready for analysis or further filtering.
The P&L report in Odoo 19 is organized into a logical hierarchy that allows you to see exactly how your "top-line" revenue is transformed into your "bottom-line" net income.
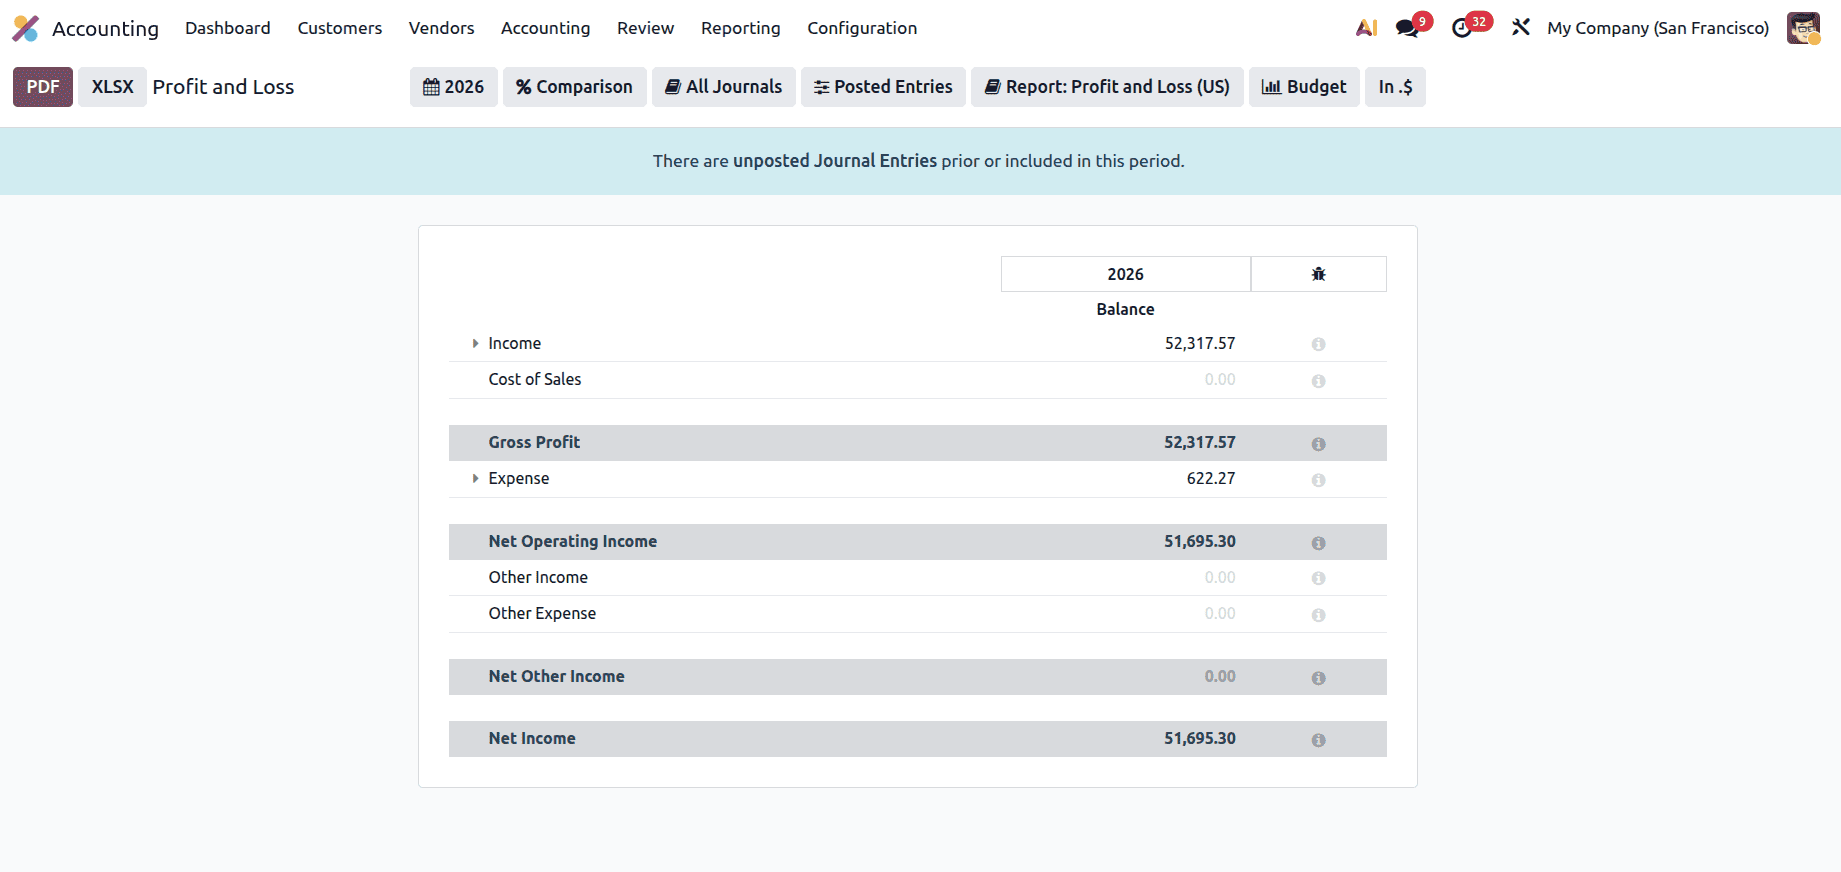
1. Gross Profit: Core Business Profitability
This section measures the profitability of your products or services before overheads and administrative costs are considered. The Income sub-section records all revenue generated from primary business activities, such as product sales, service fees, or project-based billing. Below this section, the Cost of Sales represents the direct expenses associated with producing the goods sold or delivering the services provided.
This may include raw material costs, direct labor, or shipping fees required to deliver a product to a customer. Odoo calculates the Gross Profit by subtracting the Cost of Sales from Income; this figure represents the money available to cover your operating expenses. A healthy Gross Profit margin is the first sign of a sustainable business model.
2. Net Operating Income: Operational Efficiency
This middle section identifies the costs of keeping the business doors open, independent of specific sales volume. The Expense sub-section includes all "indirect costs" or overheads, such as office rent, utilities, insurance, marketing budgets, and administrative salaries. By subtracting these operating expenses from your Gross Profit, Odoo determines the Net Operating Income. This figure is critical because it tells you if your standard business operations are profitable before you factor in non-operational items like taxes or interest payments.
3. Net Income: The Final Result
The final section incorporates miscellaneous financial activities to reach the definitive profit or loss for the period. The Other Income & Other Expense sub-sections record items outside of standard operations, such as interest earned on bank accounts, currency exchange gains or losses, or taxes paid. Finally, the Net Income represents the final figure at the bottom of the report. If this number is positive, the business is profitable; if it is negative (often shown in red), the business has incurred a loss for that specific timeframe.
Detailed Analysis of Odoo 19 Filters
The power of Odoo 19 lies in its interactive filters, which allow you to slice and dice your financial data for better decision-making. The report can be printed or exported in both XLSX and PDF file formats.
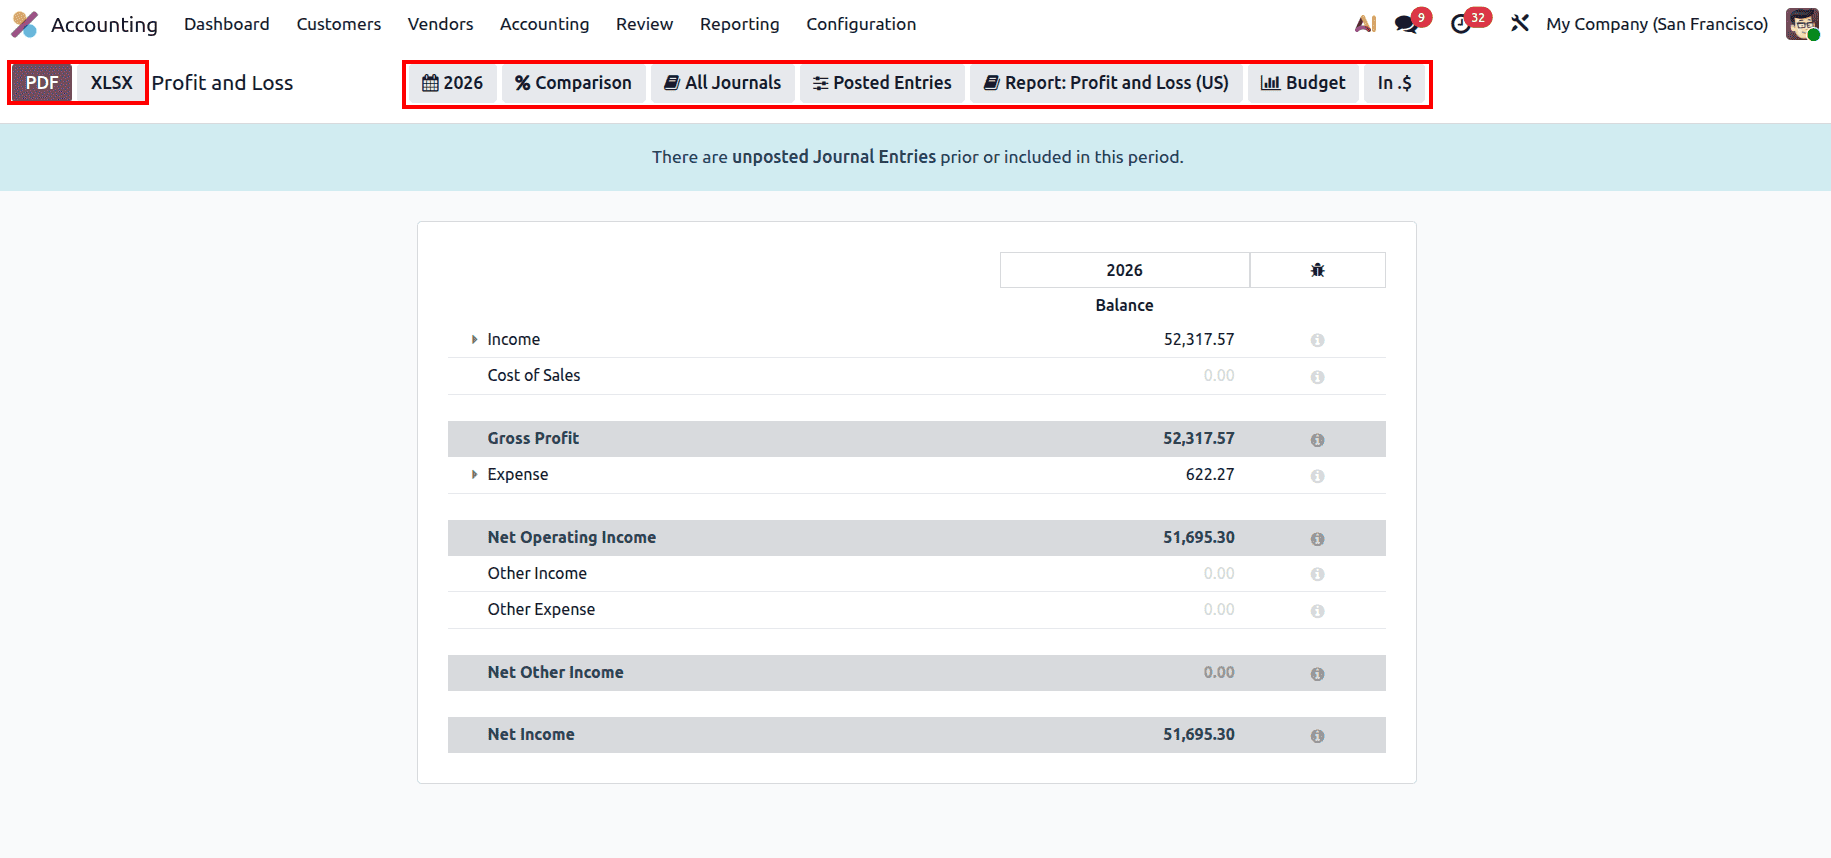
- Date Range (As of Date): This filter determines the reporting period. You can choose predefined timeframes such as Today, End of Month, End of Quarter, or End of Year. The Specific Date option is particularly useful for looking back at historical performance during specific events or fiscal milestones.
- % Comparison: This is among the most effective analytical tools provided in the report.
- It allows you to compare current performance against a Previous Period, the Same Period Last Year, or a Specific Date. This comparison helps identify if expenses are rising too fast or if sales are growing at the expected rate year-over-year.
- All Journals: By default, the report aggregates data from all financial activities. However, you can use this filter to isolate specific journals, such as seeing P&L results only from your "Bank" or "Cash" operations, to understand cash-basis profitability.
- Posted Entries: This menu controls the data integrity of your report. Including Draft Entries creates a "pro-forma" view, showing expected performance based on unvalidated invoices. The Unfold All option immediately expands every hierarchy to show individual ledger account details, while Hide lines at 0 removes accounts with no balance to keep the report clean.
- Budget: This unique filter allows you to overlay your actual performance against predefined business budgets. This is critical for ensuring your expenses stay within planned limits and identifying departments that are overspending.
- Currency Scaling (In .$): For larger companies, viewing individual cents can be distracting. This filter allows you to scale figures to the nearest dollar (In $), thousands (In K$), or millions (In M$), making the report easier for executives to read at a glance.
To ensure your Profit and Loss report is a reliable strategic compass, it is essential to follow a few technical best practices in Odoo 19. You must always monitor the unposted Journal Entries banner at the top of the report. This warning indicates that there are transactions, potentially significant sales or expenses, that have not yet been finalized. Making strategic decisions based on an incomplete P&L can lead to inaccurate assumptions about your actual net income.
Furthermore, the accuracy of your P&L depends on how well your bank statements and invoices are reconciled. Regular reconciliation ensures that "Income" and "Expense" lines correctly reflect reality rather than just pending paperwork. By utilizing Odoo’s analytic account tags, you can filter the P&L report to see the profitability of specific projects, departments, or even individual sales teams. This moves the report from a "whole company" view to a surgical tool for operational improvement.
The Odoo 19 Profit and Loss report is more than just a document for tax season; it is an essential strategic asset. By logically organizing your data into Gross Profit, Operating Income, and Net Income, Odoo provides a clear narrative of your business's financial journey. When combined with powerful filters like % Comparison for trend analysis and Budget overlays for fiscal discipline, the P&L becomes the ultimate tool for proactive management. Regularly reviewing this report allows you to catch negative trends early and double down on the activities that are driving your true bottom line.
To read more about Overview of Profit and Loss Report in Odoo 19 Accounting, refer to our blog Overview of Profit and Loss Report in Odoo 19 Accounting.