Odoo 19 is a complete open-source ERP solution that helps organizations to simplify their daily business activities through a series of applications available on the same platform. The key aspects covered by Odoo 19 include sales, inventory, accounting, manufacturing, human resources management, CRM, among other areas of activity. Through high performance, a user-friendly interface, and flexibility, Odoo 19 can be applied by any organization regardless of its size. Thanks to the ability of the application to be customized to meet individual needs, organizations can use the software in collaboration with real-time scalability.
In this blog post, we'll delve into Views in the Odoo 19 Helpdesk ticket.
The Helpdesk module provides multiple ticket views, enabling users to manage and monitor support requests in the way that best suits their workflow.
- List View: Displays tickets in a tabular format, making them easy to view, sort, and manage.
- Kanban View: Displays tickets as cards grouped by stage, making it easy to monitor progress at a glance
- Activity View: Displays scheduled activities and follow-up tasks for each ticket
- Pivot View: Provides a customizable pivot table for analyzing ticket data using different measures and grouping options
- Graph View: Displays ticket statistics using bar, line, or pie charts for easy visual analysis
- Cohort View: Displays ticket resolution trends over time, helping teams evaluate performance and operational efficiency
In the Helpdesk module, all the tickets in the Helpdesk system are organized under the Tickets menu with two options available, namely, My Tickets and All Tickets. The My Tickets option will only show the tickets that are assigned to the logged-in user at the moment. This gives the support agent the chance to handle only his/her own responsibilities. The All Tickets option will give all the tickets available in the system to the user based on his access rights.
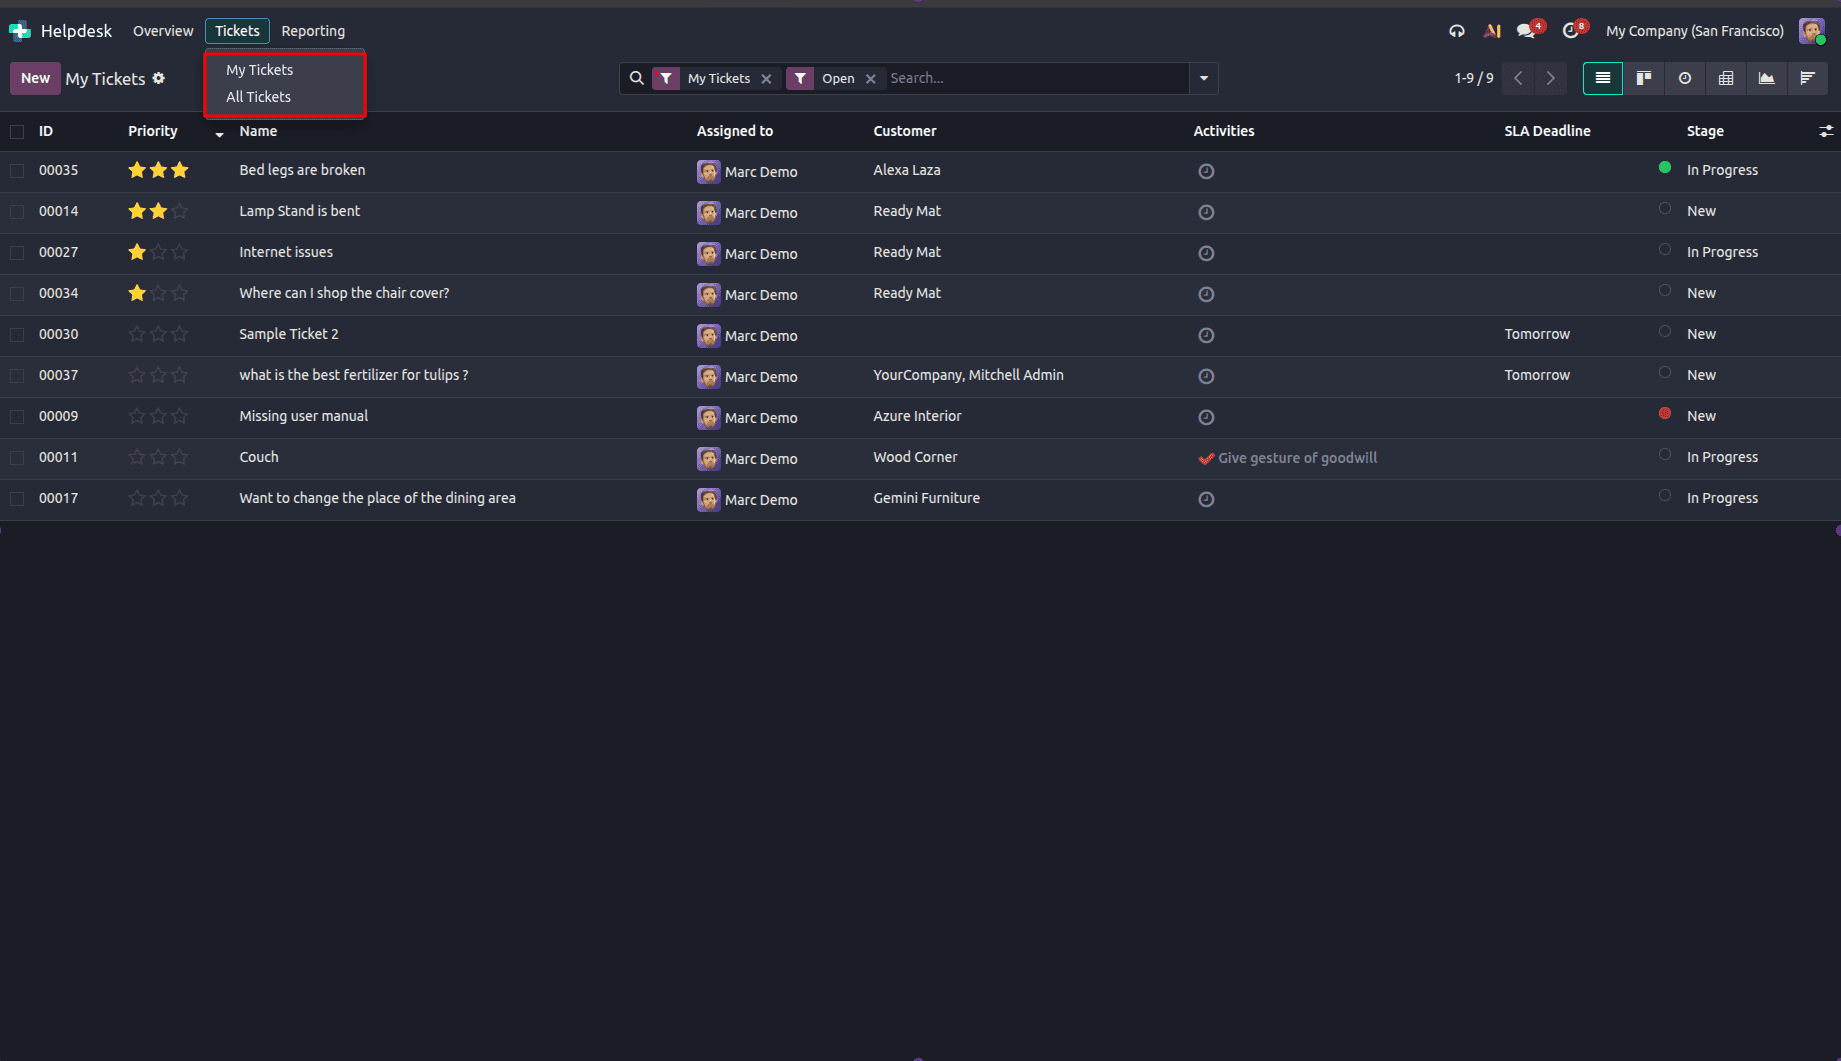
MY TICKETS
Both the My Tickets and All Tickets sections offer the same set of views described above. Let’s begin by exploring the views available in the My Tickets section.
1. LIST VIEW
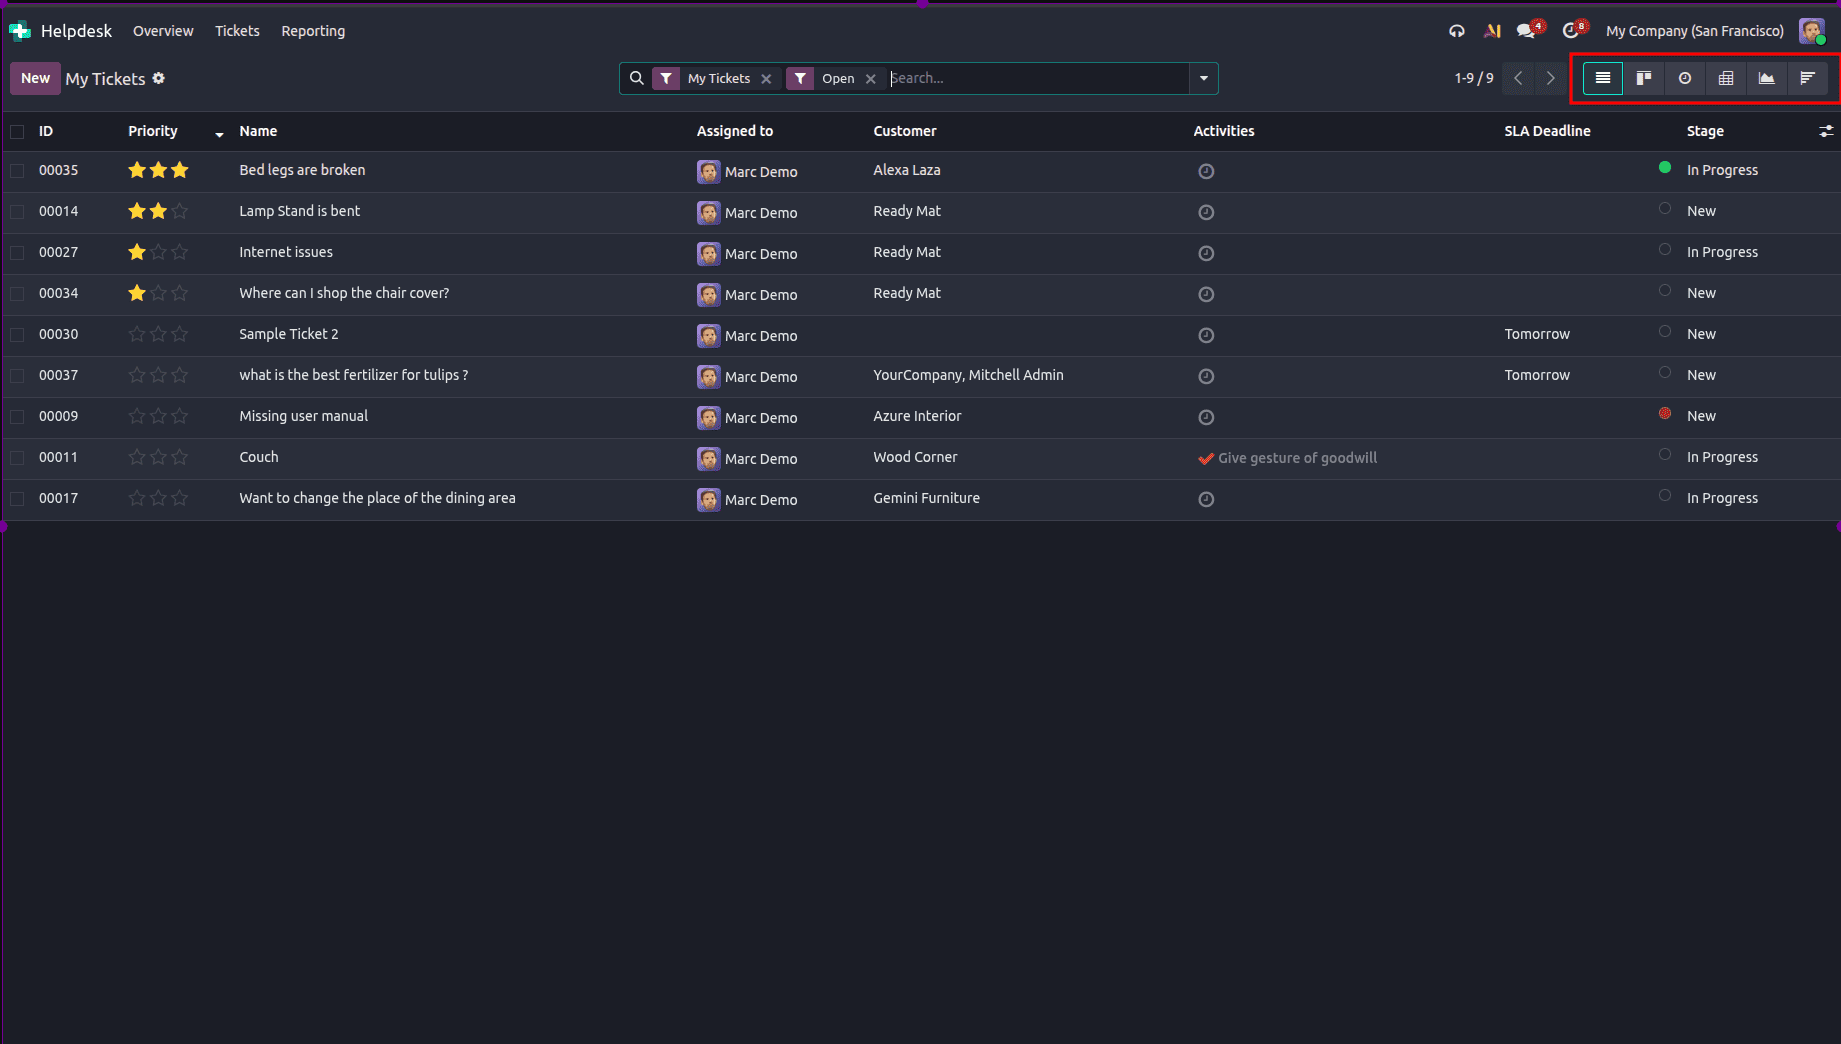
In the My Tickets module, there is an option called the List View, which gives the logged-in agent a good and clear idea of all the tickets he is handling. The List View is by default sorted with only the My Tickets and Open Tickets categories showing, thus making it easier for support agents to work with their own tickets. In each row, there is information available such as Priority, Ticket Name, Assigned To, Customer, Scheduled Activities, SLA Deadline, and Stage. Also, there are sorting and filtering options available in the List View, which help to sort tickets according to their priority, deadline, stage, etc.
2. KANBAN VIEW
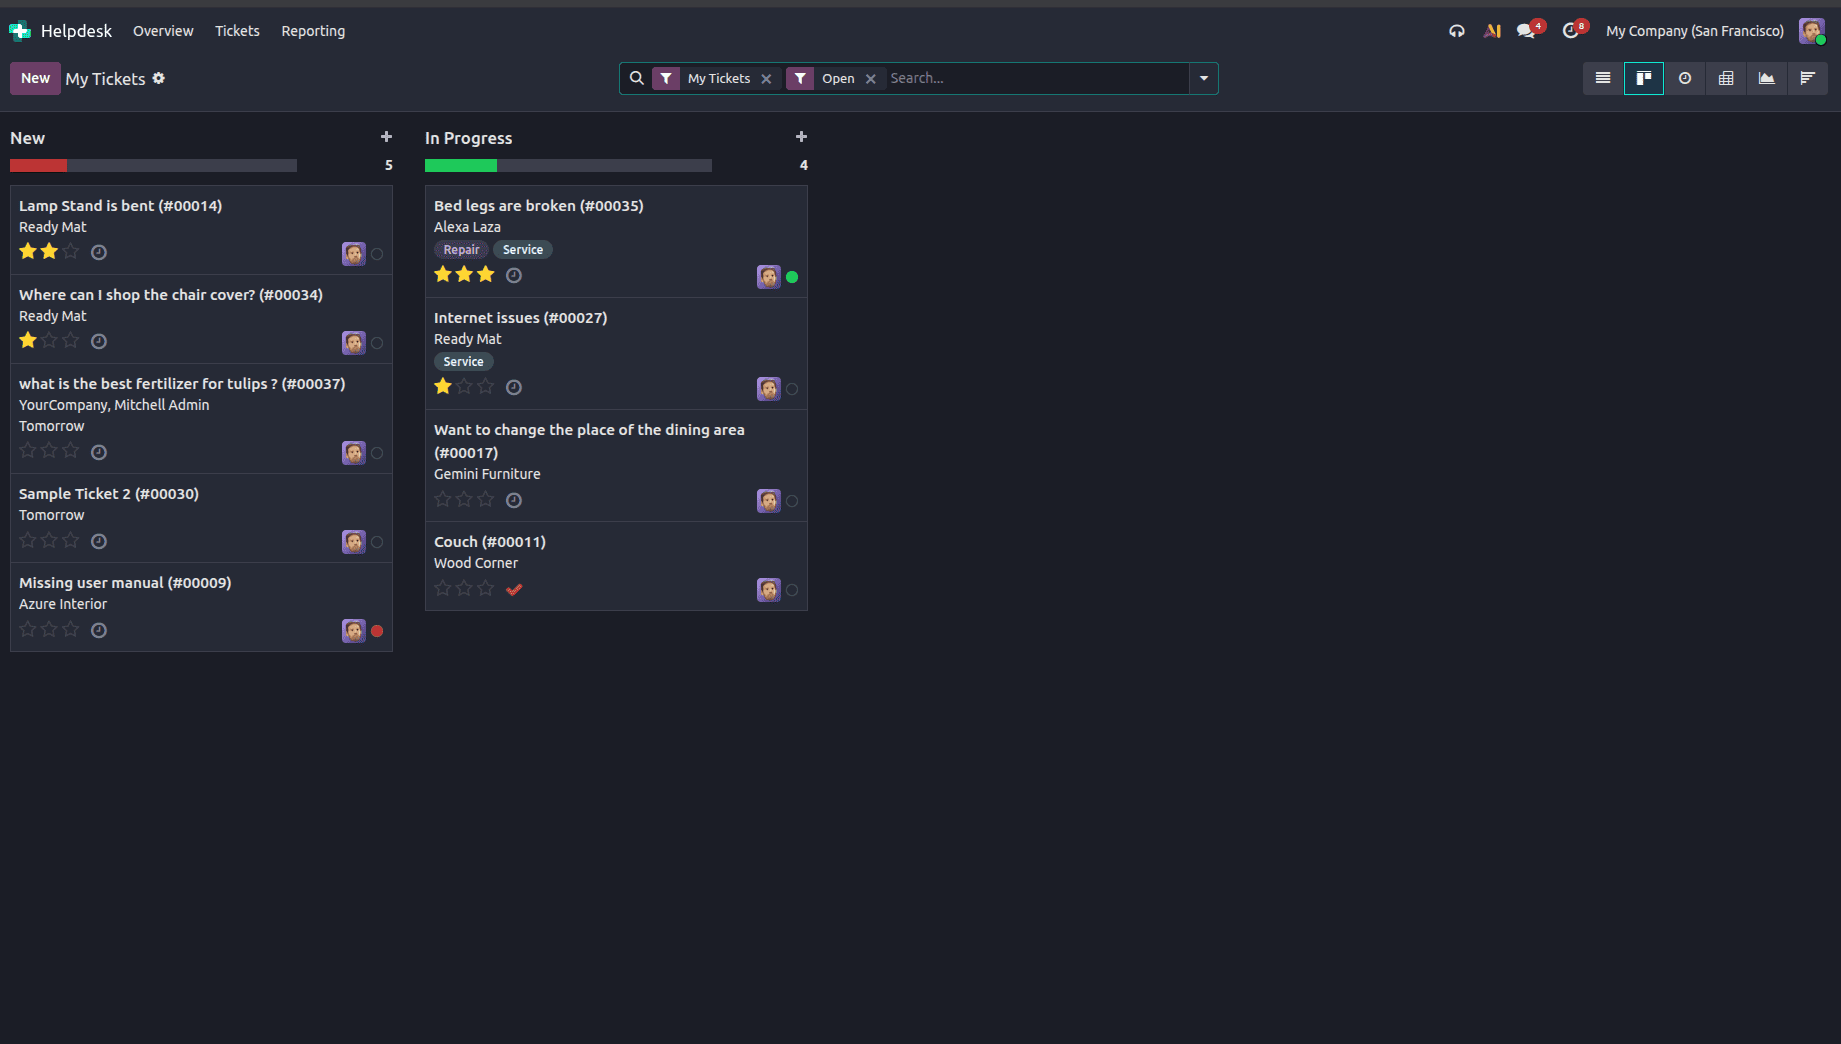
Kanban View from the My Tickets section displays assigned tickets as cards arranged according to the workflow, which consists of steps like New, In Process, and other custom steps. The visual format allows agents to easily see the progress of their tickets and understand their workload in terms of the number of tickets. To change the state of the ticket, the user can just drag and drop the ticket into the desired step. Ticket cards display necessary data about the ticket, such as its title, customer, tags, assigned user, scheduled actions, and SLA deadline. The Kanban View is especially helpful for those who are more comfortable with the visual representation of tickets through stages.
3. ACTIVITY VIEW
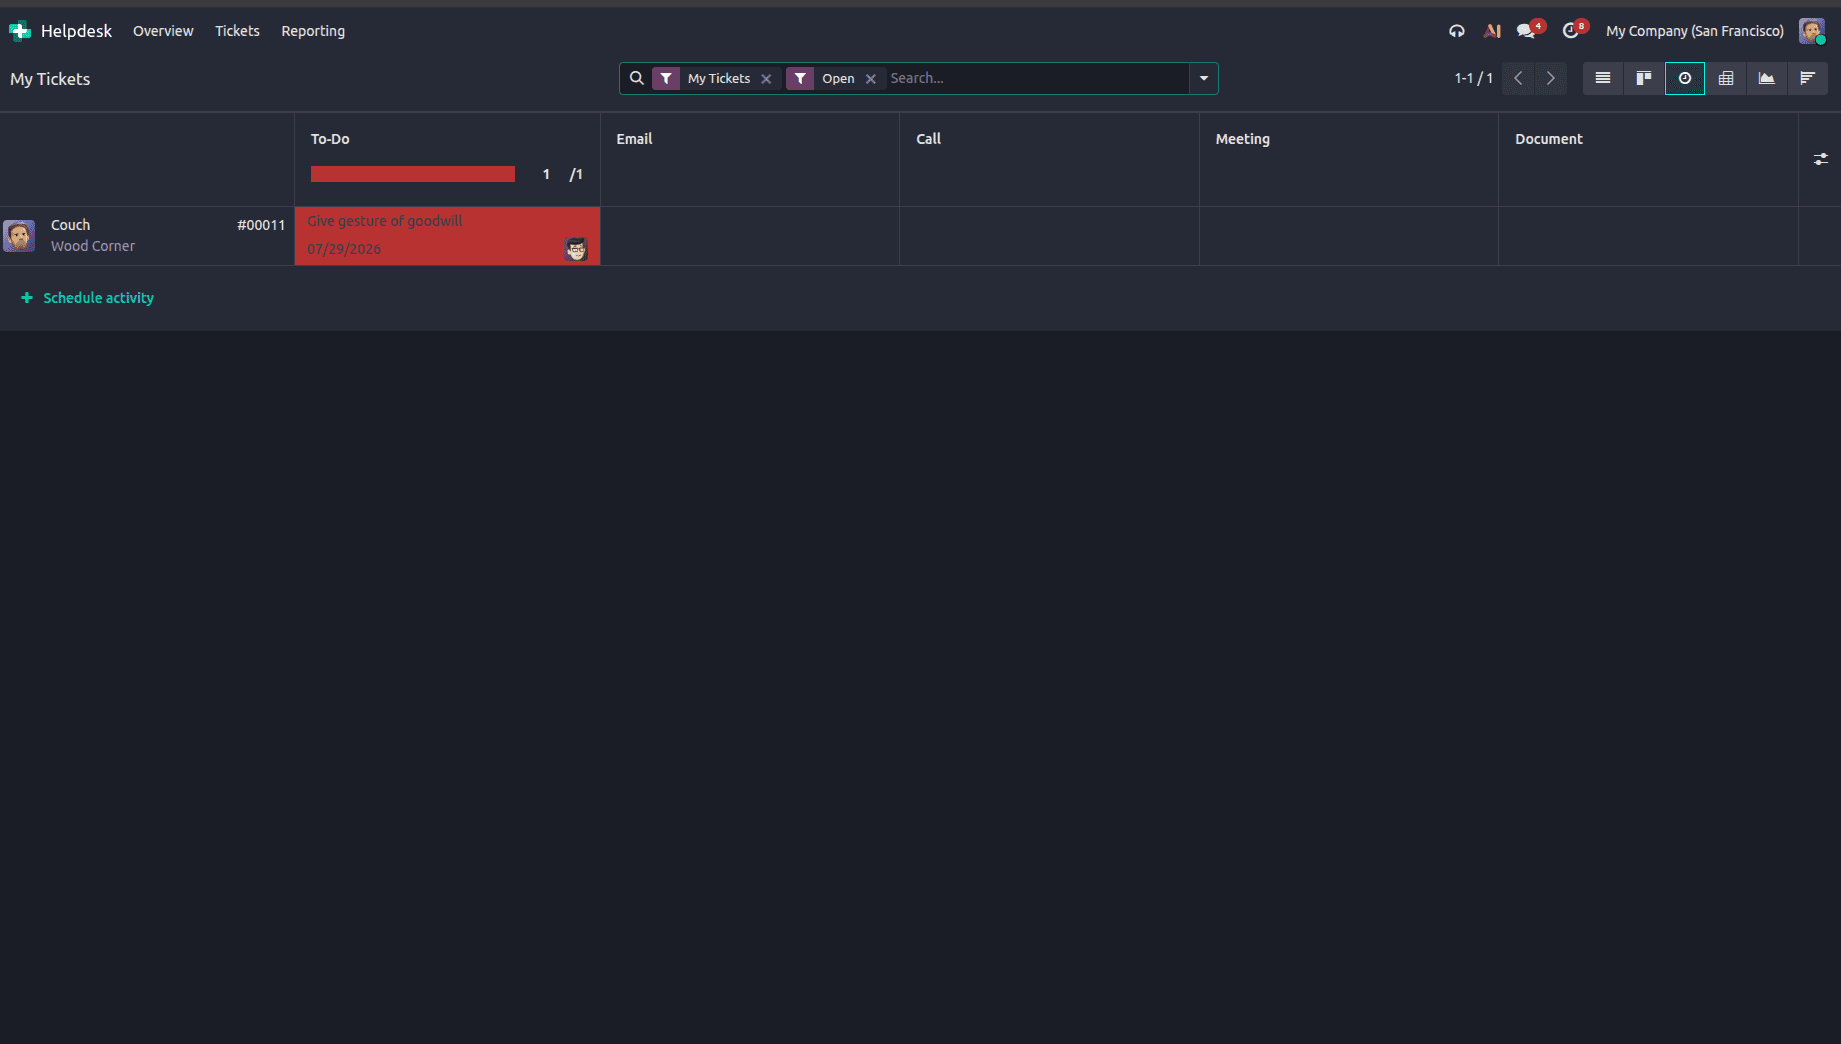
Activity View within the My Tickets feature can be used to help support agents track the activities linked to the tickets that are assigned to them. The activities are divided into tickets; thus, it becomes easier to know what tasks are pending and take the required follow-up actions. Odoo allows creating different types of activities such as To Do, Email, Call, Meeting, Document, Signature, and Grant Approval. With these activities, organizations can manage customer activities within a single view. There is a color-coding system for the activities depending on whether they are overdue, due today, or they are planned to be carried out in the future.
4. PIVOT VIEW
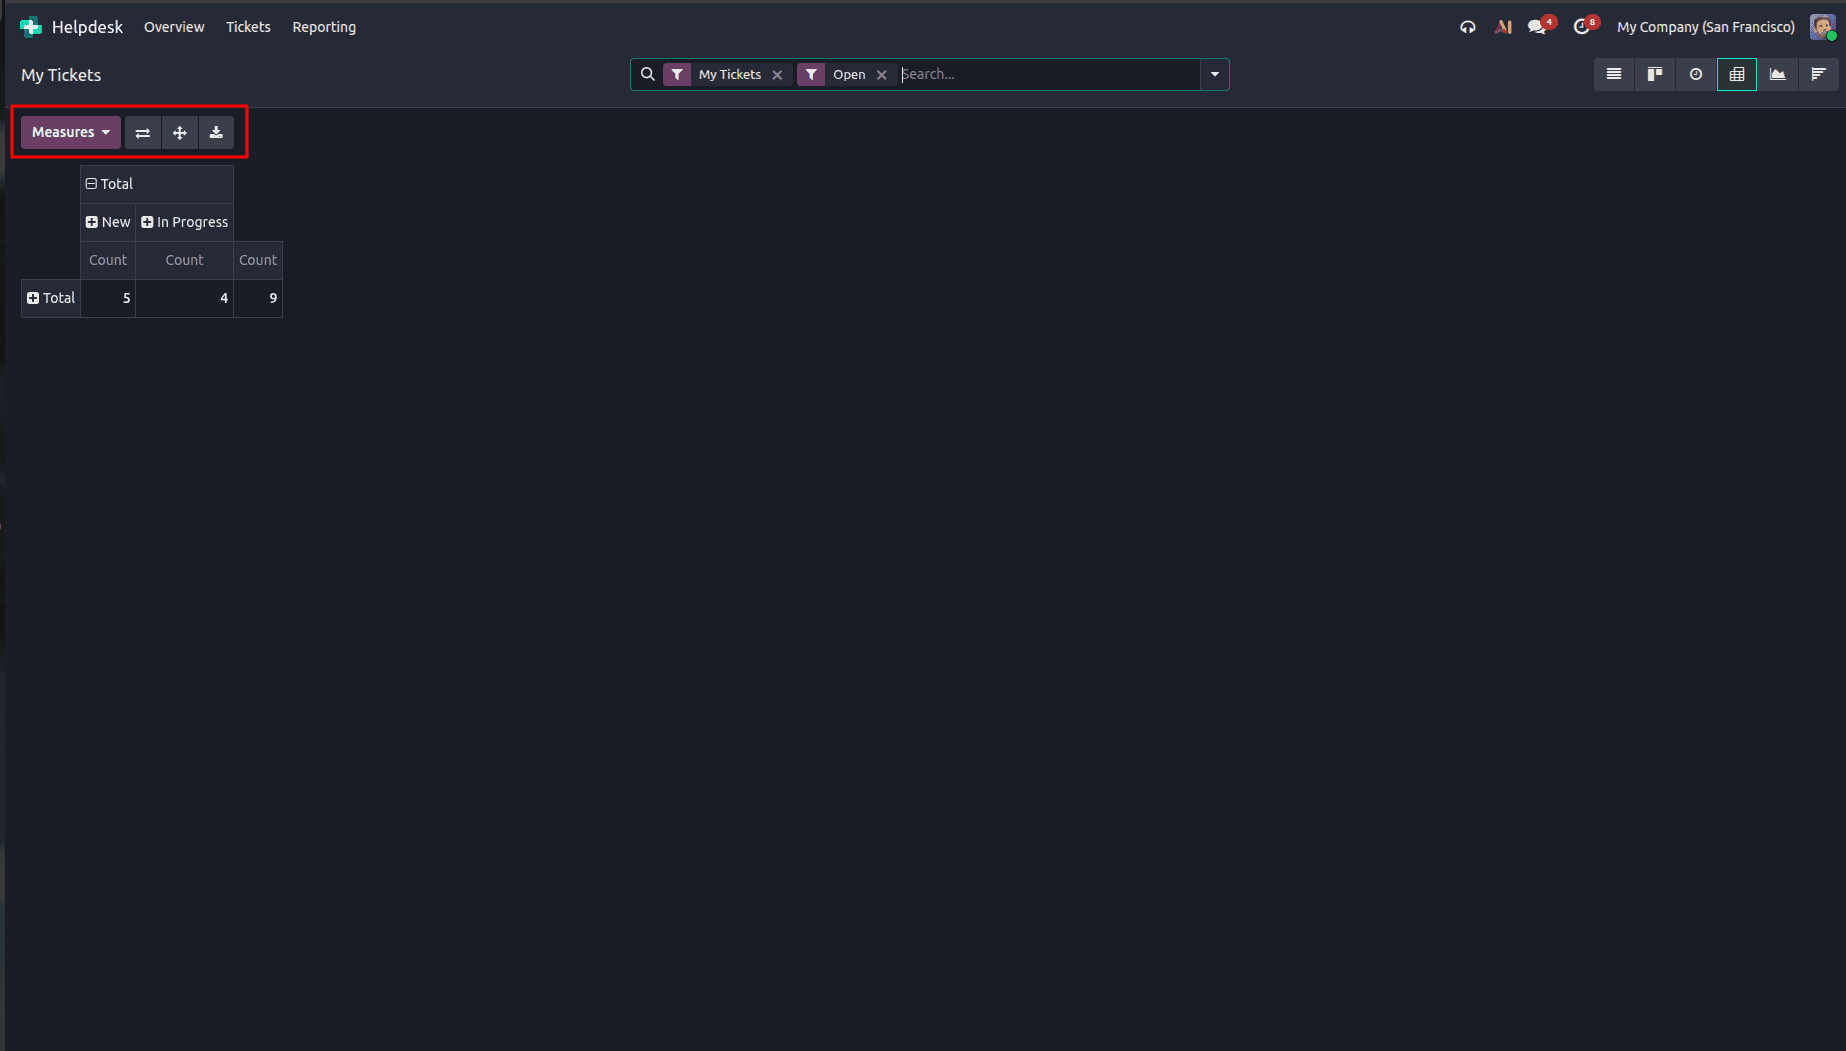
Pivot View in the My Tickets tab offers users an excellent method of analyzing data associated with the tickets that have been assigned to them. Using this tool, users can generate custom reports by analyzing data using fields like 'Assigned To', 'Helpdesk Team', 'Stage', 'Status', 'SLA', 'Tags', 'Priority ', and 'Company'. By utilizing the dynamic arrangement of this tool, users can easily reorganize the data in order to identify trends in their workload and learn more about their performance through tickets.
Different calculations can be used by the user to determine total figures, average figures, and other critical metrics, thus allowing easier analysis of ticket-based information that will help users to know how their workload is allocated, how they are performing, and how they meet SLA targets.
Some of the features available in Pivot View include swapping the rows and columns, ungrouping all the data, exporting the report in XLSX format, and inserting the report in a spreadsheet. This makes it possible to prepare more data-based reports, as well as gain more insight into individual support actions and tickets.
5. GRAPH VIEW
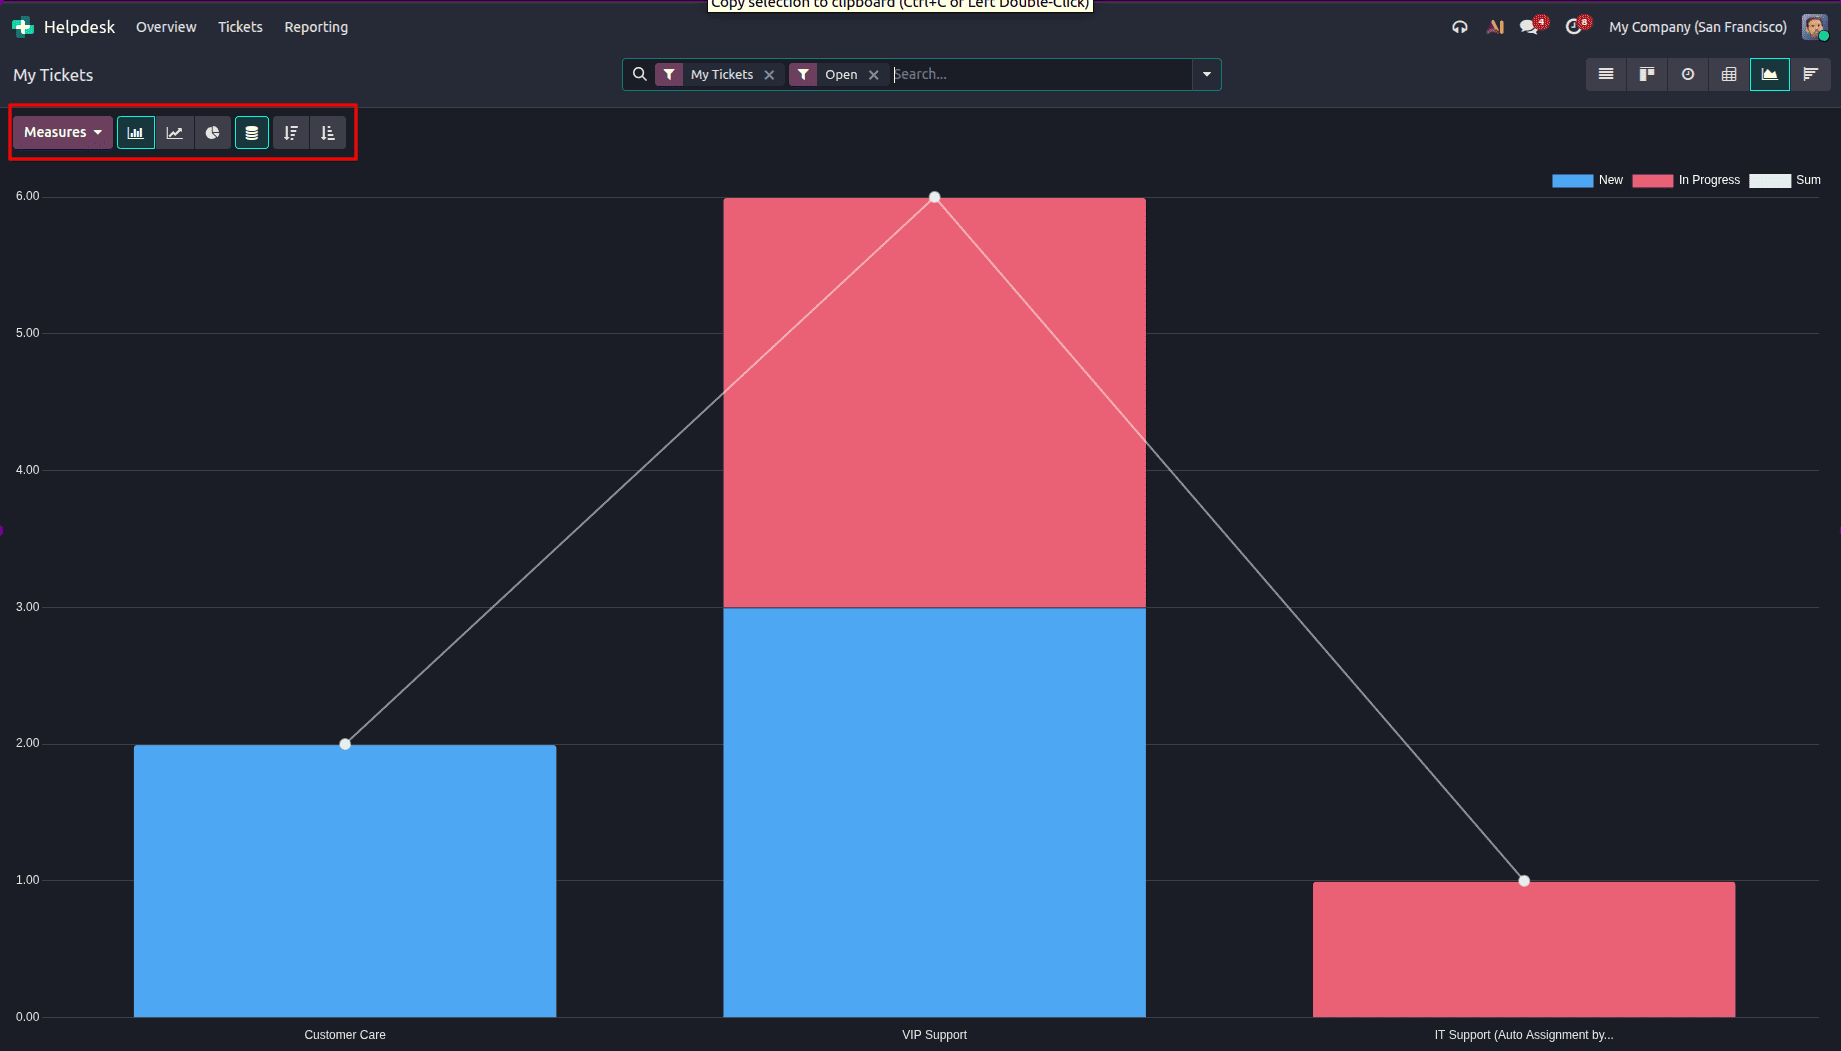
My Tickets - Graph View is a visual depiction of tickets that have been assigned to the current user, which makes it easier to analyze and observe the trends in support activities. Ticket information can be presented through the use of either a bar chart, a line chart, or a pie chart in order to provide an understanding of various metrics such as Ticket Count, Hours Assigned, Time to Resolve Tickets, and SLA Compliance. There are other features that include stacking of charts, sorting, and use of colors for effective visualization of data.
6. COHORT VIEW
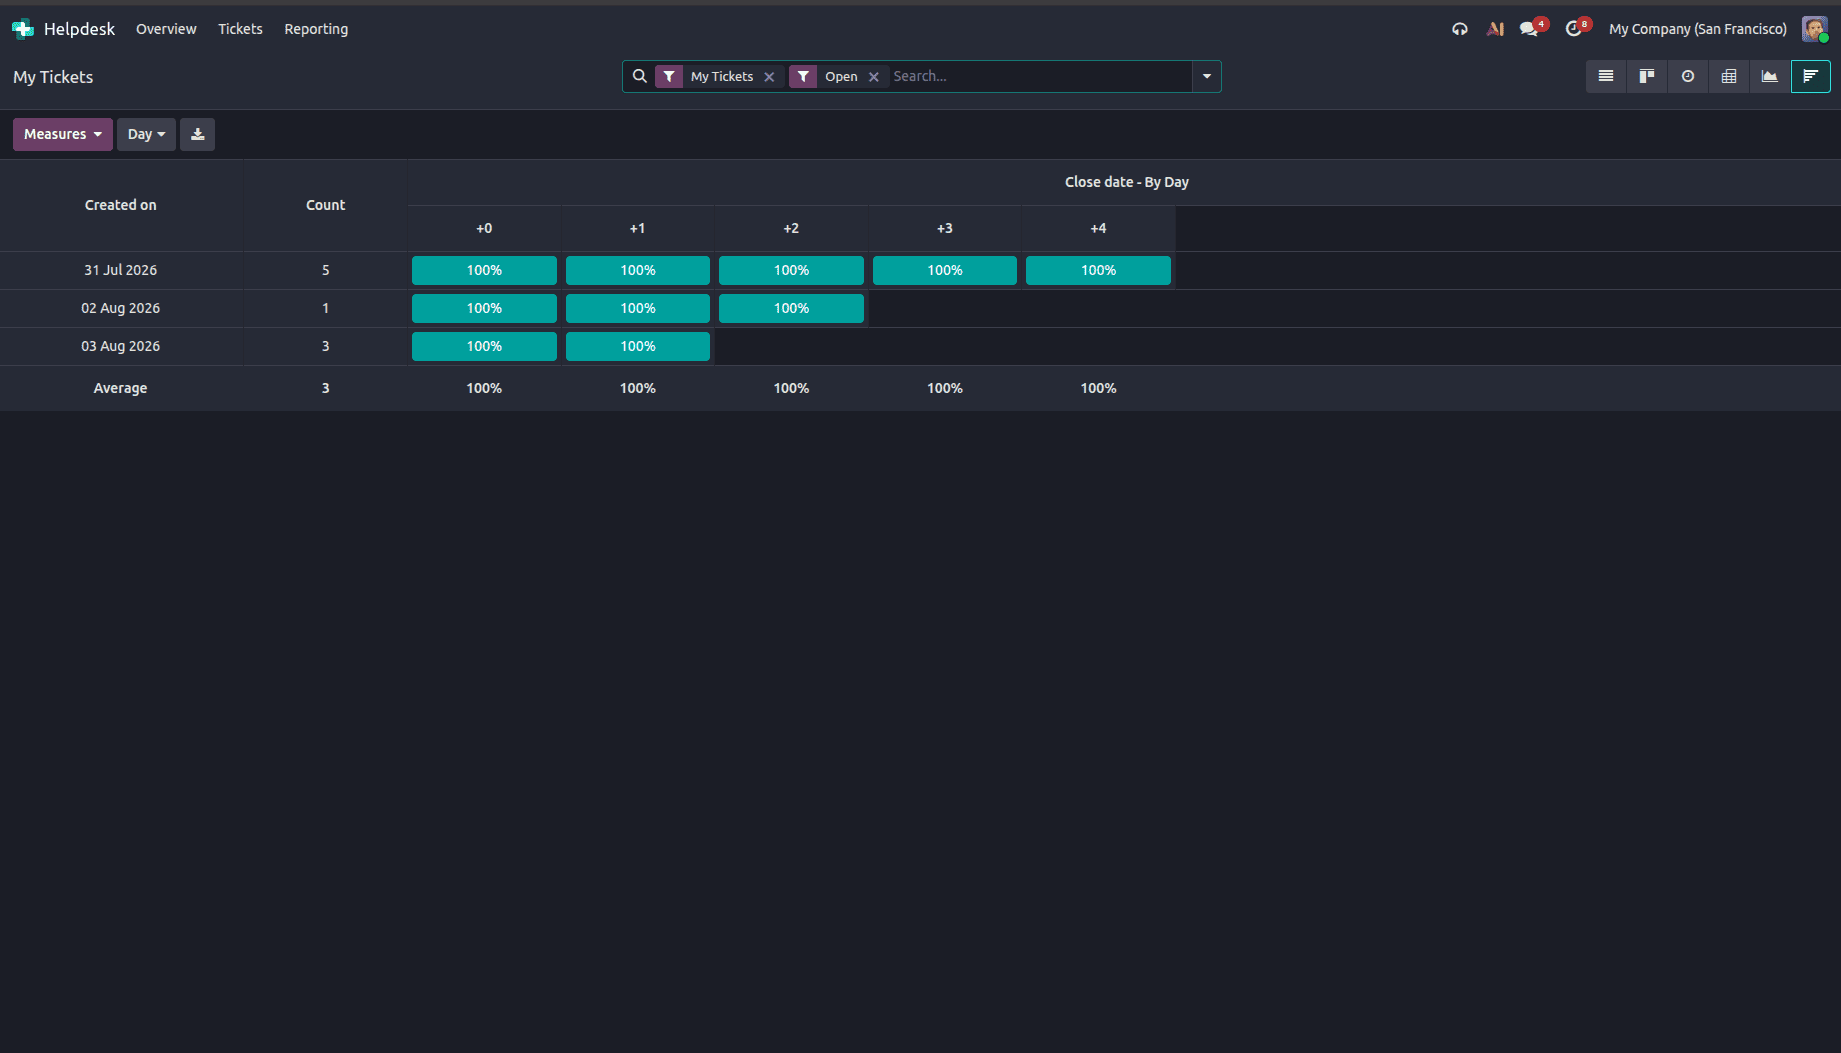
The Cohort view of the “My Tickets” page allows the user to understand the lifecycle of tickets allotted to him/her. The tickets are organized depending on the creation time on a daily, weekly, or monthly basis and how many of them have been resolved or not over a certain period of time. This allows the user to make meaningful observations about the lifecycle of tickets and learn about the areas where he/she can improve his/her ticket management.
The Helpdesk module of Odoo 19 offers a variety of views, including List, Kanban, Activity, Pivot, Graph, and Cohort, that make it easier for the support team to manage and track their tickets. These views are used for different purposes, such as allowing the support agent to concentrate on their assigned tickets via the My Tickets tab or giving the manager an overview of the whole support process via the All Tickets tab. Through Odoo 19, businesses are able to have all the tools required to achieve efficient support.
To read more about Overview of Views in Odoo 18 Helpdesk Ticket, refer to our blog Overview of Views in Odoo 18 Helpdesk Ticket.