Reporting
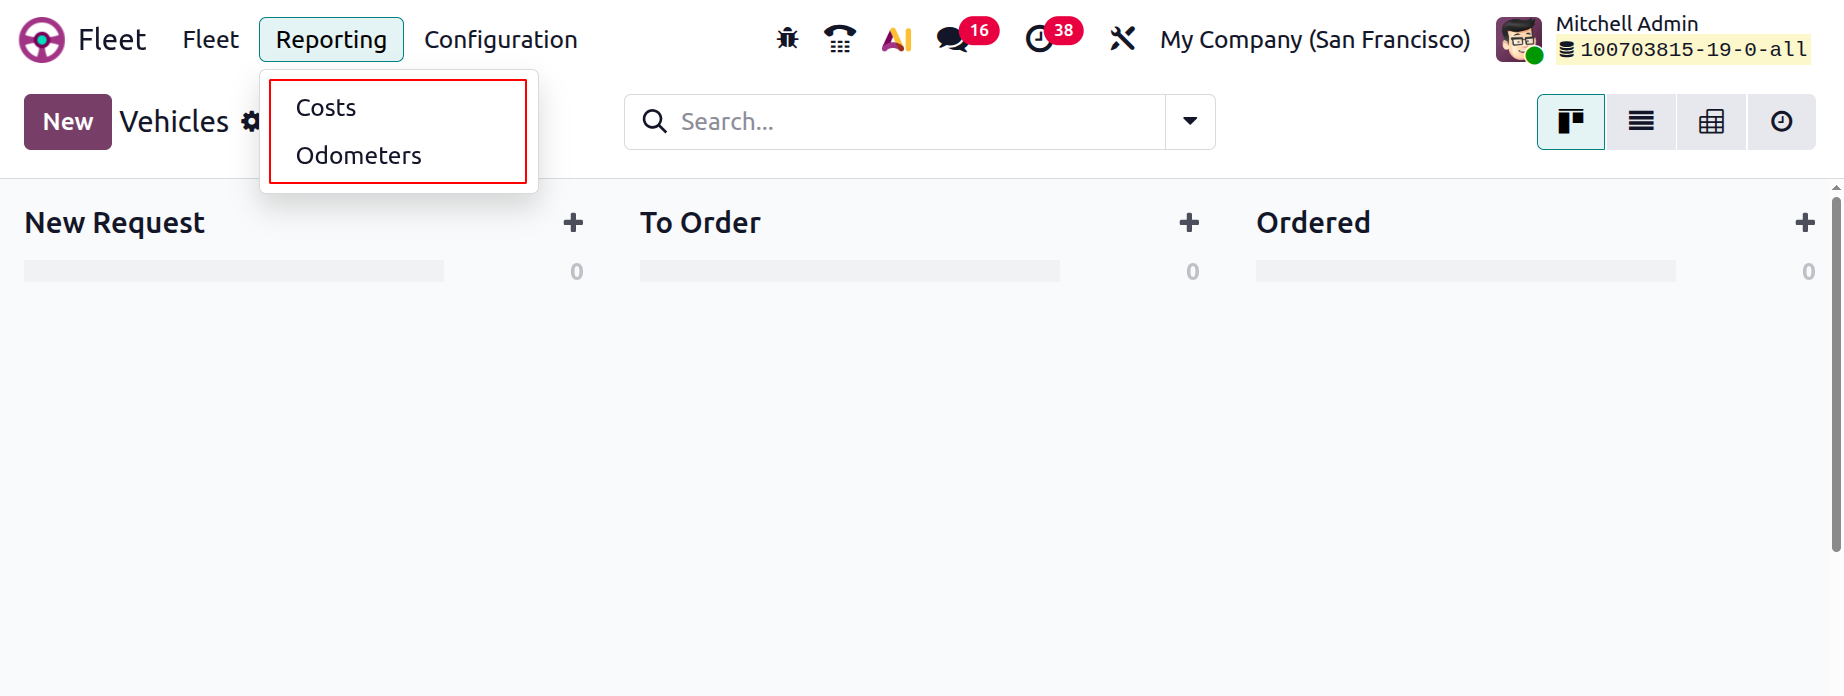
The Reporting menu of the Odoo 19 Fleet Module provides two reporting options including Cost Analysis and Odometers.
Cost Analysis
The Fleet module includes a Reporting menu that provides access to Cost Analysis reports. These reports can be viewed in graphical or pivot formats, offering valuable insights into service and operational costs. Typically, the X-axis represents time periods, while the Y-axis displays cost values, as shown in the screenshot below.
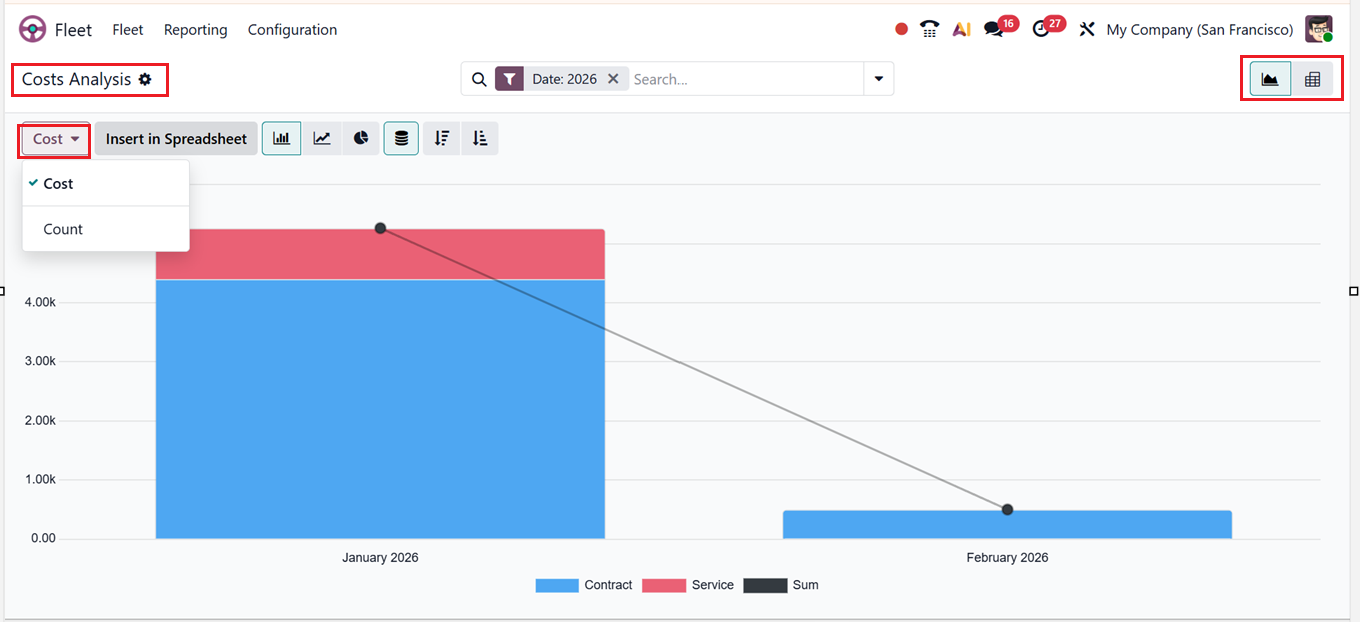
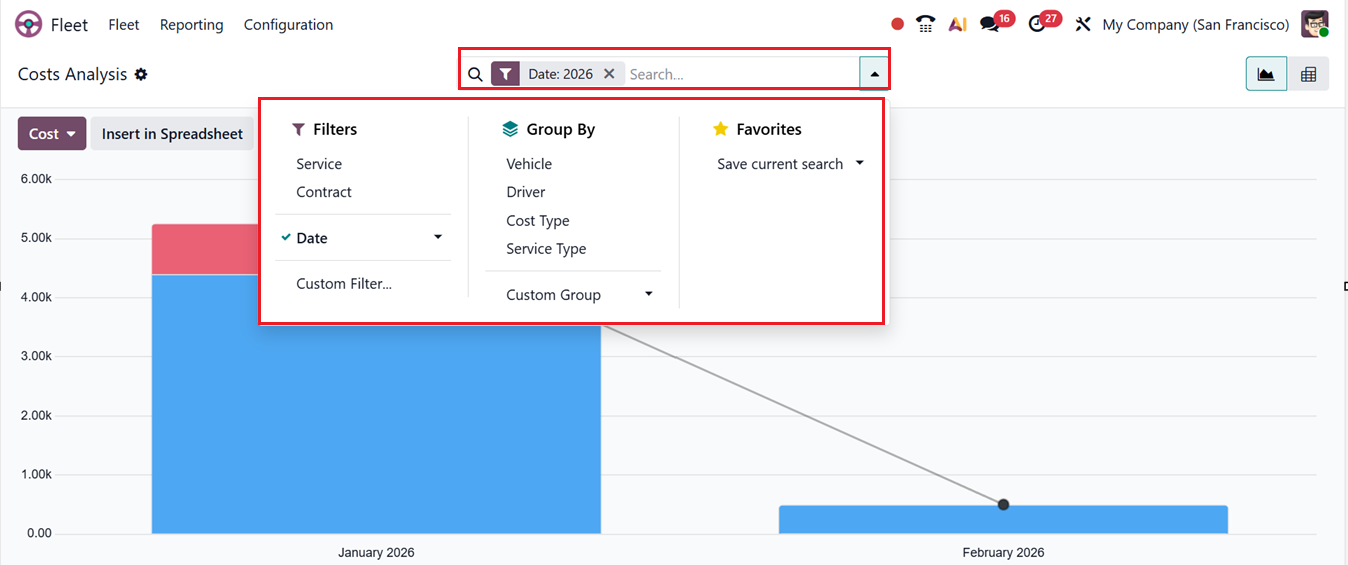
Here, you can analyze metrics such as total Cost and record Count using the Measures option. Using the ‘Filters’ and ‘Group-By’ tools provided in the search bar area, you can customize reports and compare costs across different time frames. Also, you can create customized filters and groups using the ‘Custom Filter’ and ‘Custom Group’ options. Finally, the frequently used report configurations can be saved using the Favorites option.
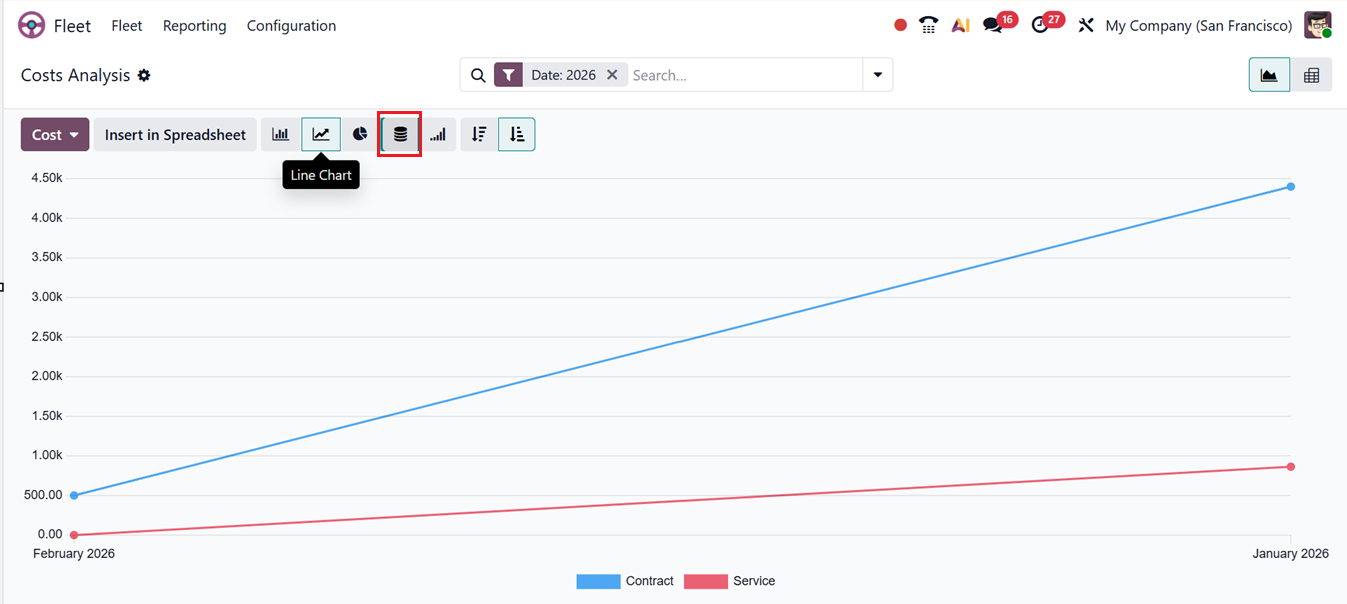
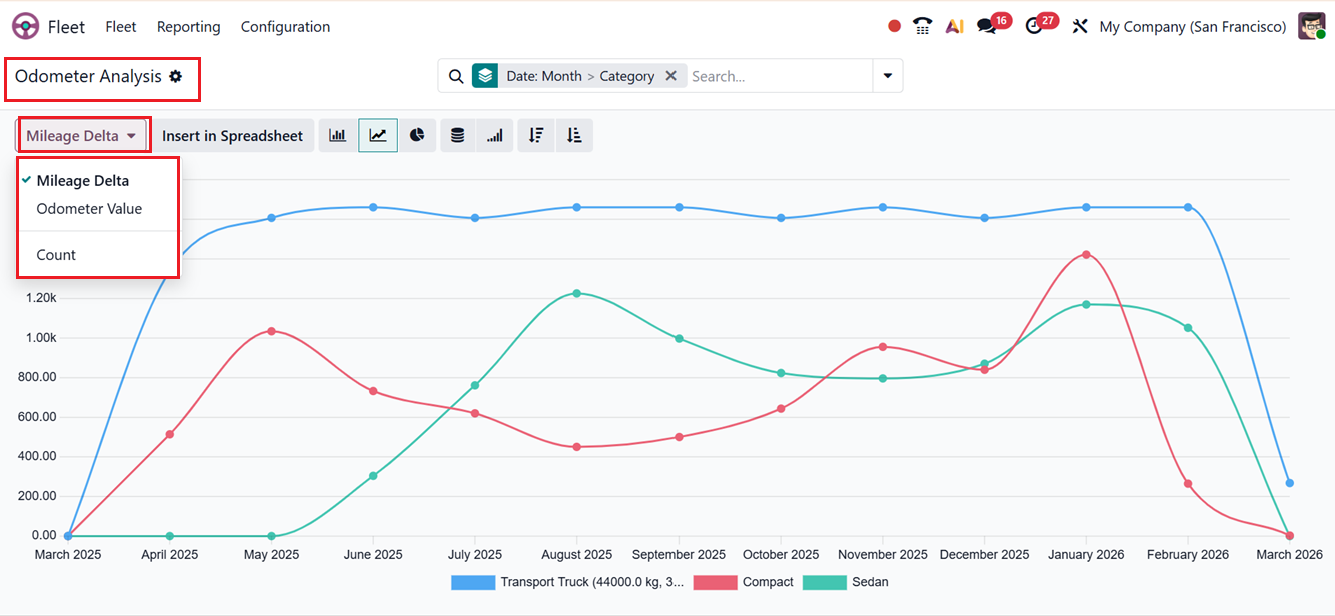
In Odoo 19 reporting, different graphical views including Bar Chart, Line Chart, Pie Chart, Ascending/Descending sorting, and Stacked views help users visualize and analyze data effectively. For example, sorting data in line charts track trends over time, highlighting the contract or service costs for each month of a year, as shown in the screenshot below.
The Pivot View within Cost Analysis enables dynamic data exploration through expandable axes, allowing users to drill down into specific expenses, departments, or vehicle-related costs. With customizable measures and filters, users can gain deeper insights into fleet expenditures.
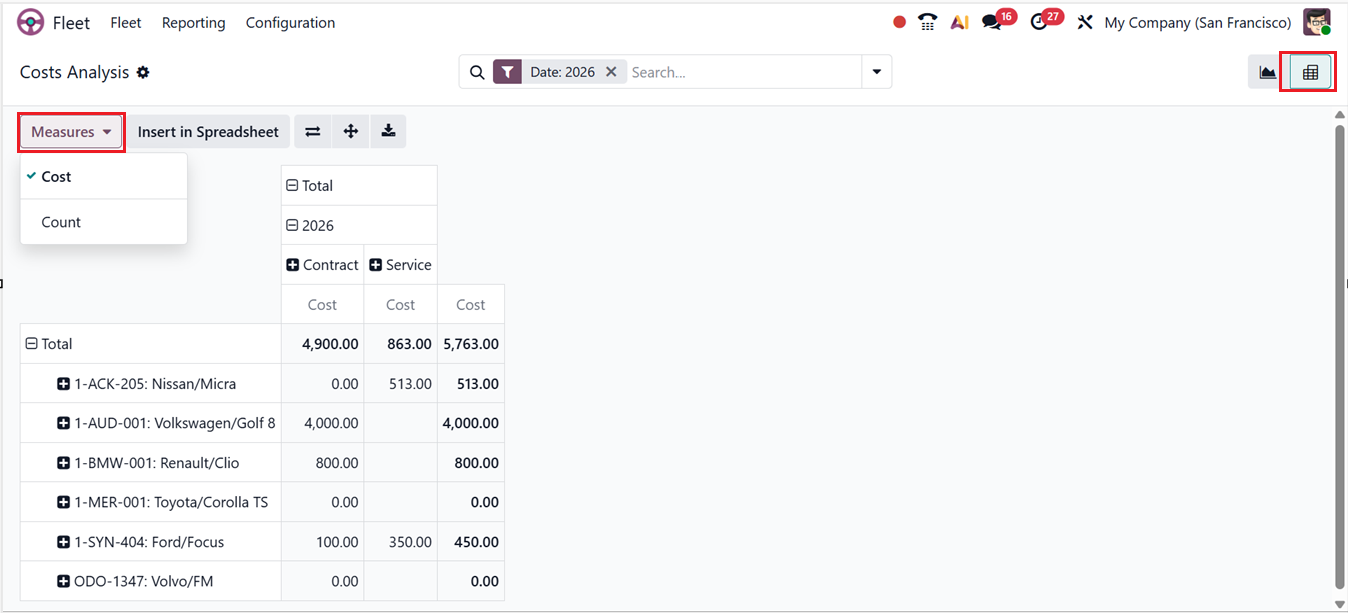
From the Reporting window, the Flip Axis button swaps rows and columns to view data differently, Expand All shows detailed breakdowns of grouped data and the Download XLSX exports the report to Excel for offline use. Finally, the Insert in Spreadsheet button can be used to send the data to an Odoo spreadsheet for further analysis and visualization within the platform.
Odometers
The Odometer Analysis reporting window in Odoo 19 Fleet lets fleet managers track and analyze vehicle usage through odometer readings. It provides a graphical view of mileage by vehicle and month, helping identify usage trends and anomalies. Using the Measures section, you can switch between Odometer Value (actual readings), Mileage Delta (change in mileage), and Count (number of entries), as shown in the screenshot below.
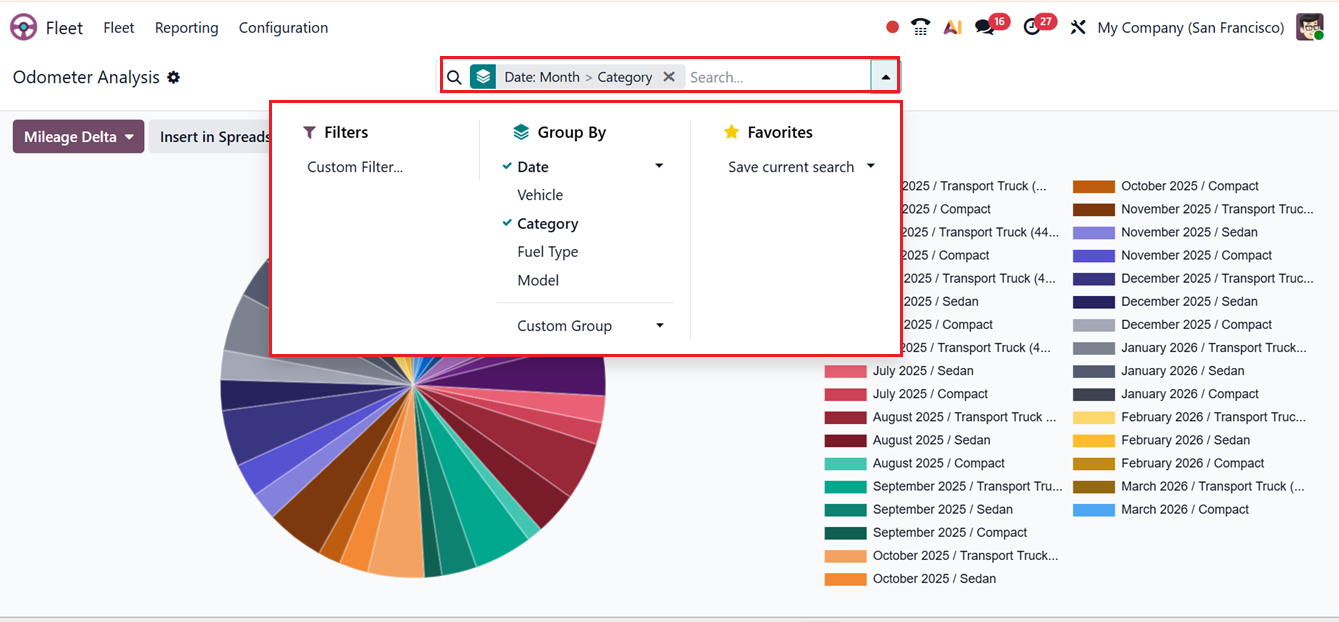
Using the Filters and Group-By tools in the search bar, you can customize reports, compare costs over time, and create custom filters and groups. Frequently used configurations can be saved with Favorites. You can also switch between Bar, Line, Pie, Ascending/Descending, and Stacked views to visualize and analyze data more effectively.
The tool also supports maintenance planning by linking mileage data with service schedules to ensure timely upkeep and prevent overuse or breakdowns.
Overall, the Fleet Management module in Odoo 19 is a robust and efficient solution for managing company vehicles. It simplifies fleet operations such as fuel monitoring, service scheduling, driver assignments, and contract management while integrating seamlessly with other Odoo modules. Automation features, including alerts for maintenance and contract renewals, further enhance efficiency. By consolidating all fleet-related activities into a single platform, businesses can optimize operations, reduce costs, and maintain better control over their vehicle assets.