Reporting
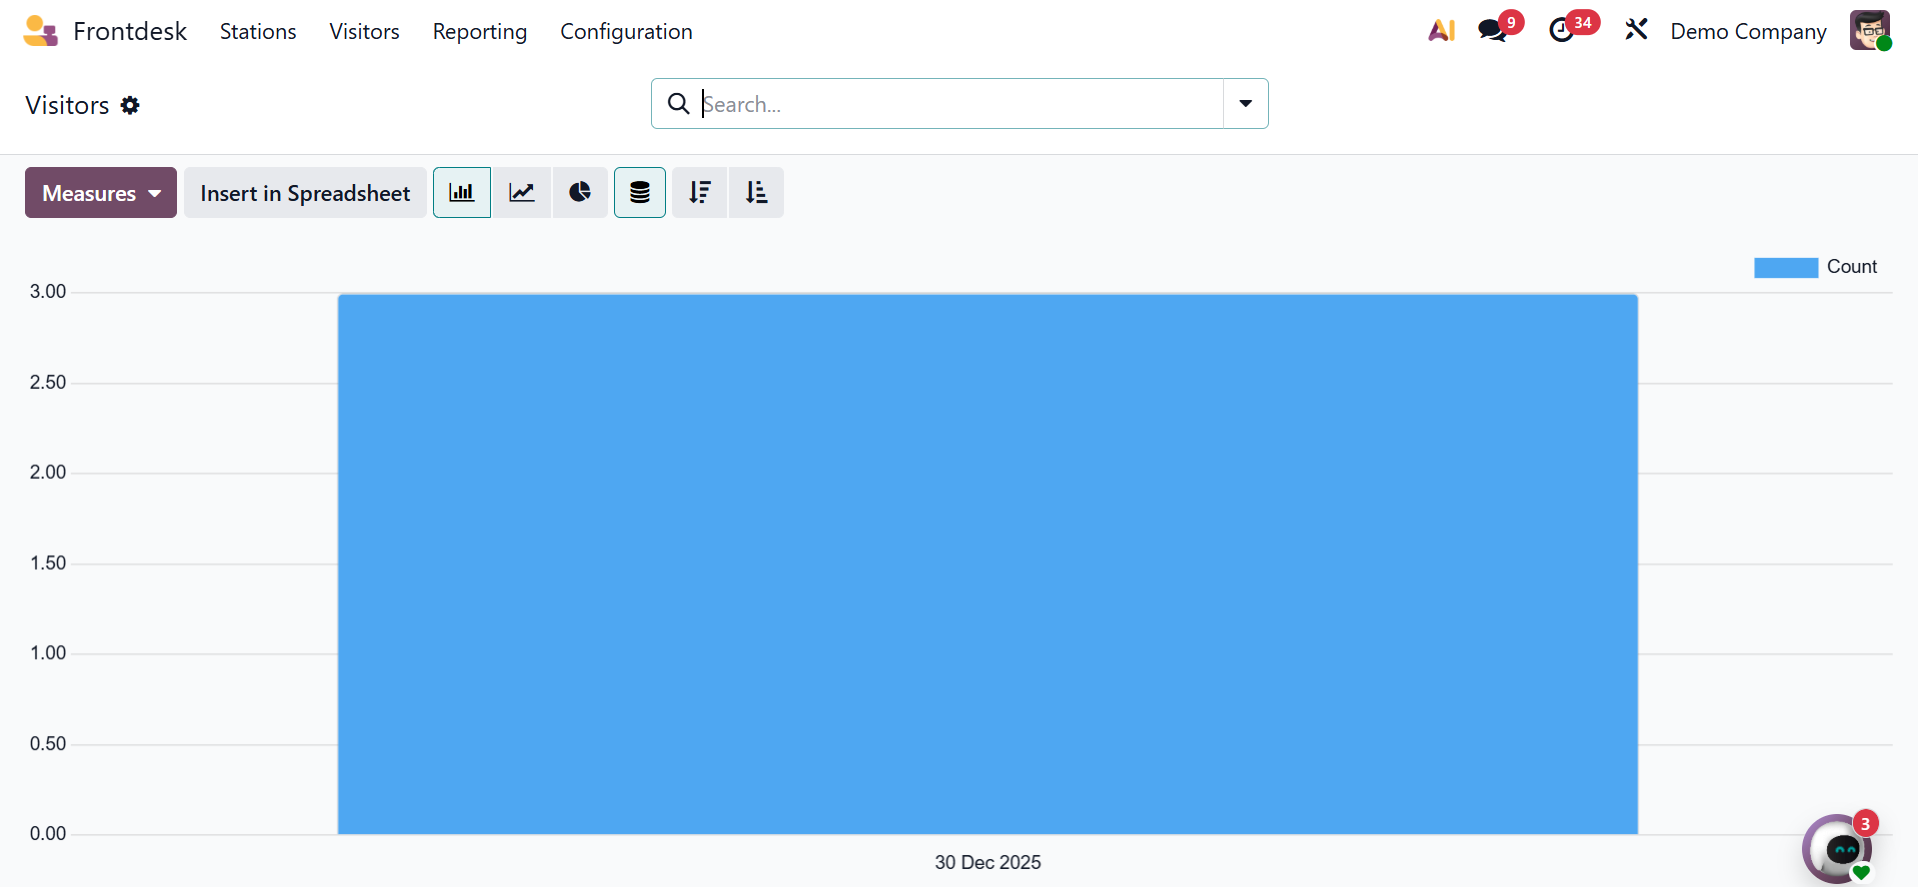
Visitors are included in the first report. The monthly check-in visits demonstrate how users can use the Measures option to filter the data. This website offers a wide variety of graph forms. Additionally, it can now add data to the spreadsheet.
Consequently, the report makes it simple to look at the drinks that the company uses. Users may use the Drinks report for this purpose.
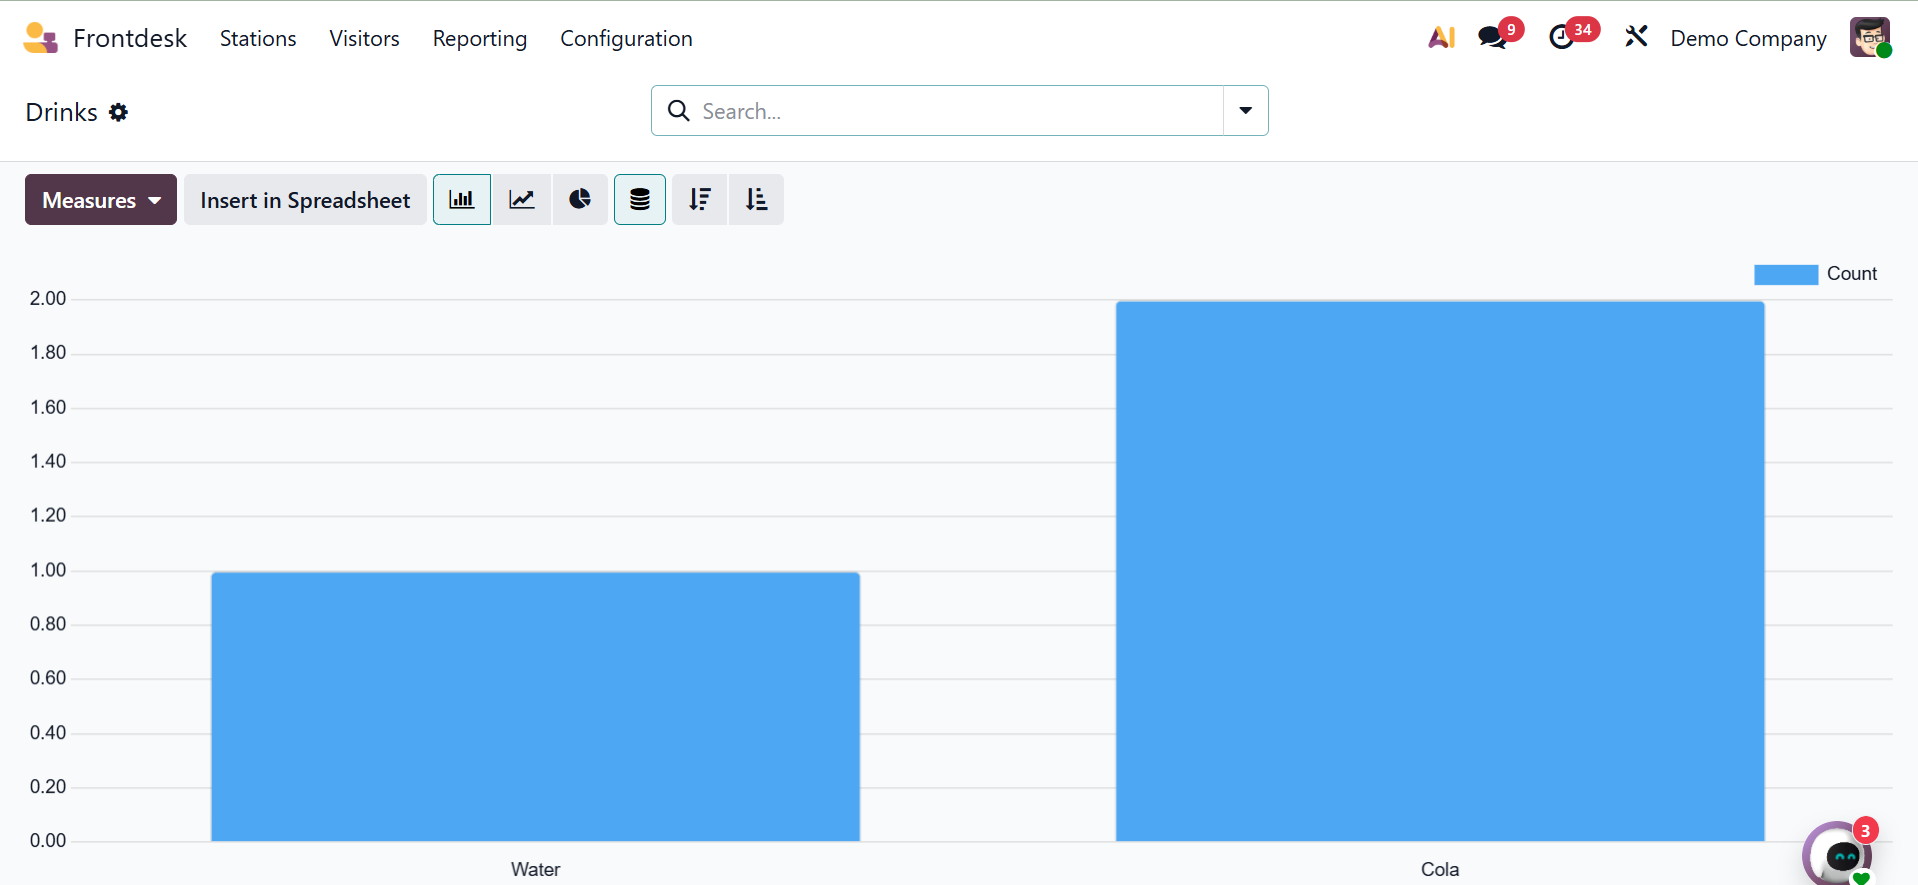
The "Measures" and "Insert In Spreadsheet" options are available. Additionally, as seen in the picture below, you can utilize the group by and filter options offered here.
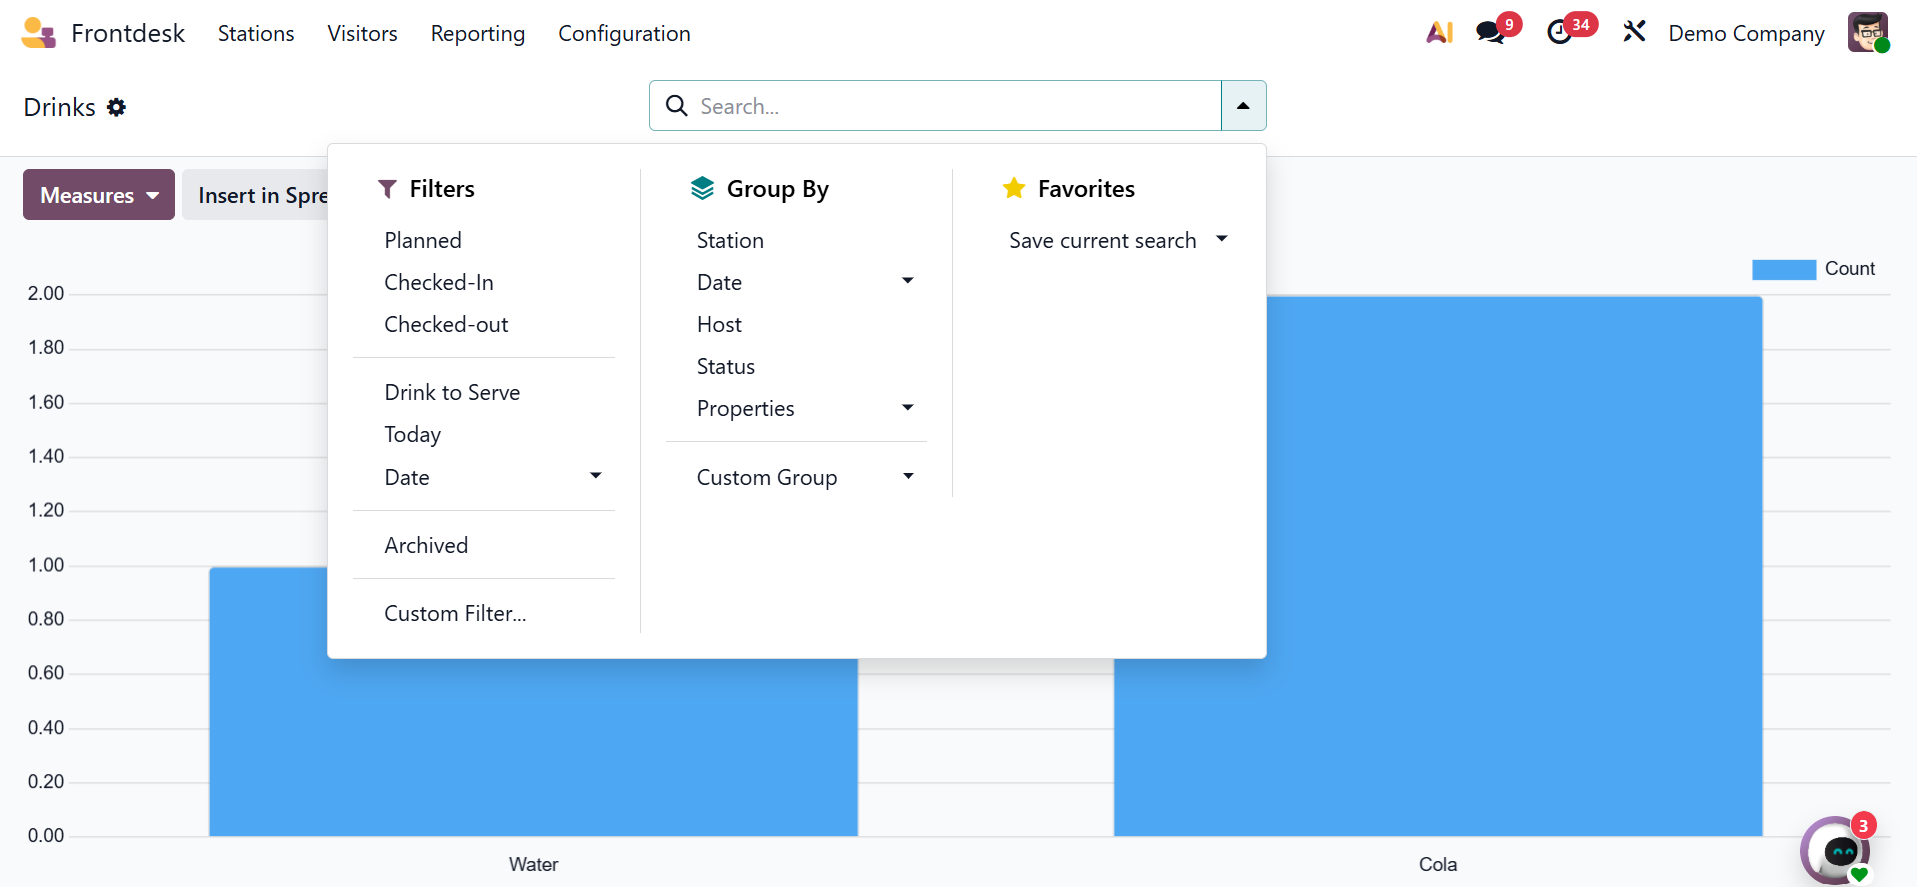
The scheduled, checked in, checked out, drink to serve, today, date, and custom filter are all included in the filters. You can add a custom group and see the station, date, host, and status under the group by. Lastly, you can save the current search along with the favorites option.
These days, any firm can benefit greatly from managing guests with the Front Desk module. The drinks menu, which is easy to manage with this module, also improves customers' perceptions of the business.