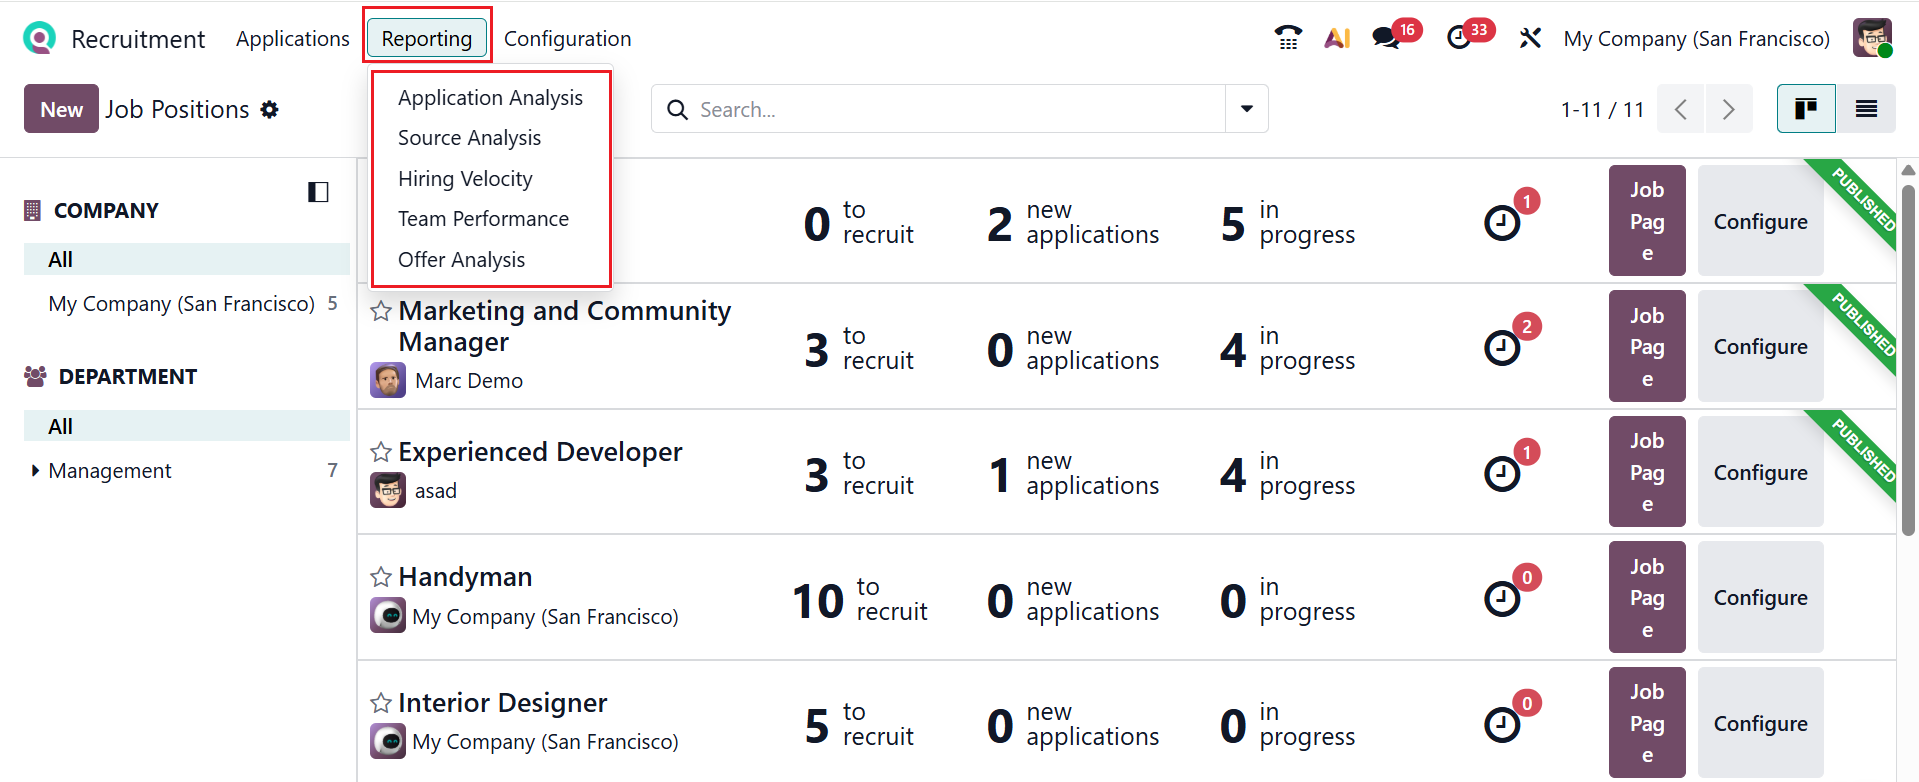
Reporting
In Odoo 19 Recruitment, Reporting provides insights into the hiring process through charts and statistics. It helps recruiters track performance and make better decisions. You can see five types of reporting, such as Applicant Analysis, Source Analysis, Hiring Velocity, Team Performance, and Offer Analysis.
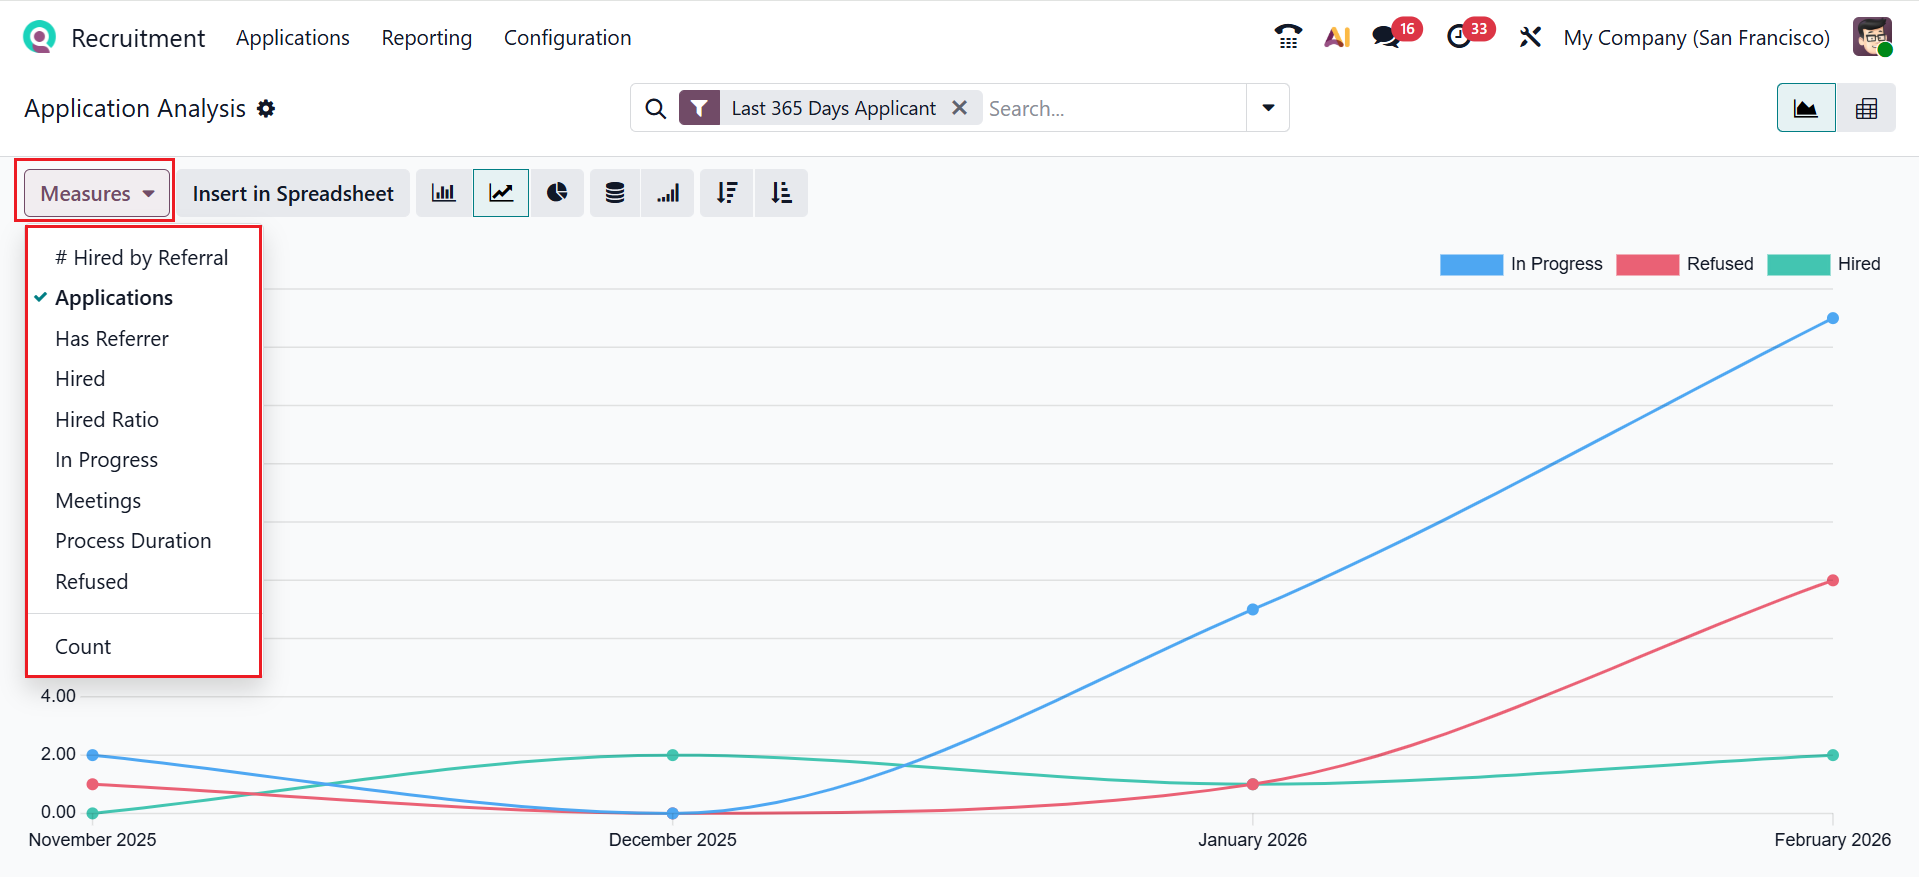
3.1 Applicant Analysis:
In Odoo 19 Recruitment, Applicant Analysis shows data about candidates and their progress through the hiring stages. This enables recruiters to monitor performance and make better-informed decisions. The Application Analysis can be presented using Bar, Line, or Pie charts, with options for Stacked views and sorting in Ascending or Descending order. Here, the graph is arranged based on specific months, and each color represents the application status. By clicking Measures, you can customize reporting metrics, including Applications, Has Referrer, Hired, Hired Ratio, In Progress, Meetings, Process Duration, Refused, and Count, as shown in the screenshot.
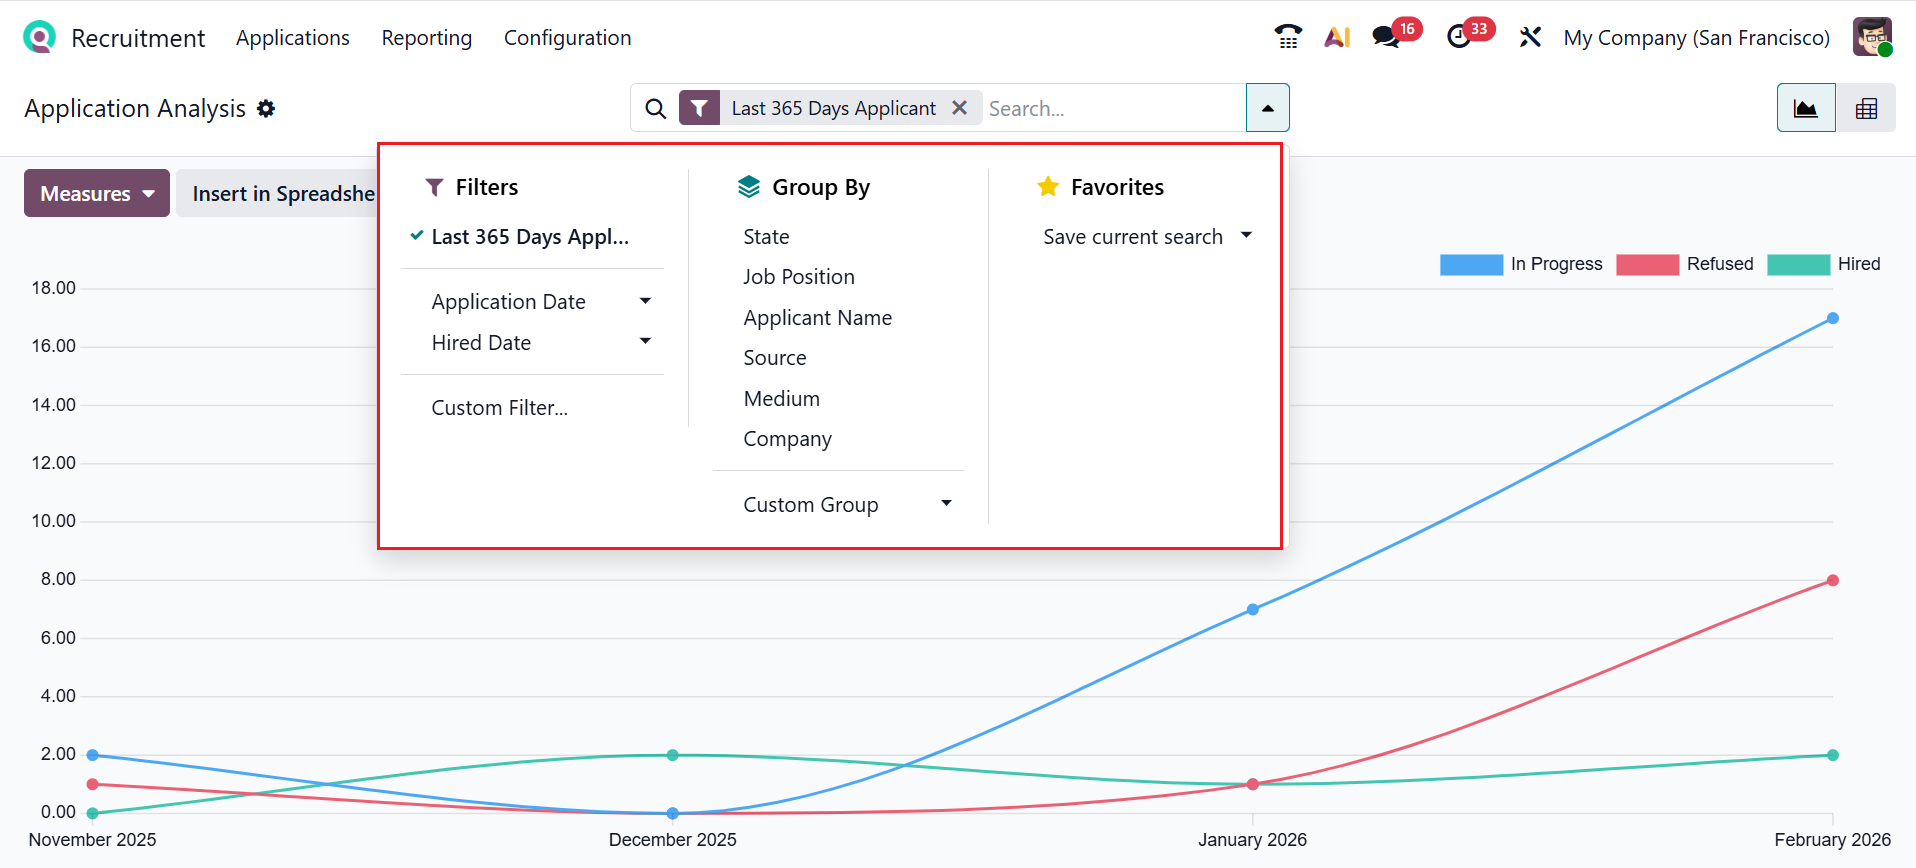
Access Filters, Group By, and Favorites via the search bar drop-down. Apply filters by Last 365 Days Applications, Application Date, or Hired Date, or use Add Custom Filter for personalized filtering. Group data by State, Job Position, Applicant Name, Source, Medium, or Company, or create a custom group. Additionally, you can save your current search criteria using the Favorites option.
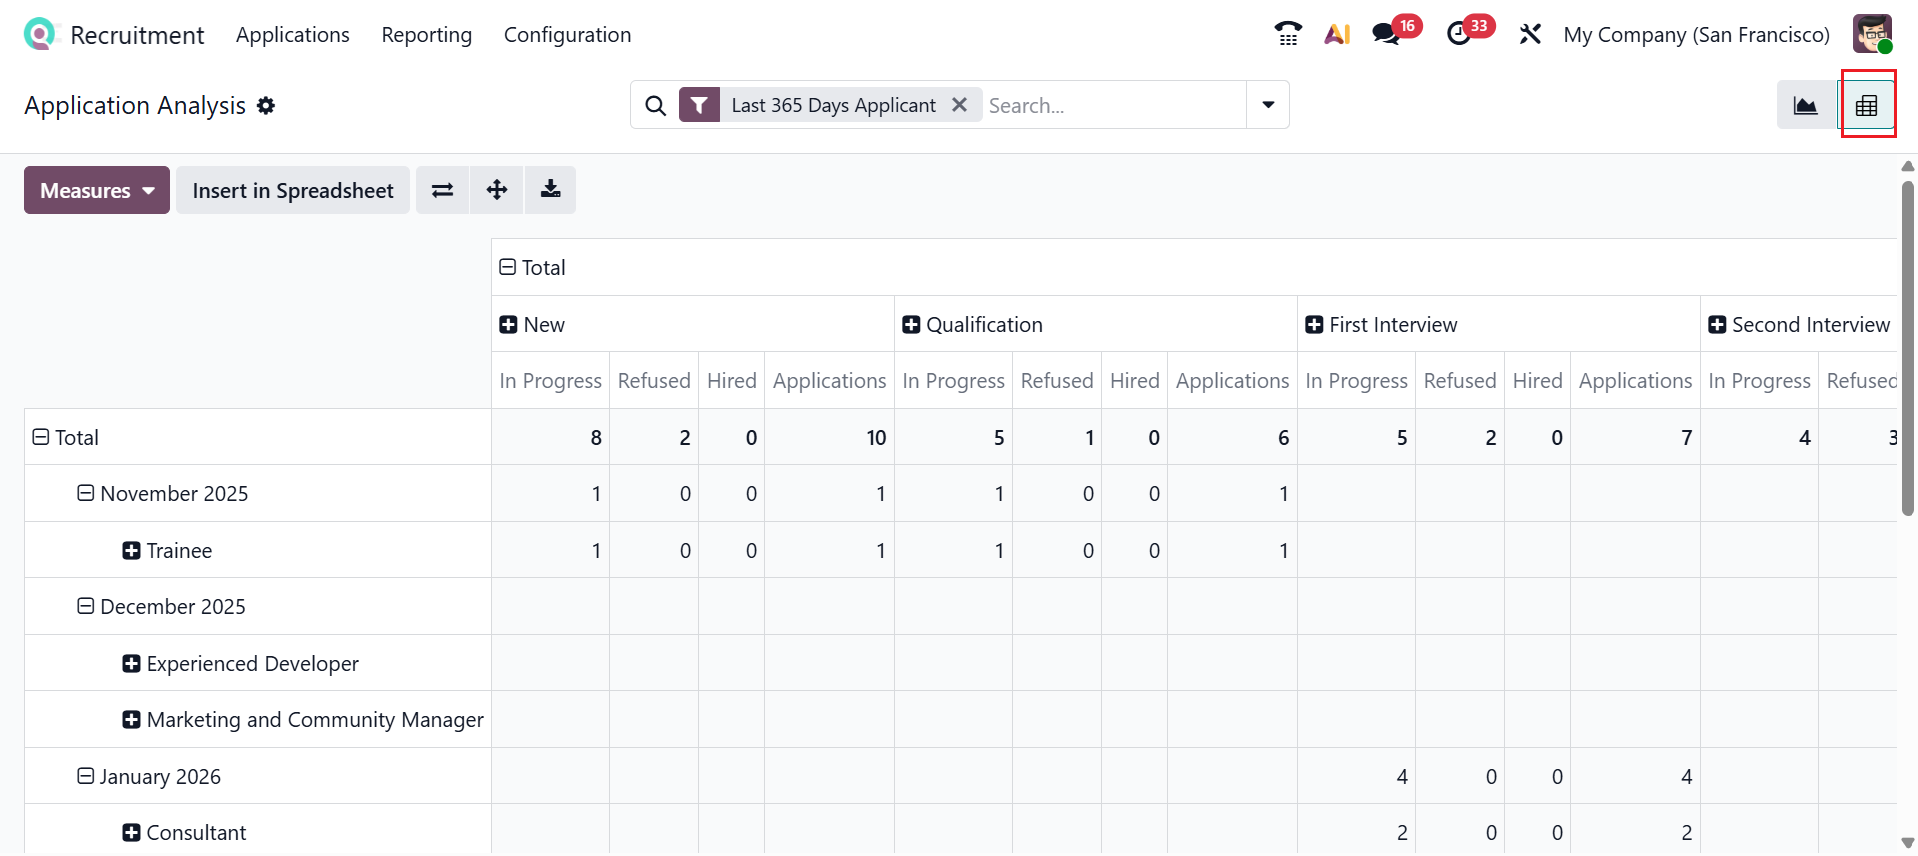
You can also switch the view to Pivot view as needed. Here, the data are arranged in a pivot table. You can group applicants by job, stage, source, or other criteria, and use measures. In the Pivot view, you can get real-time updates and use options to expand axes, flip them, download data, or export it to a spreadsheet. These features support in-depth research and analysis essential for identifying bottlenecks, assessing recruiting channels, and enhancing hiring practices.
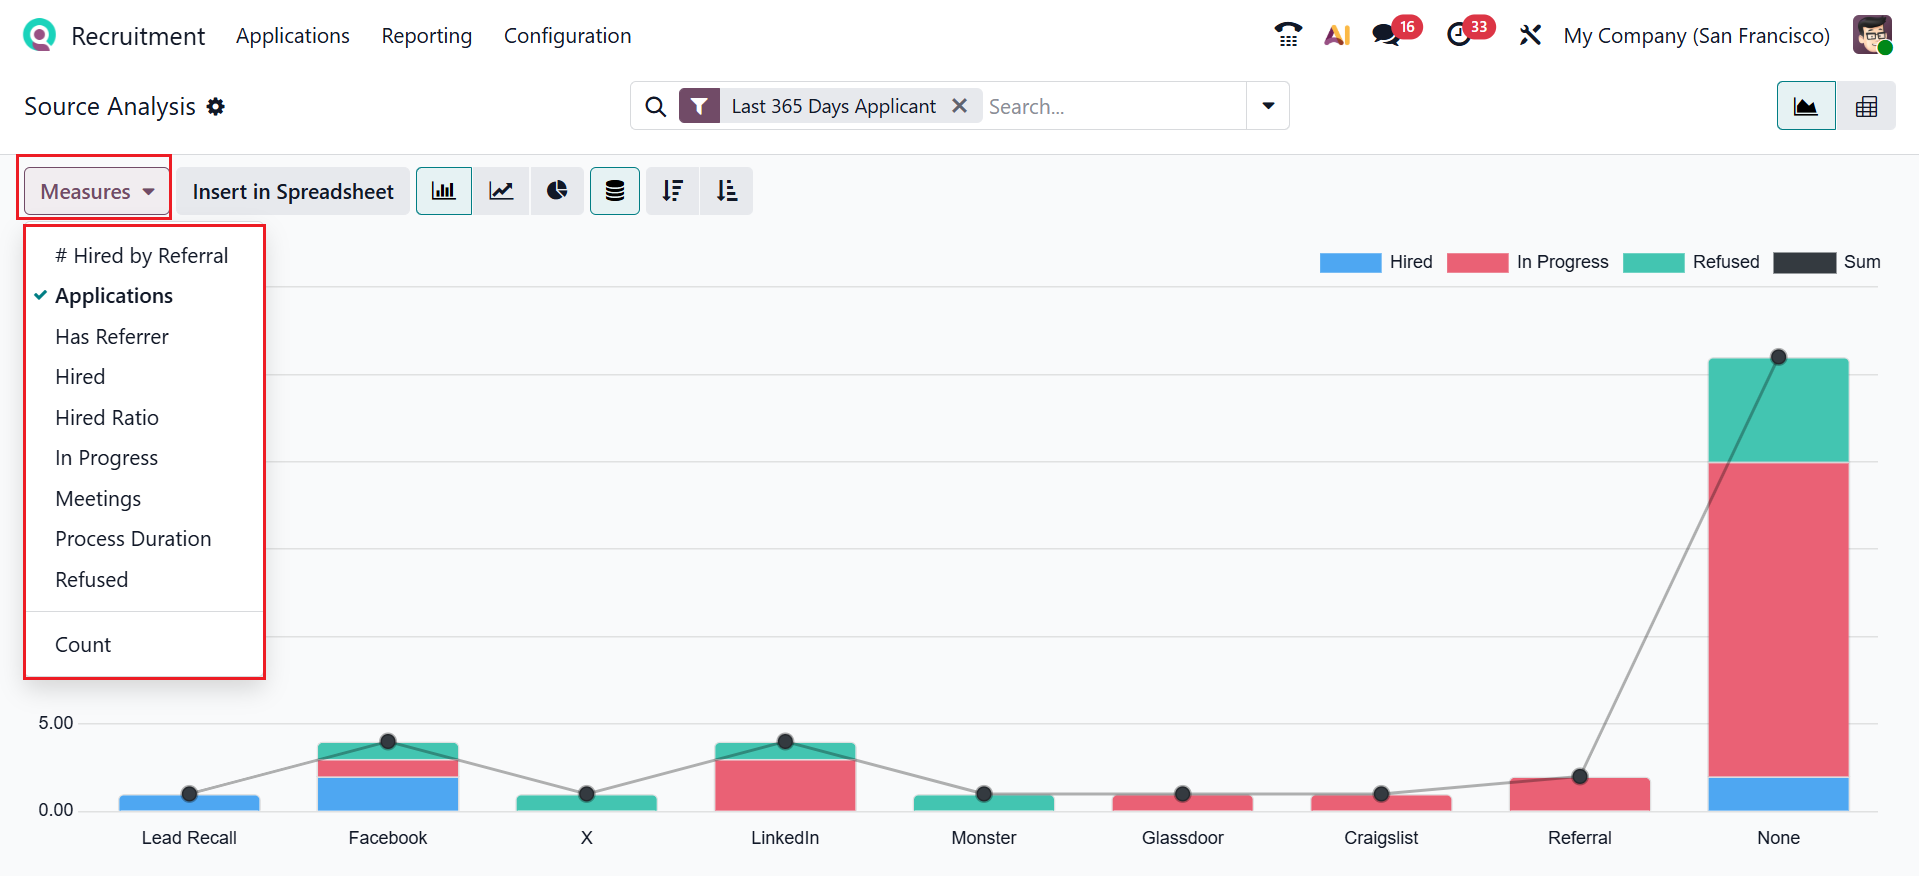
1.2 Source Analysis:
In Odoo 19 Recruitment, Source Analysis shows where applicants come from, such as job websites or referrals. It helps recruiters to identify which is the most effective recruitment source. Here, the Y-axis shows the number of applications, and the X-axis shows different sources. The Measures button allows you to modify reporting metrics, including Applications, Has Referrer, Hired, Hired Ratio, In Progress, Meetings, Process Duration, Refused, and Count, as shown in the screenshot below.
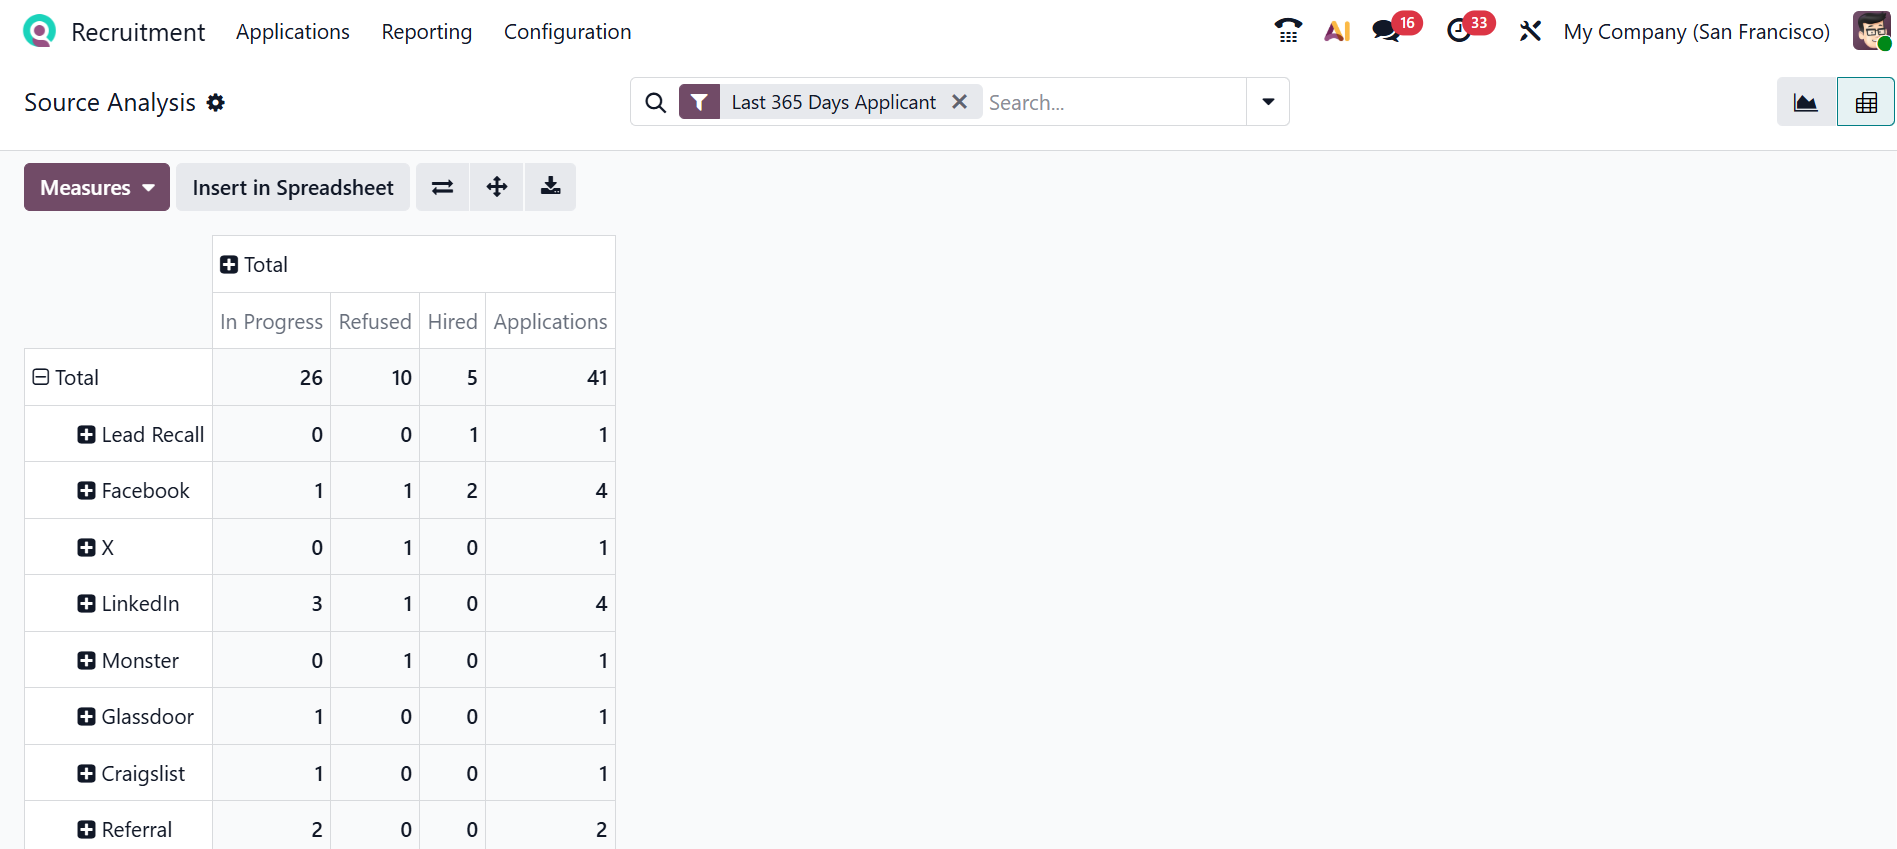
Selecting the Pivot icon presents the data in a pivot table. Here, the rows are populated with sources, and the columns are populated by stages.
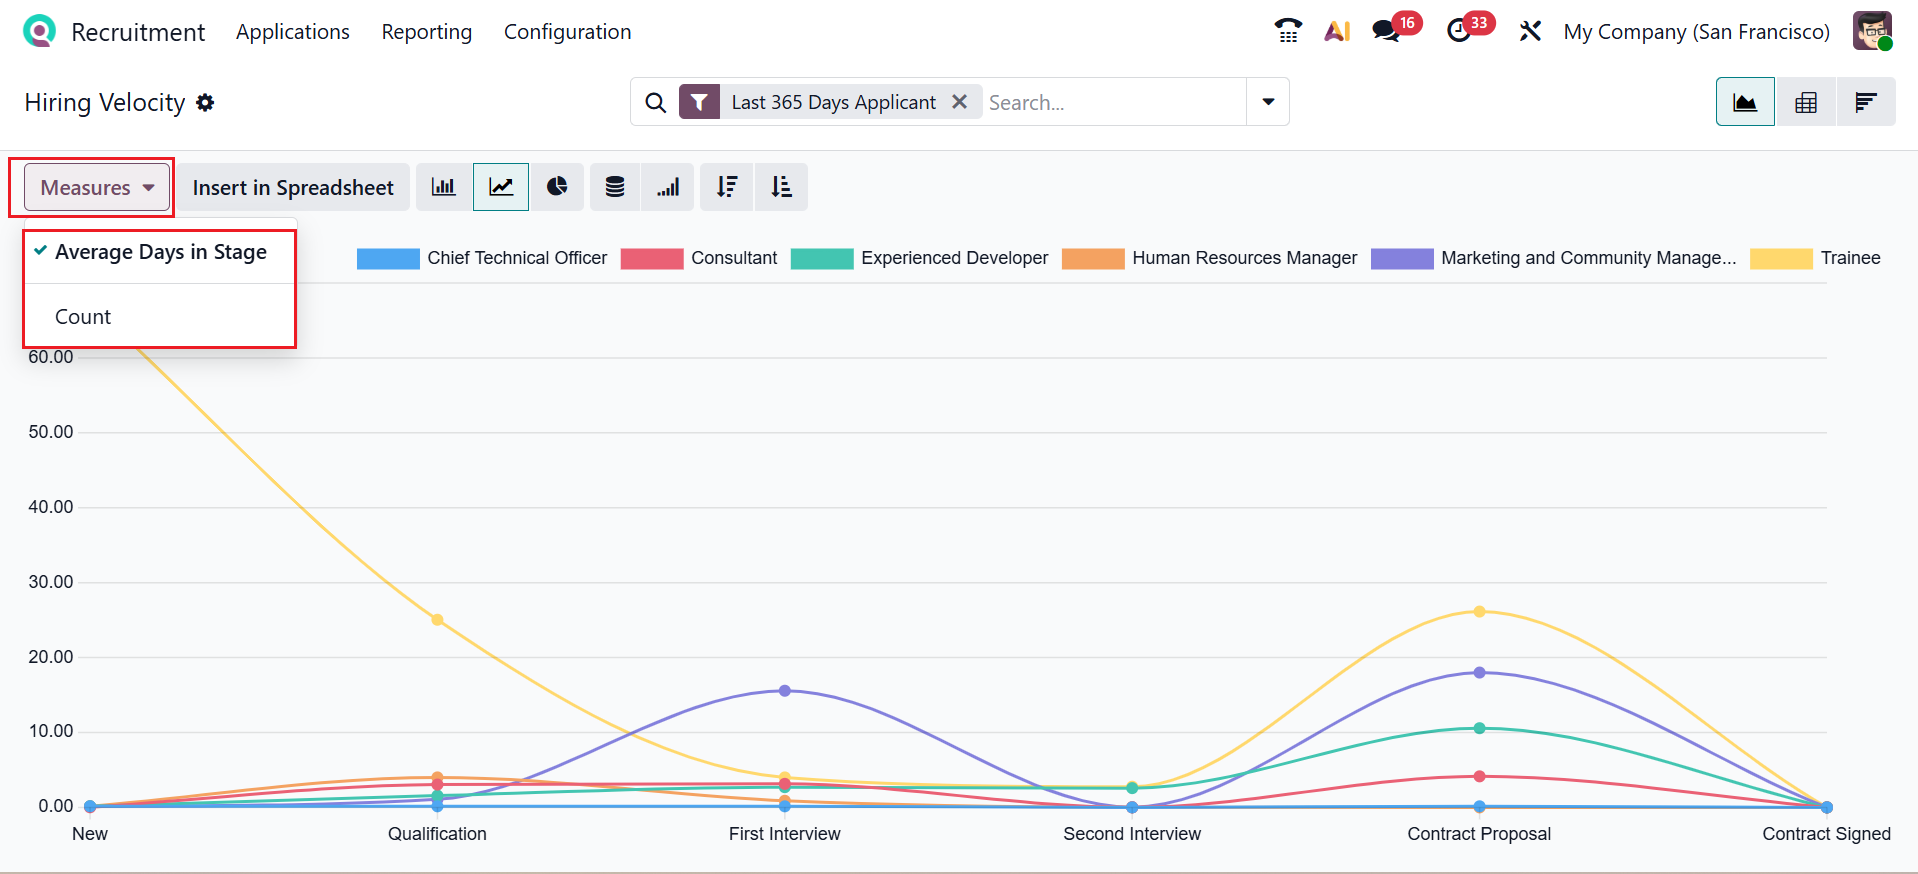
1.3 Hiring Velocity:
In Odoo 19 Recruitment, Hiring Velocity measures how quickly candidates move from application to hiring processes. This view helps identify recruitment bottlenecks and improve process efficiency. Stages are shown on the X-axis, applicant numbers on the Y-axis, and the Measures section lets you choose Average Days in Stage or Count for reporting.
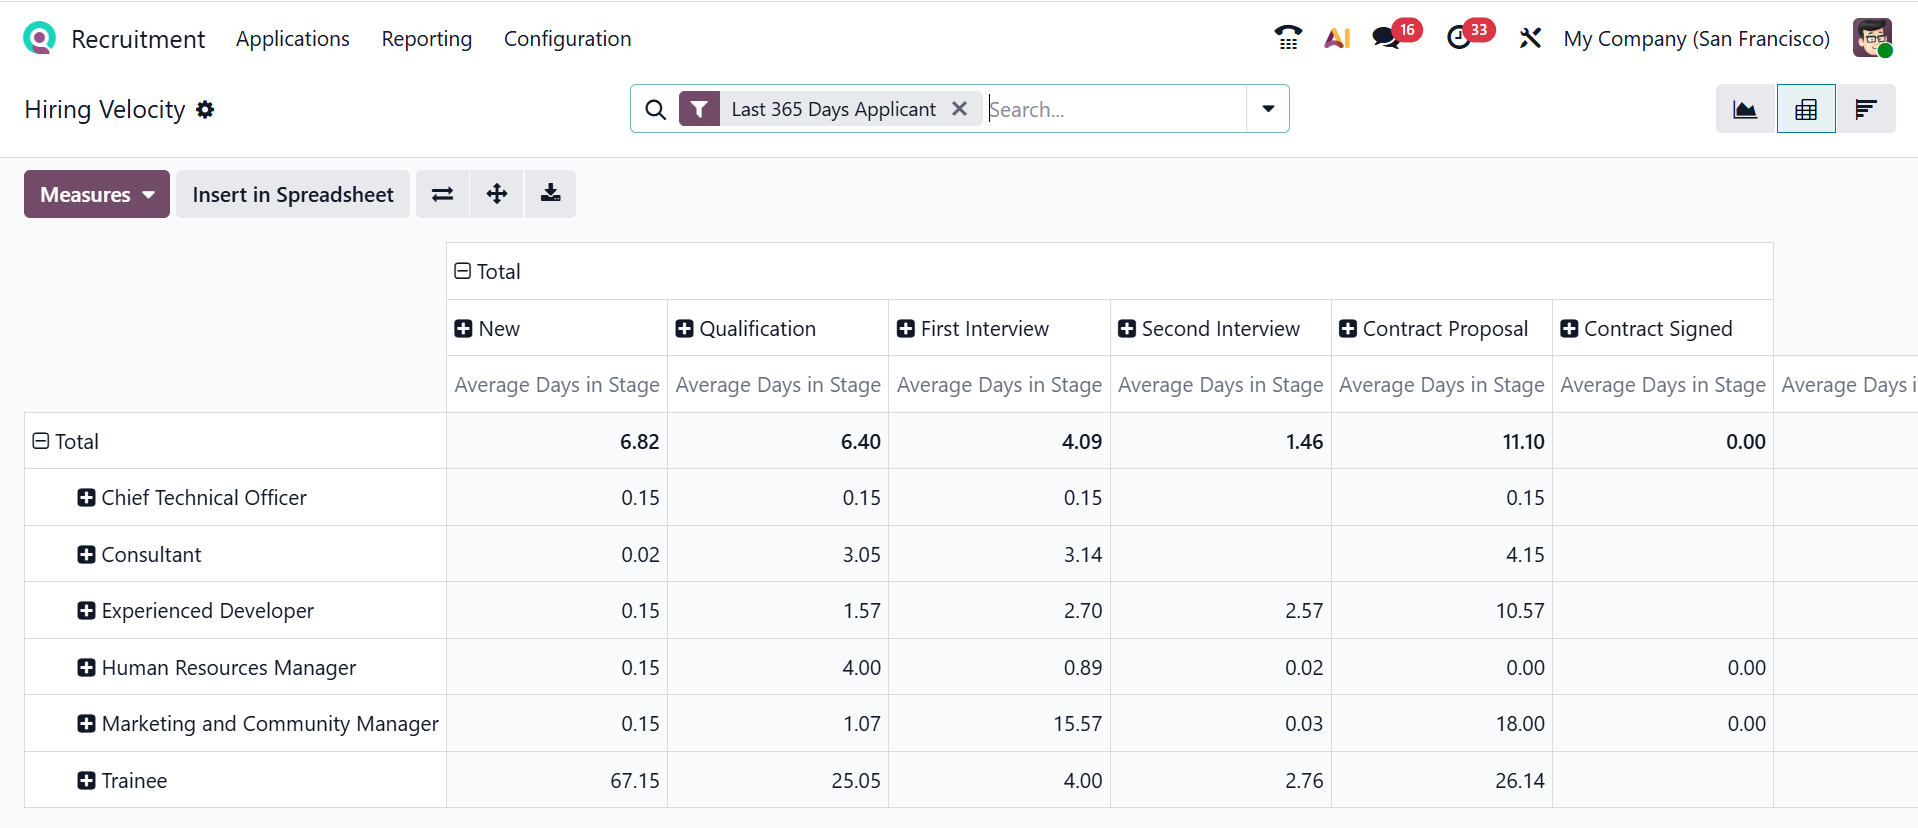
You can also click the Pivot icon in the upper-right corner to convert the graph view into a pivot view. Here, the rows are populated by job positions, and the columns represent the stages.
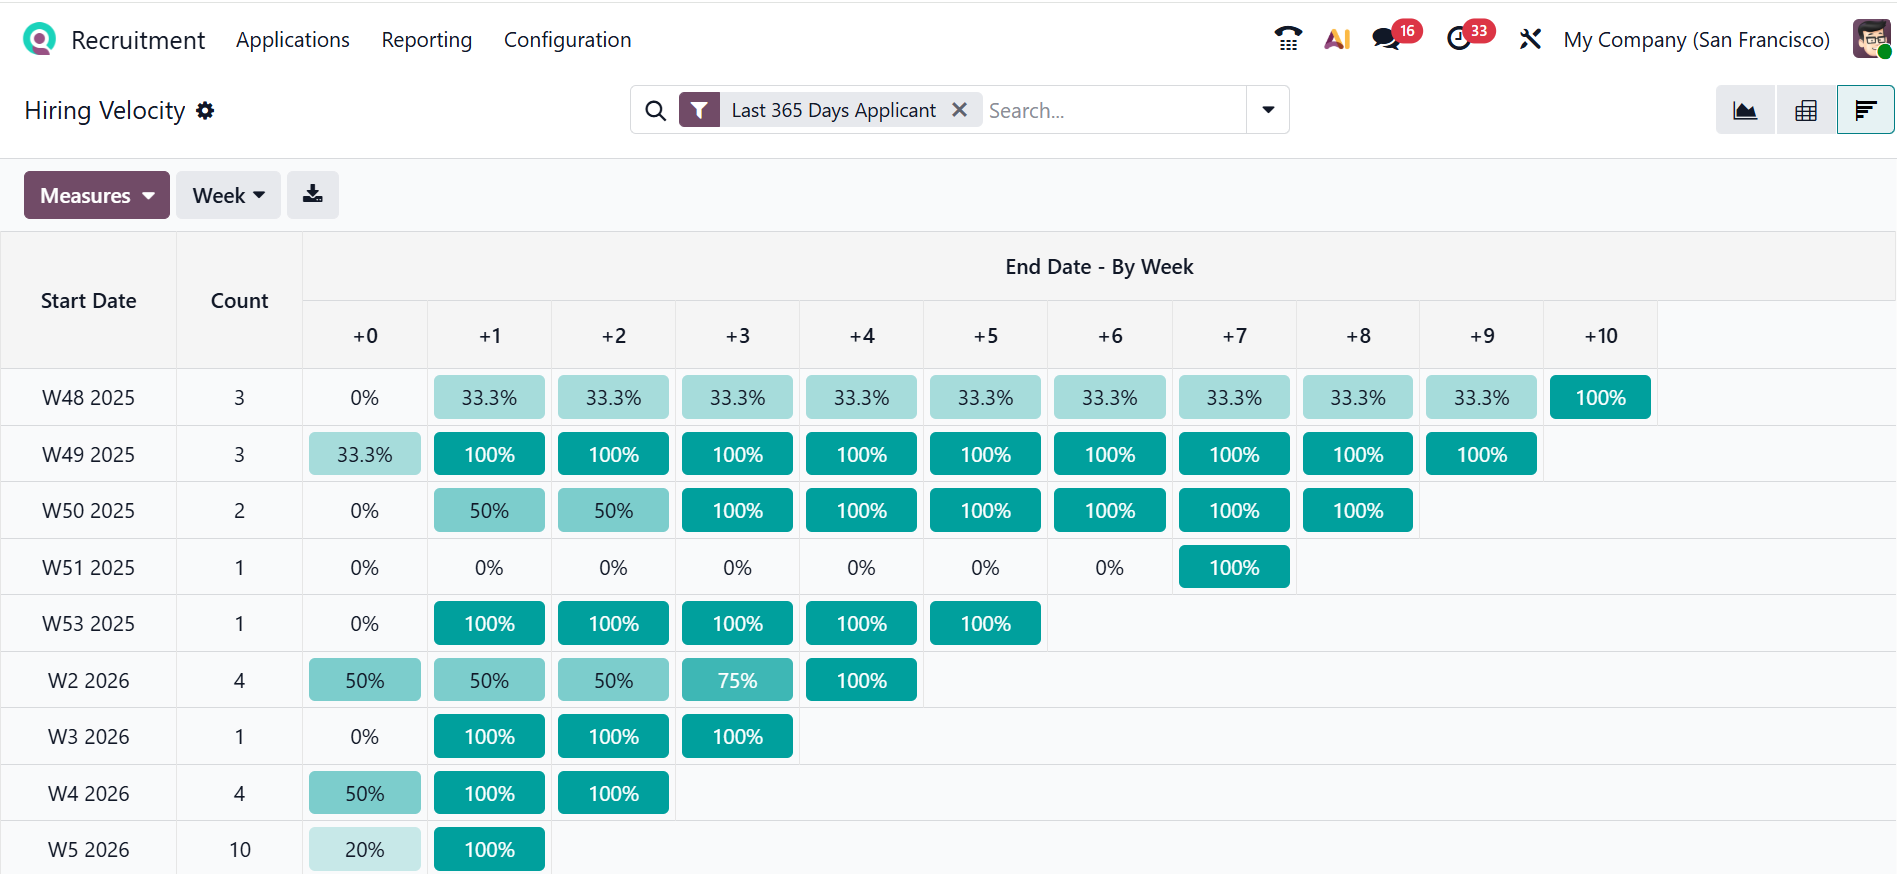
You can easily switch to the cohort view by clicking the cohort icon in the upper-right corner of the screen. Here, you can track how quickly applicants move through hiring stages over time, grouped by week. Each percentage cell shows how many applicants from that cohort progressed to the next stage after a certain number of days. This view helps you to improve hiring efficiency by comparing hiring speed across different weeks.
1.4 Team Performance:
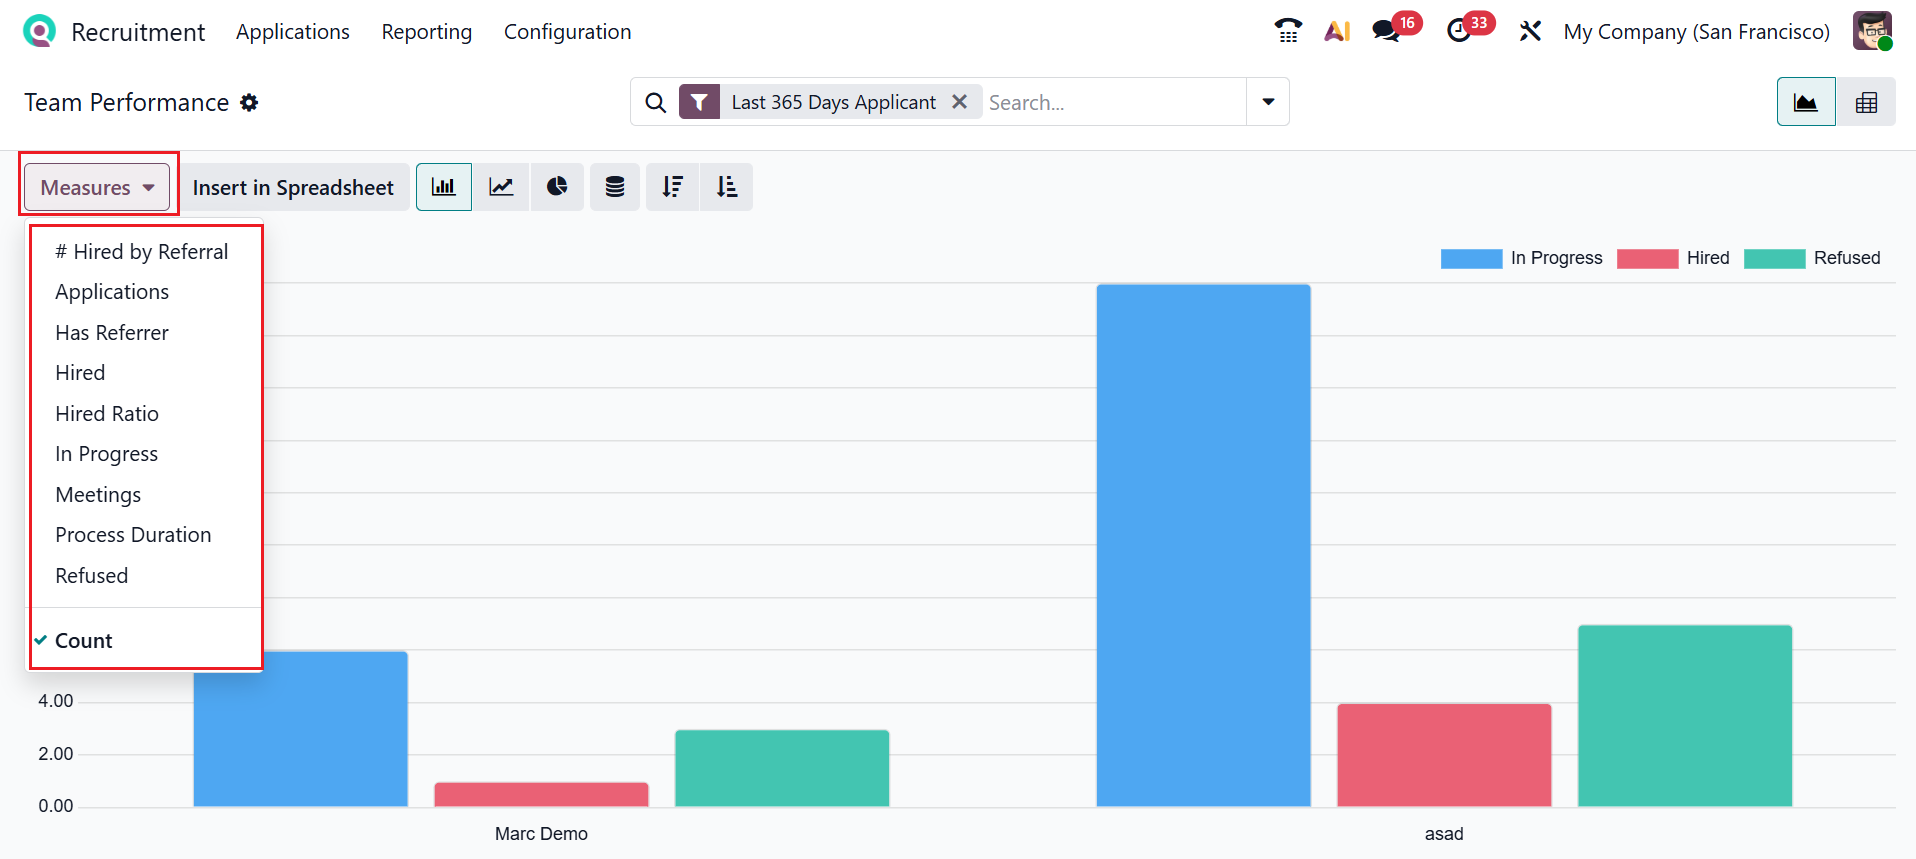
In Odoo 19 Recruitment, Team Performance measures how effectively recruiters handle applicants and the recruitment process. It helps track productivity and improve overall hiring efficiency. The Measures button enables you to modify reporting data using metrics, including Applications, Has Referrer, Hired, Hired Ratio, In Progress, Meetings, Process Duration, Refused, and Count, as illustrated in the screenshot below.
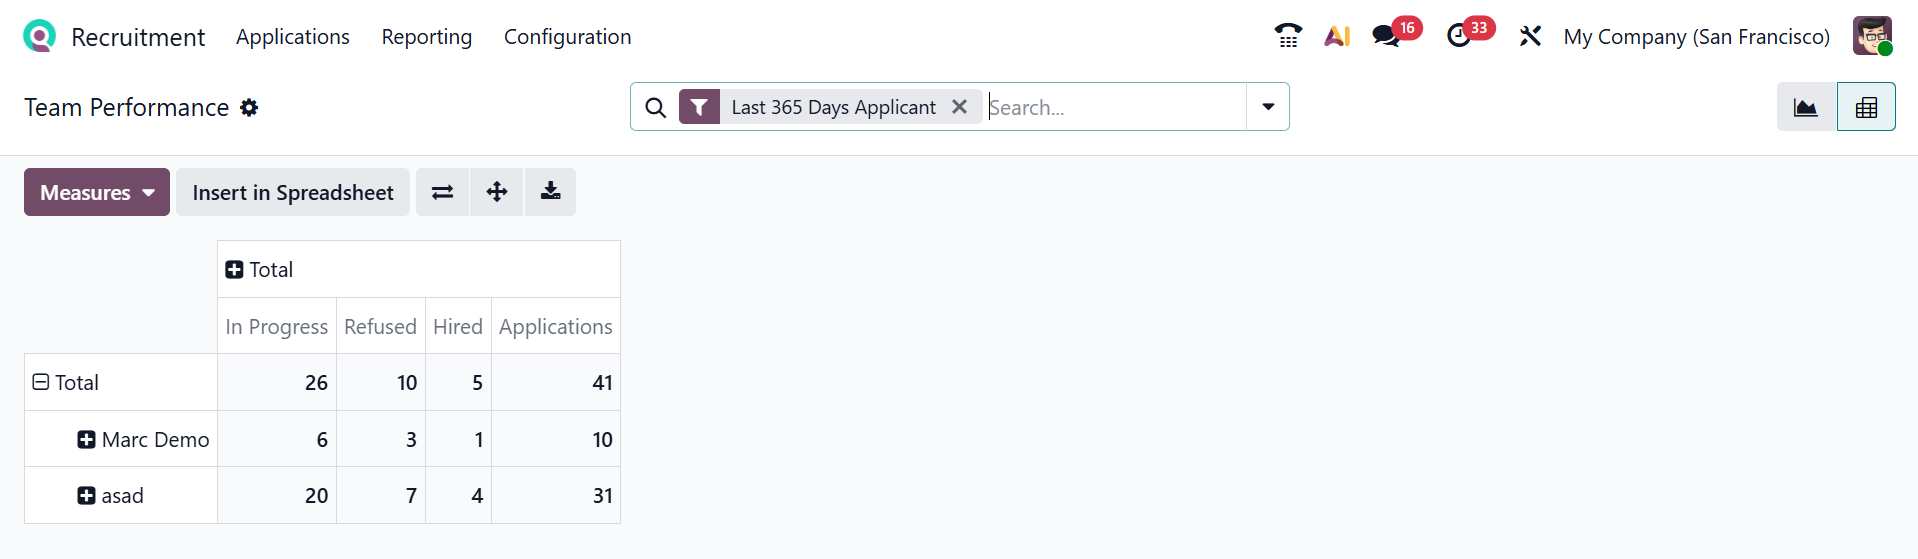
You can also click the Pivot icon in the upper-right corner to convert the graph view into a pivot view. Here, the rows are populated by recruiters, and the columns represent the stages.
1.5 Offer Analysis:
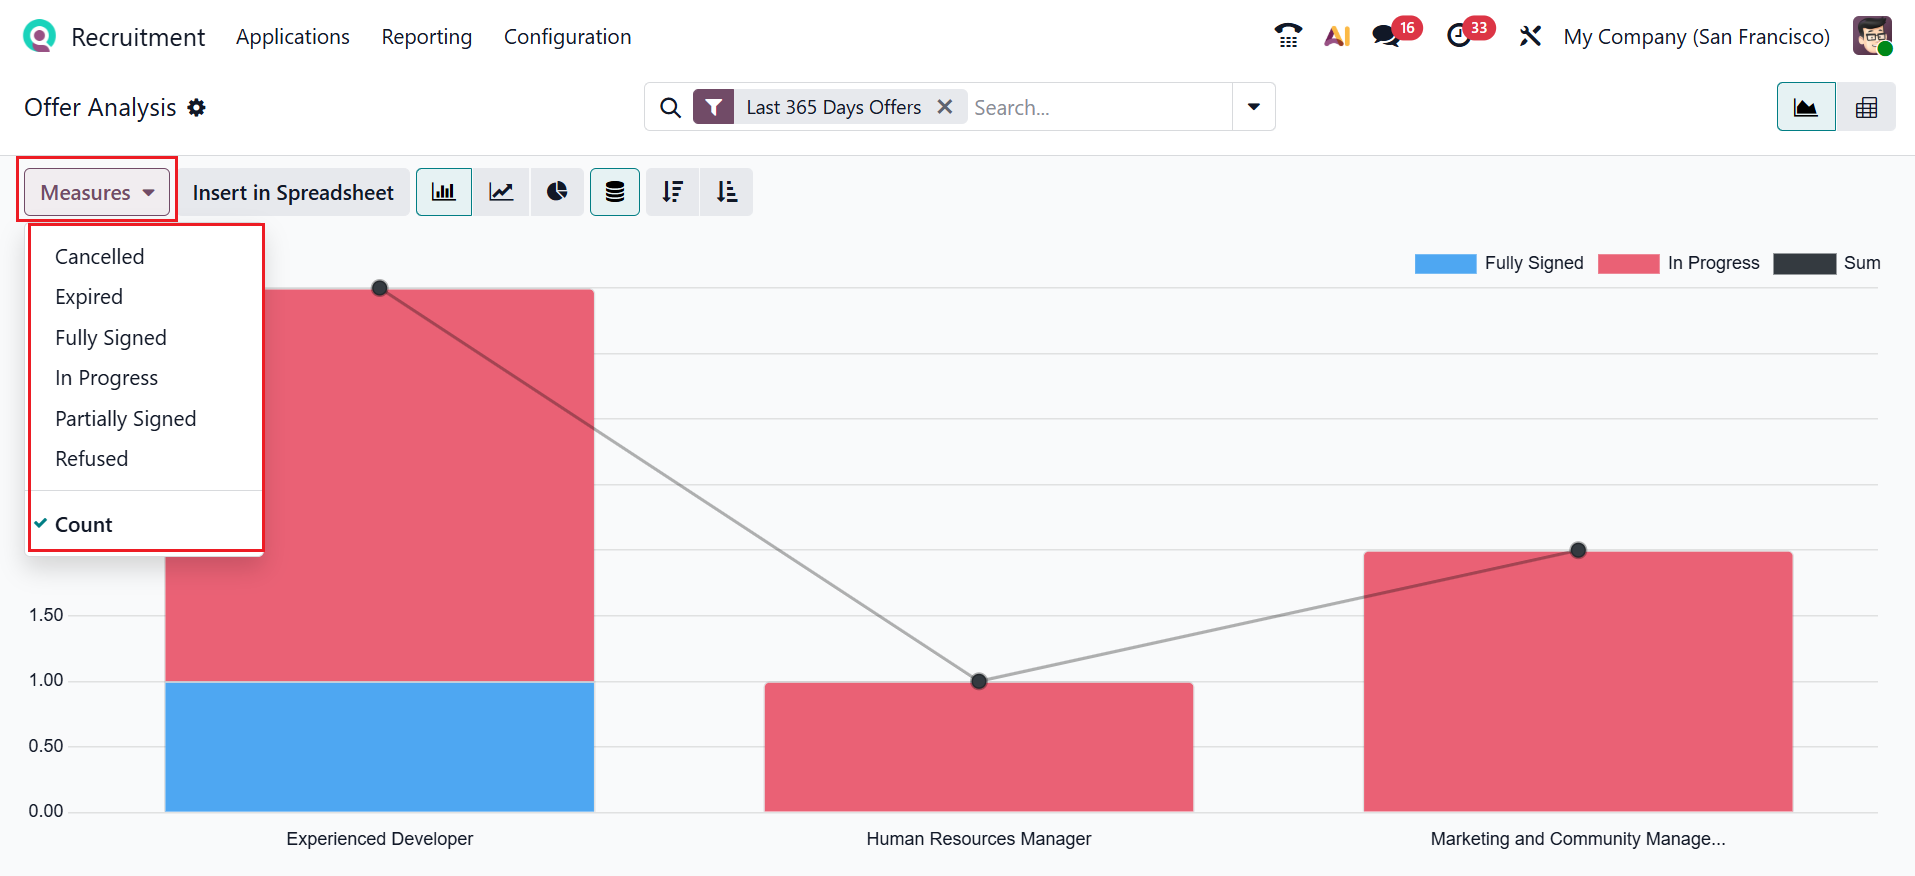
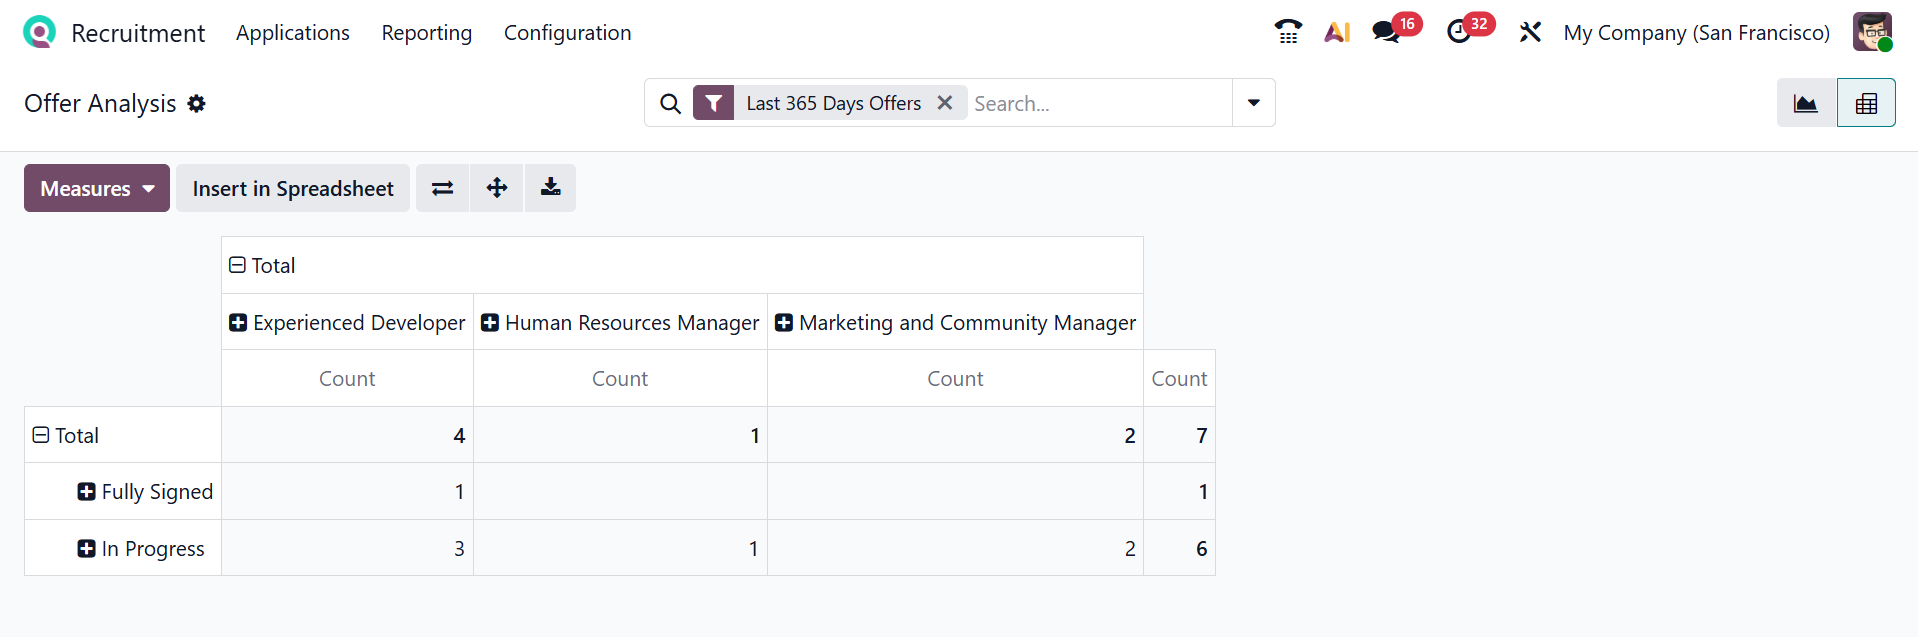
In Odoo 19 Recruitment, the Offer Analysis shows the status of job offers, such as Fully Signed, In Progress, and Sum, grouped by job positions. This helps the HR teams quickly see how many offers are completed and still pending. The X-axis shows the job offers, and the Y-axis shows the status of job offers. The Measures button enables you to modify the reporting data by status, including Cancelled, Expired, Fully Signed, In Progress, Partially Signed, Refused, and Count.
Additionally, selecting the Pivot icon in the upper-right corner converts the graph view into a pivot view. Here, the rows are populated by the status of the job offer, and the columns represent the job positions.
The Odoo 19 Recruitment module simplifies and optimizes the entire hiring process with a streamlined, efficient solution. From job postings and applicant tracking to interview scheduling and evaluation, it centralizes recruitment activities in a user-friendly interface. By integrating seamlessly with Odoo modules like Employees, Payroll, and Email, the system enhances collaboration and maintains data consistency. Automation further minimizes manual work, accelerates response times, and enables better hiring decisions. With customizable stages, reporting tools, and scalable functionality, Odoo 19 Recruitment helps organizations attract talent, optimize workflows, and build a strong workforce aligned with business goals.