Reporting
The Referral module includes a powerful reporting feature that helps businesses analyze employee referral performance in detail. When you select the Reporting menu in the Odoo 19 Referral module, the Employee Referral Analysis window opens.
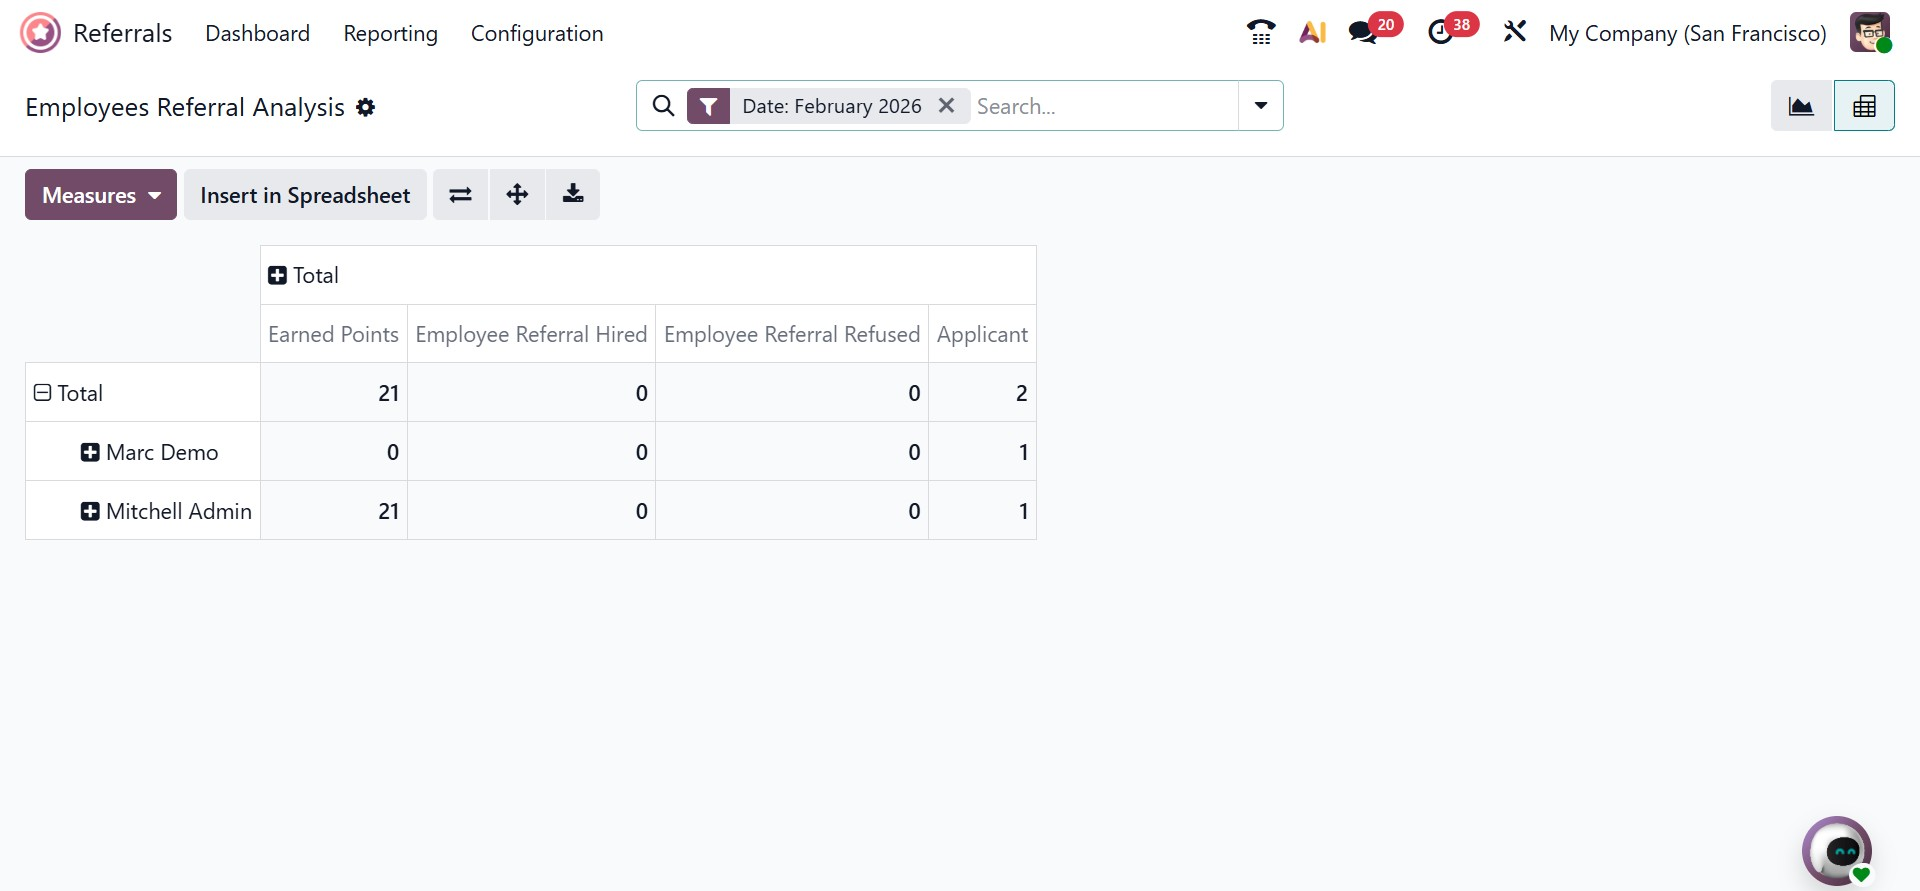
In this window, the Pivot view displays referral data in a structured pivot table format. The table shows important details such as points earned by each employee, successful hires through referrals, rejected referrals, and applicant-related information. By clicking the Measures button, users can add more values to the pivot table, including referral count, points awarded for unsuccessful applications, and other useful metrics.
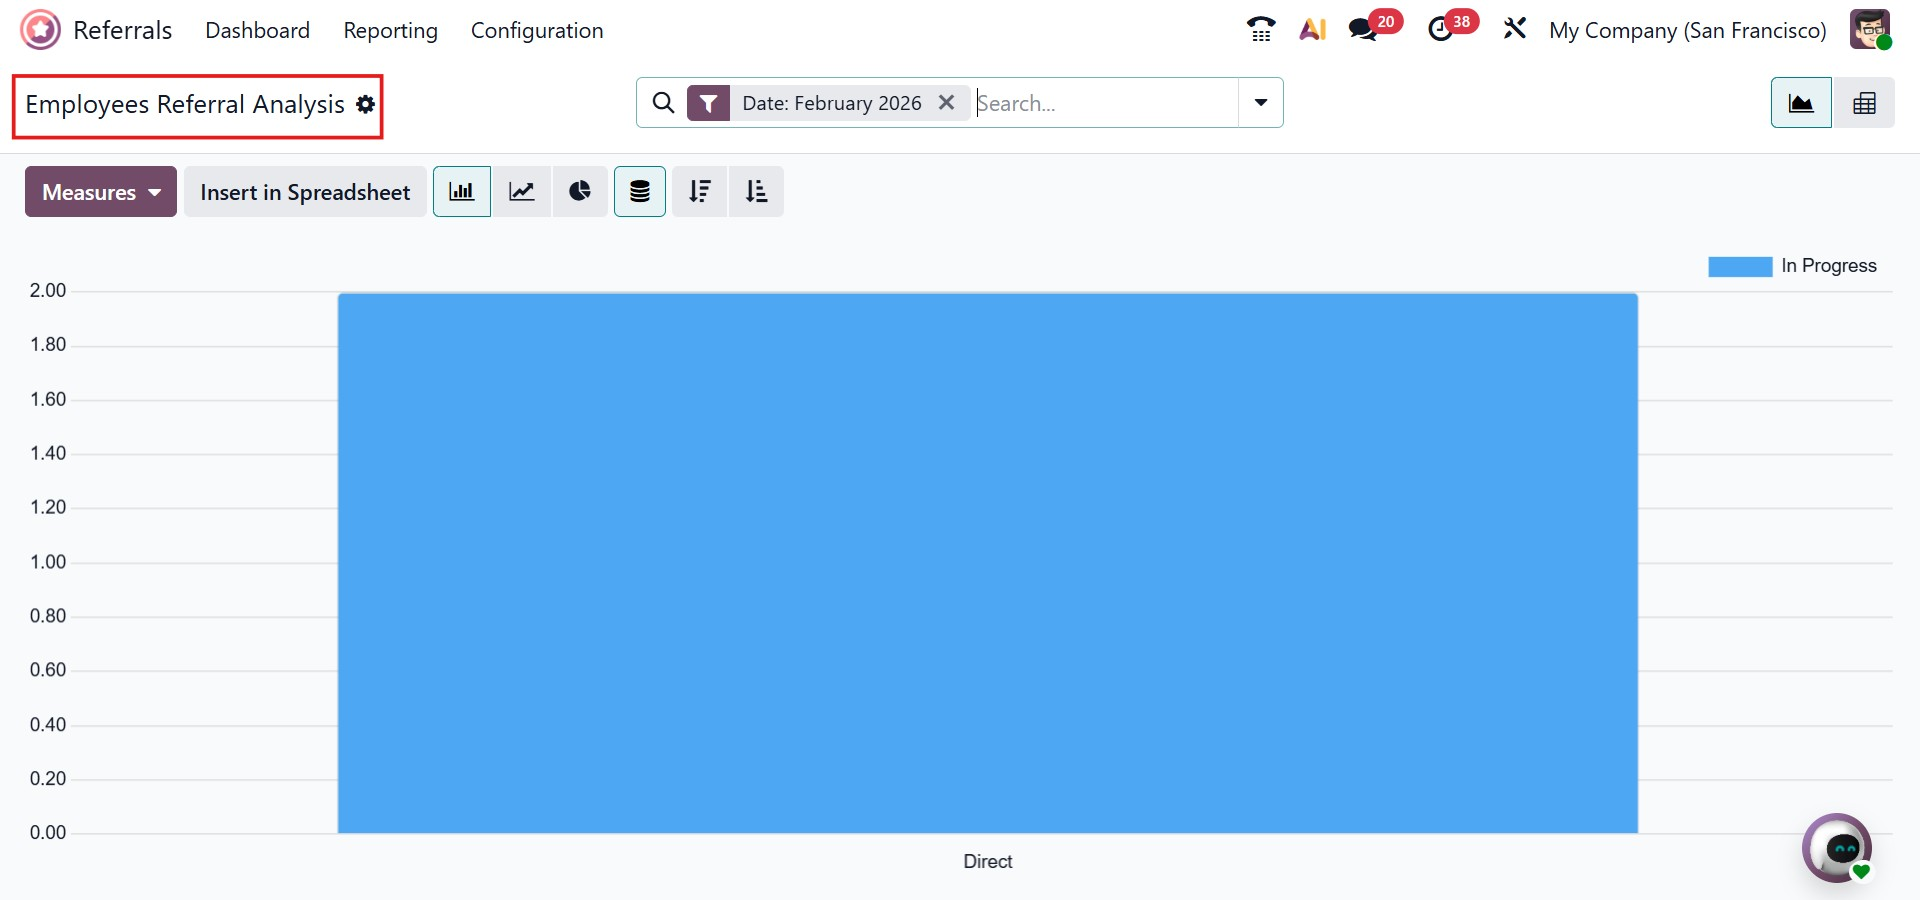
The Graph view of the Employee Referral Analysis presents data visually for better understanding. In this view, the applicant rate is shown on the Y-axis, while the referral source or medium appears on the X-axis. Additional values such as Earned Points, Referral Count, Successful Hires, and other indicators can be added easily using the Measures option.
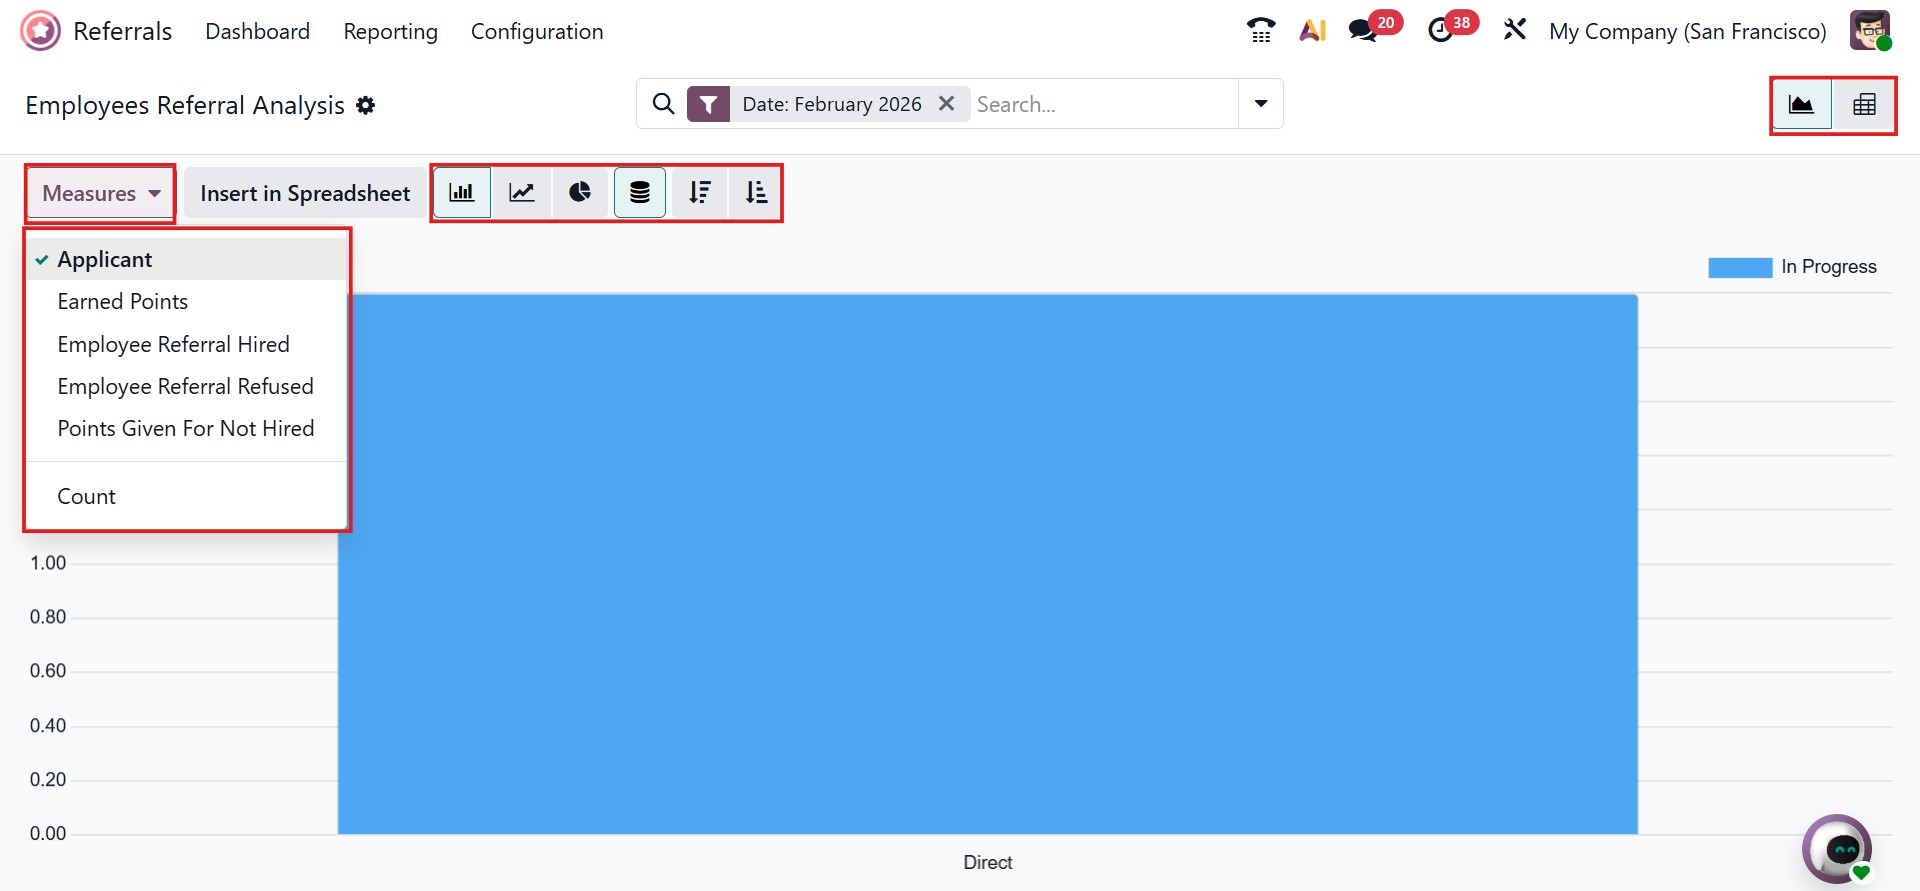
Users can switch between different graph formats, including bar charts, line charts, and pie charts, depending on their analysis needs. A dedicated points analysis view is also available, offering a detailed breakdown of referral data.
This view displays information such as the referring user, partner name, recruitment stage, points earned, and the last update date, helping organizations closely track and evaluate the effectiveness of their referral program.