Running a successful event doesn't end when the last guest leaves; measuring its performance is just as important. With the Odoo 20 Events module, users can access different reports to understand how the events actually performed. These reports help track registrations, monitor revenue, and analyze attendee information. Odoo 20 provides different reporting views that make it easier to examine event performance from various perspectives.
In this blog, we will explore event registrations, revenue, and attendee analysis through Odoo 20 Event Reporting.
Accessing Event Reports
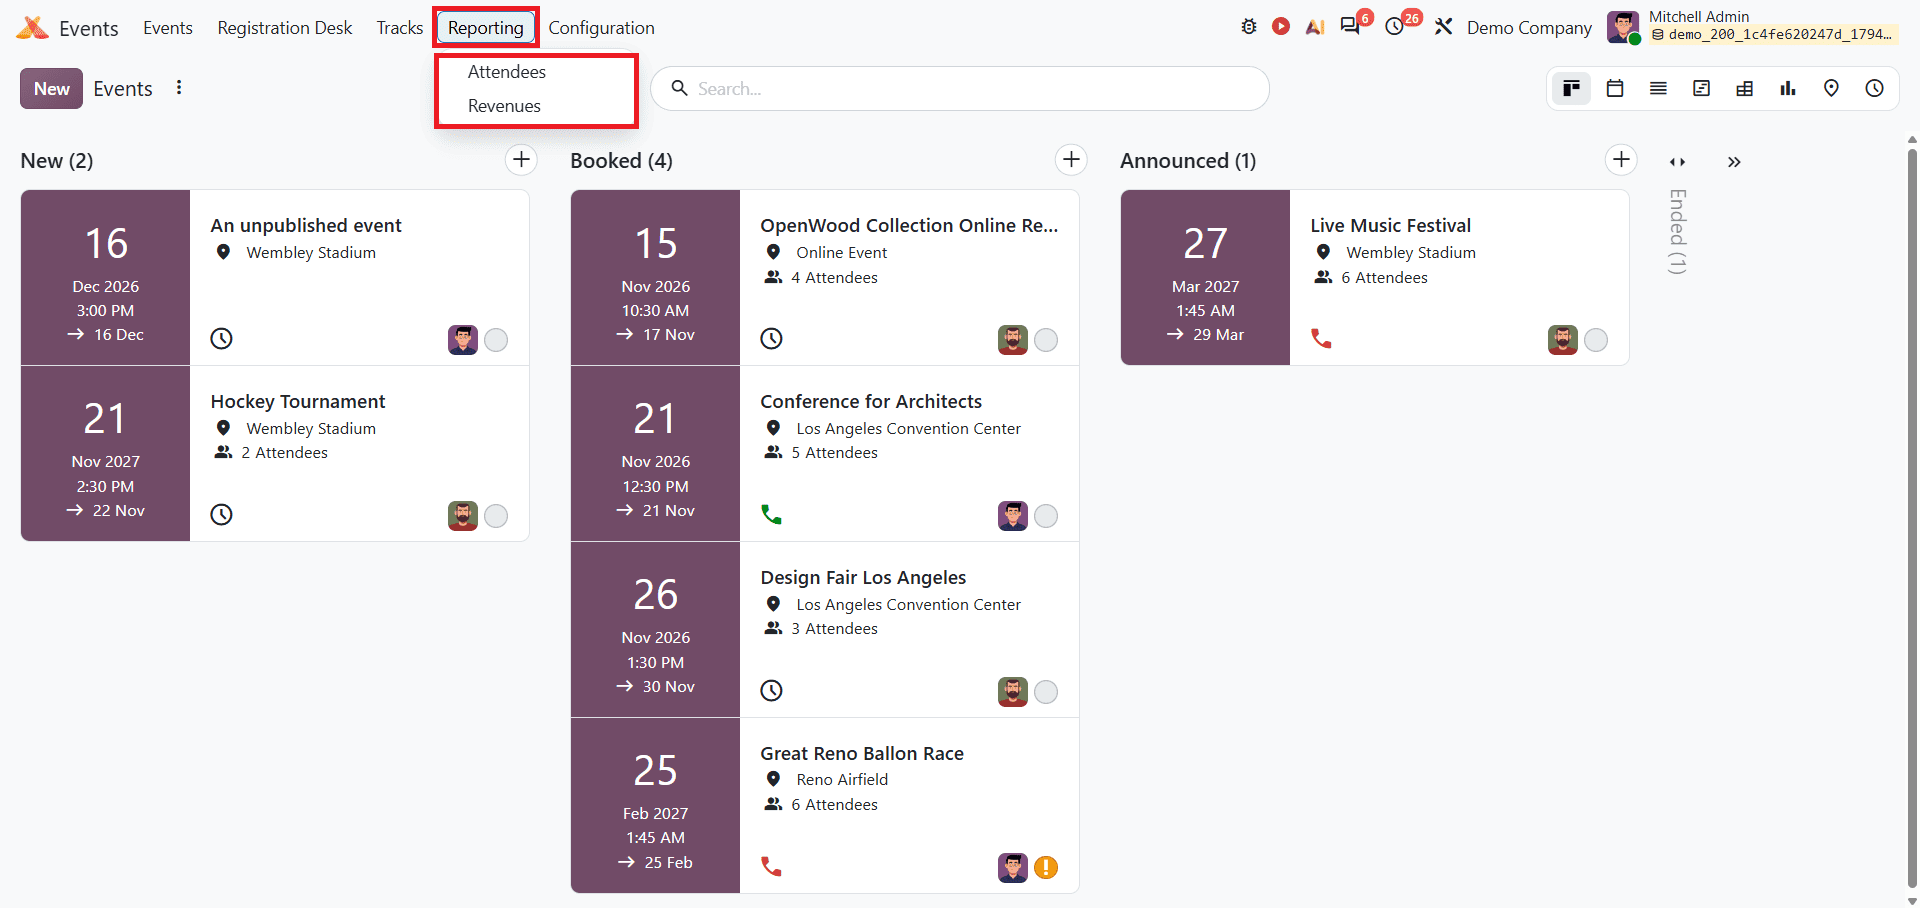
Navigate to Odoo 20 and open the Events module from the Odoo 20 Dashboard. After opening the Events module, access the Reporting menu. Odoo 20 Reporting provides Attendees and Revenue reports as shown below.
Attendees Report
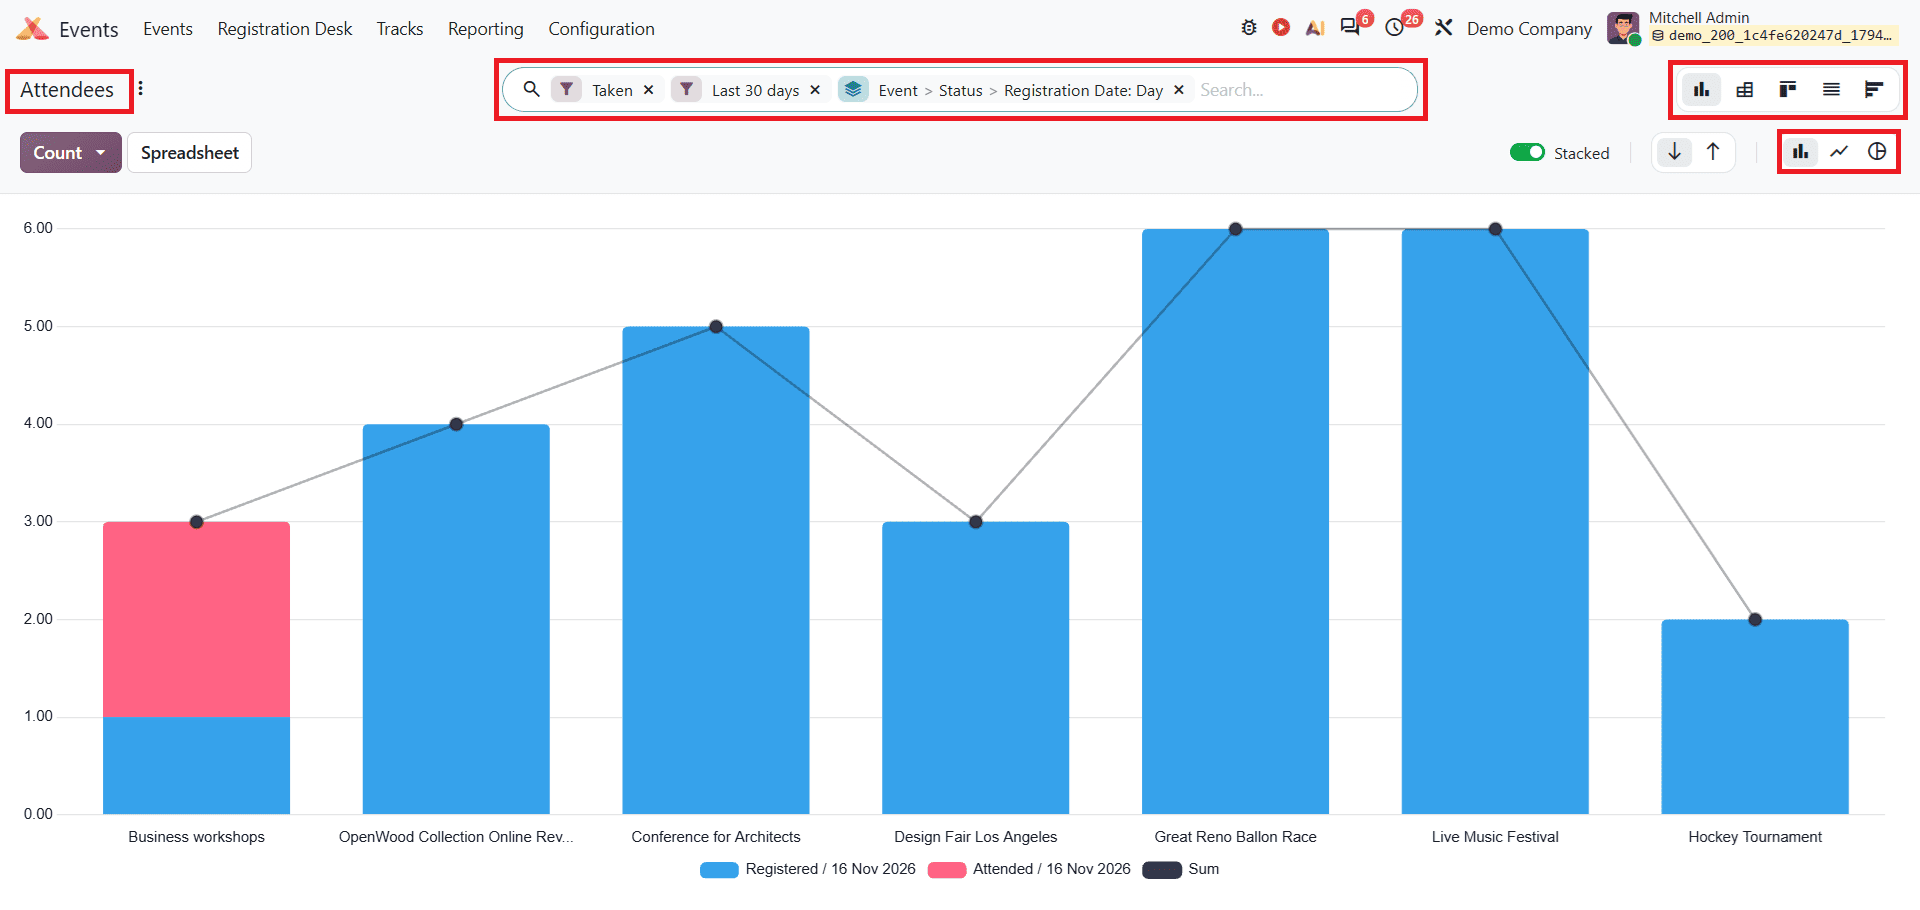
From the Reporting menu, select Attendees. The attendees report provides different options for analysing attendee data. It includes different views and filter options. This report makes it easy to analyze your data using custom filters, different layouts like graphs and lists, and options to group by event, ticket type, customer, or order status.
Filters Options
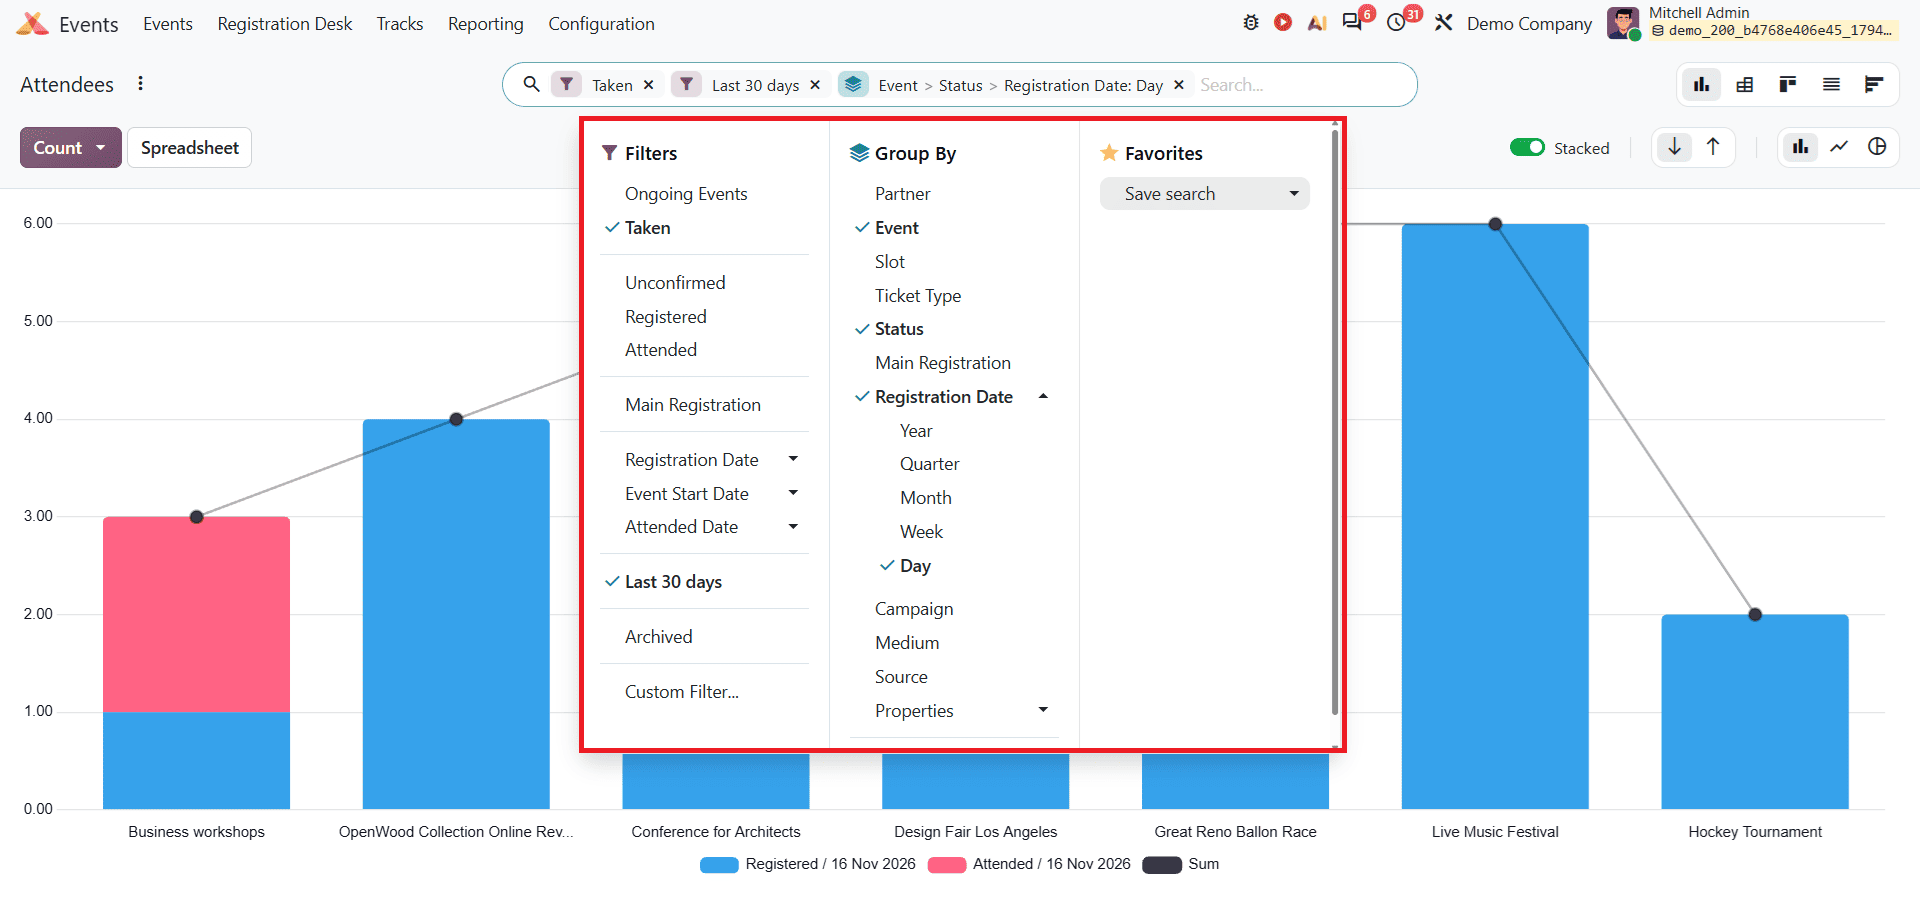
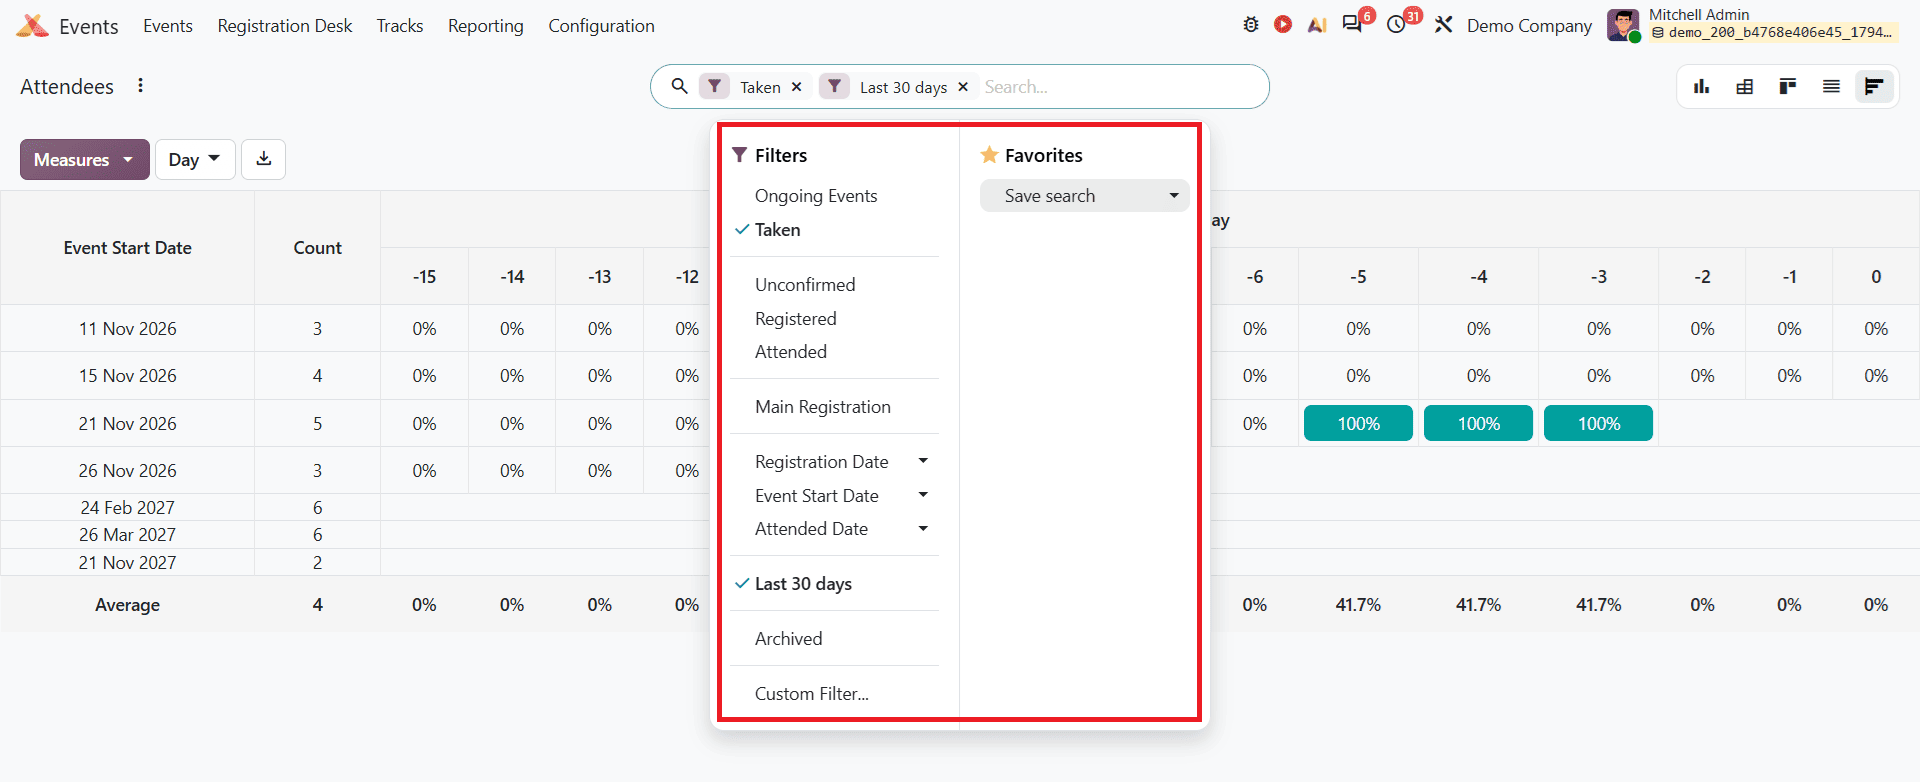
Odoo 20 provides different filtering options to help users find specific attendee records. From the search bar's dropdown menu, users can apply filters such as Ongoing Events, Taken, Unconfirmed, Registered, Attended, Registration Date, Event Start Date, and Attended Date. The Last 30 Days and Archived options are also available. Users can combine multiple filters or create custom filters to narrow down the attendee records based on their requirements.
Group By
The Group By option allows users to organise attendee records based on different groups. Odoo 20 provides grouping options such as Partner, Event, Slot, Ticket Type, Status, Registration Date, and Campaign. Users can also create custom groups to organise records using additional fields. Multiple grouping options can be applied together for a more detailed analysis. These options are available in Graph, Pivot, Kanban, and List views, but not in Cohort view.
Graph views
In the Graph view, the default attendees report shows a Bar Chart. These colours represent attendee statuses. Clicking on the red section shows the details of attendees who are attending the event.
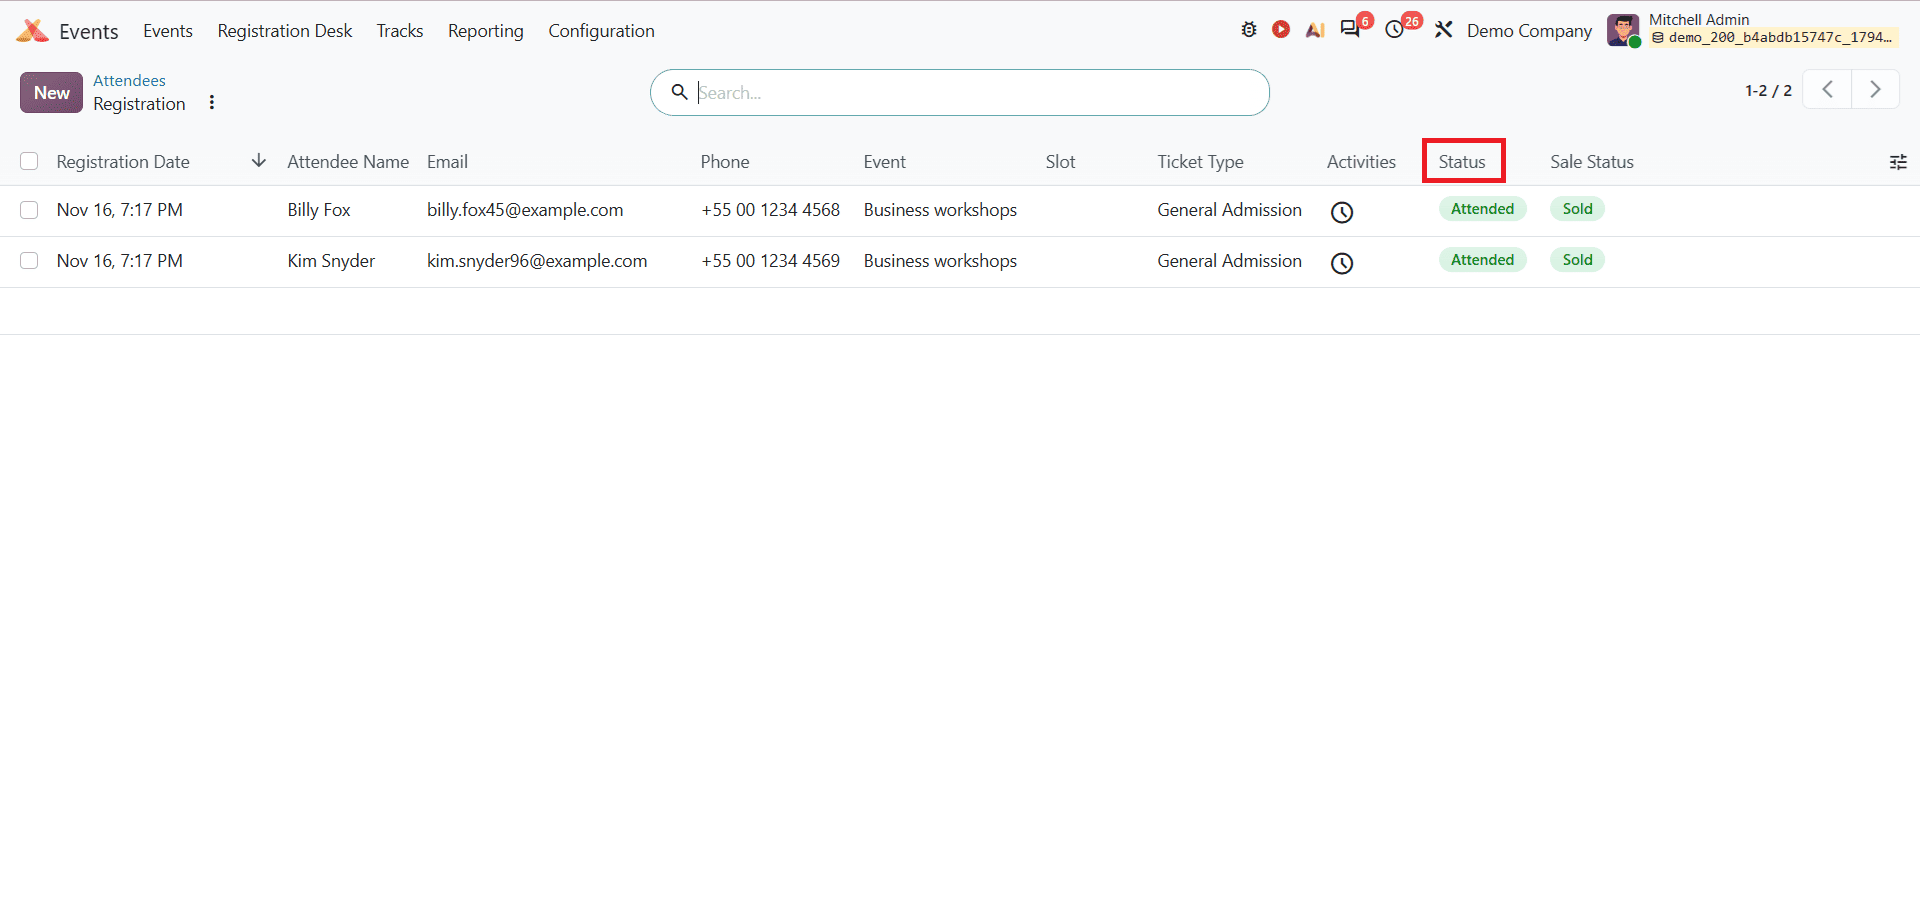
Clicking on the blue section, you can see the details of attendees who are registered for the event.
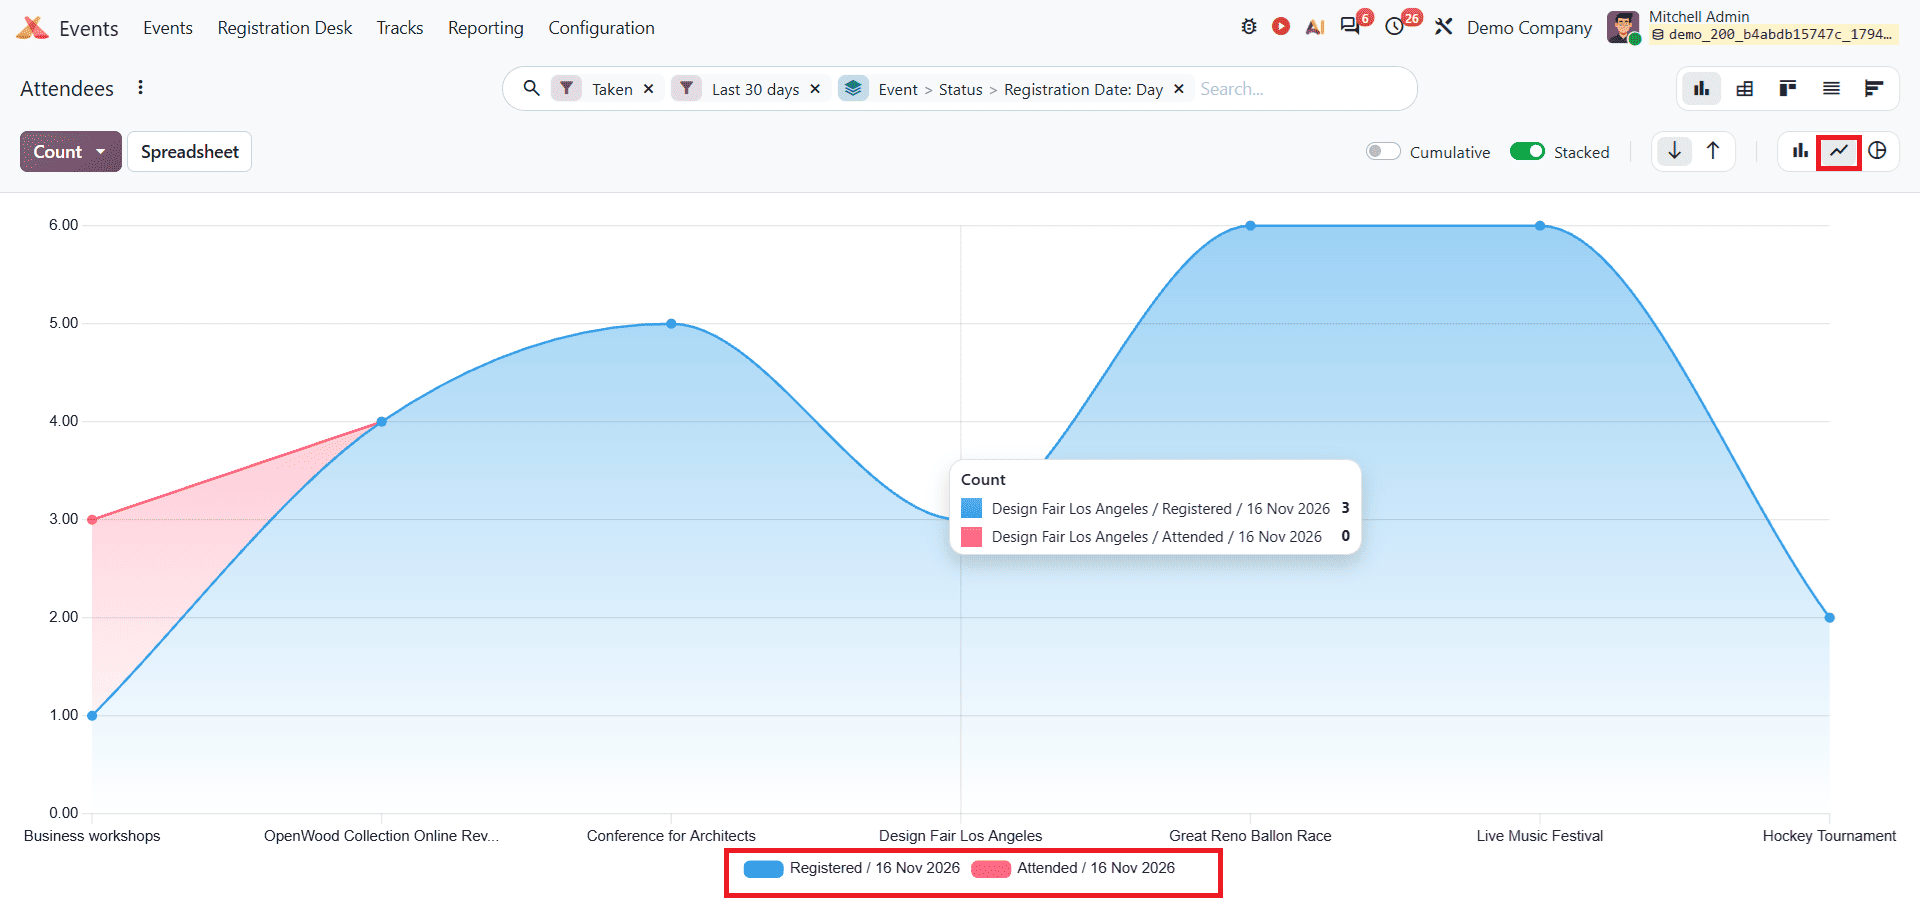
The Line Chart also displays the same registered and attended counts as the Bar Chart. You can see the line chart as shown below.
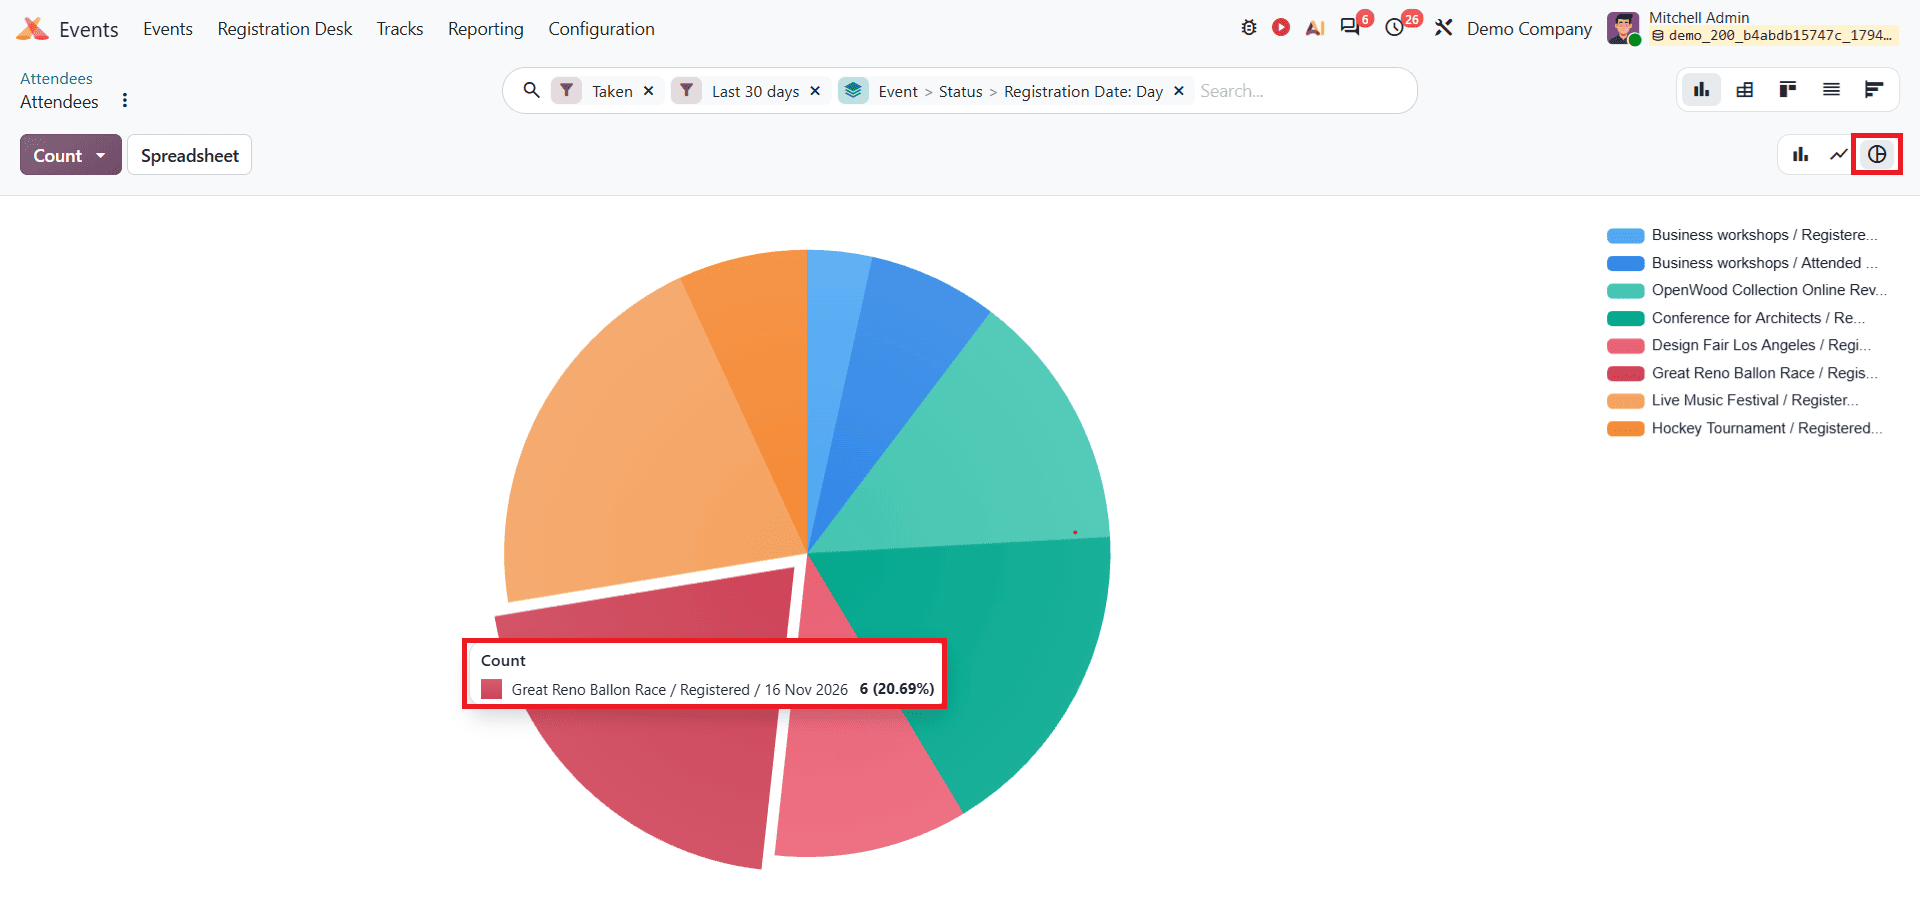
The Pie Chart provides a visual representation of the attendee data, making it easier to compare the number of registered and attended attendees. It helps users understand the proportion of attendees who have registered and those who have attended the event.
Other Views
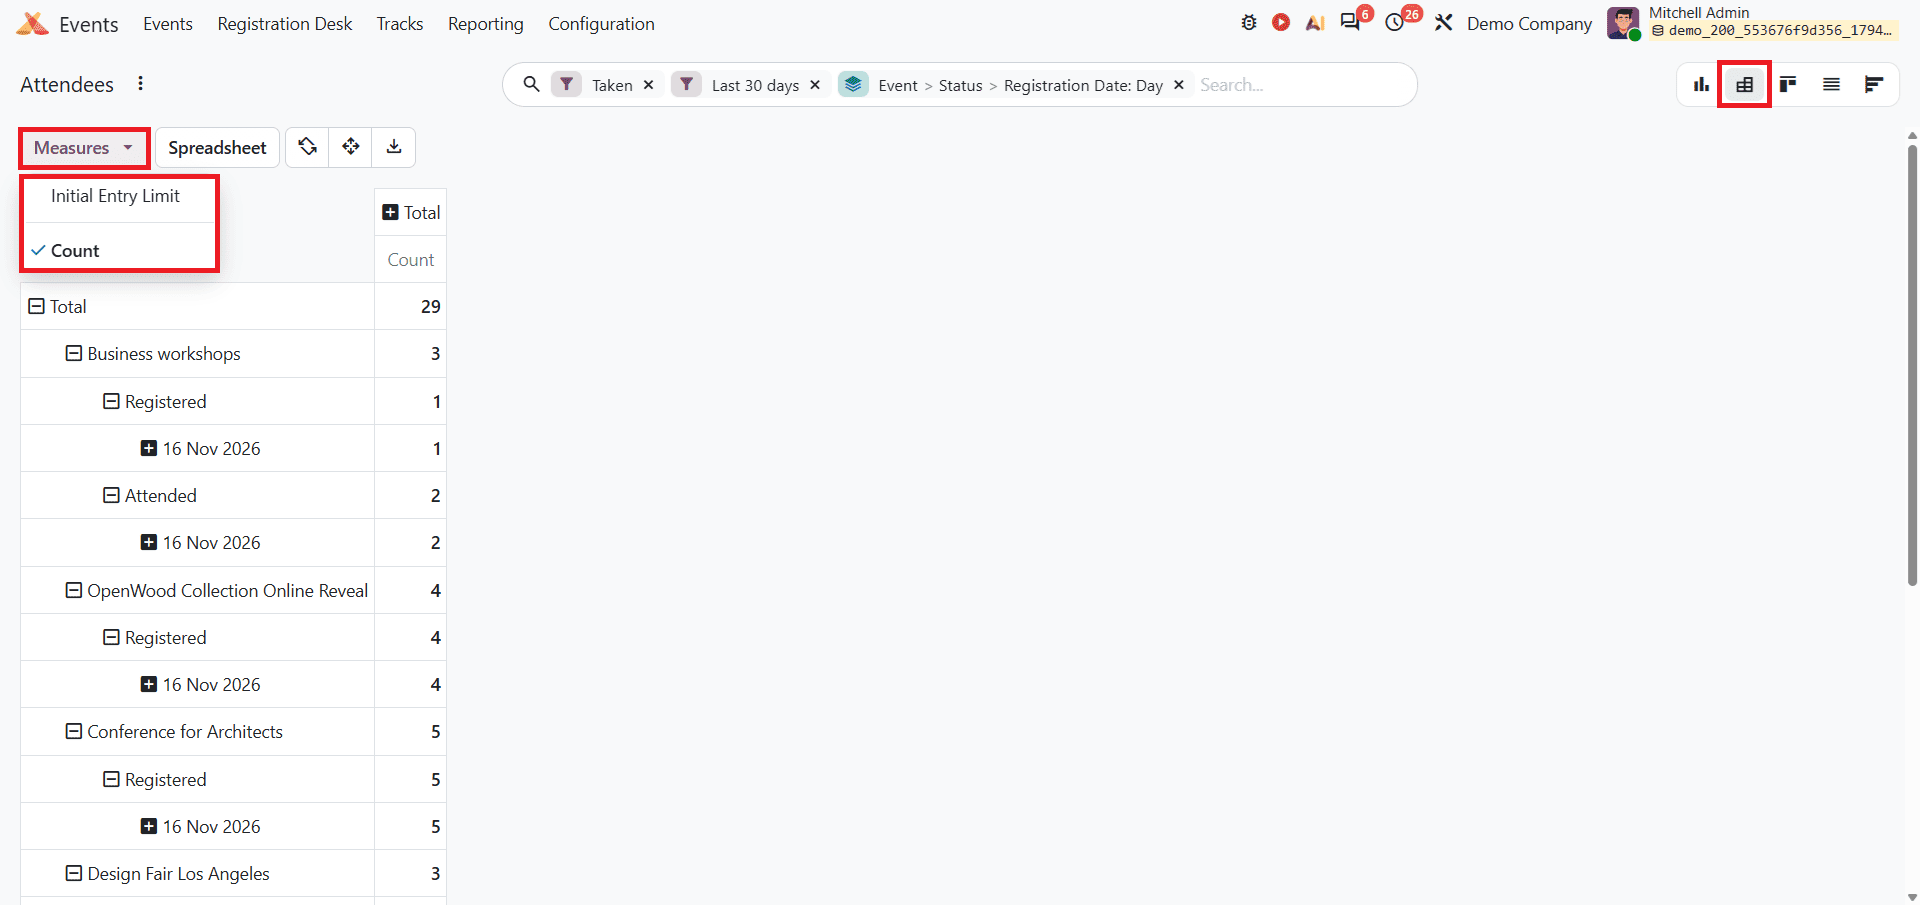
The Pivot view makes it easy to analyze your data from different angles and dive deeper into the specific details behind the numbers. The Measures option is available only in Graph, Pivot, and Cohort Views.
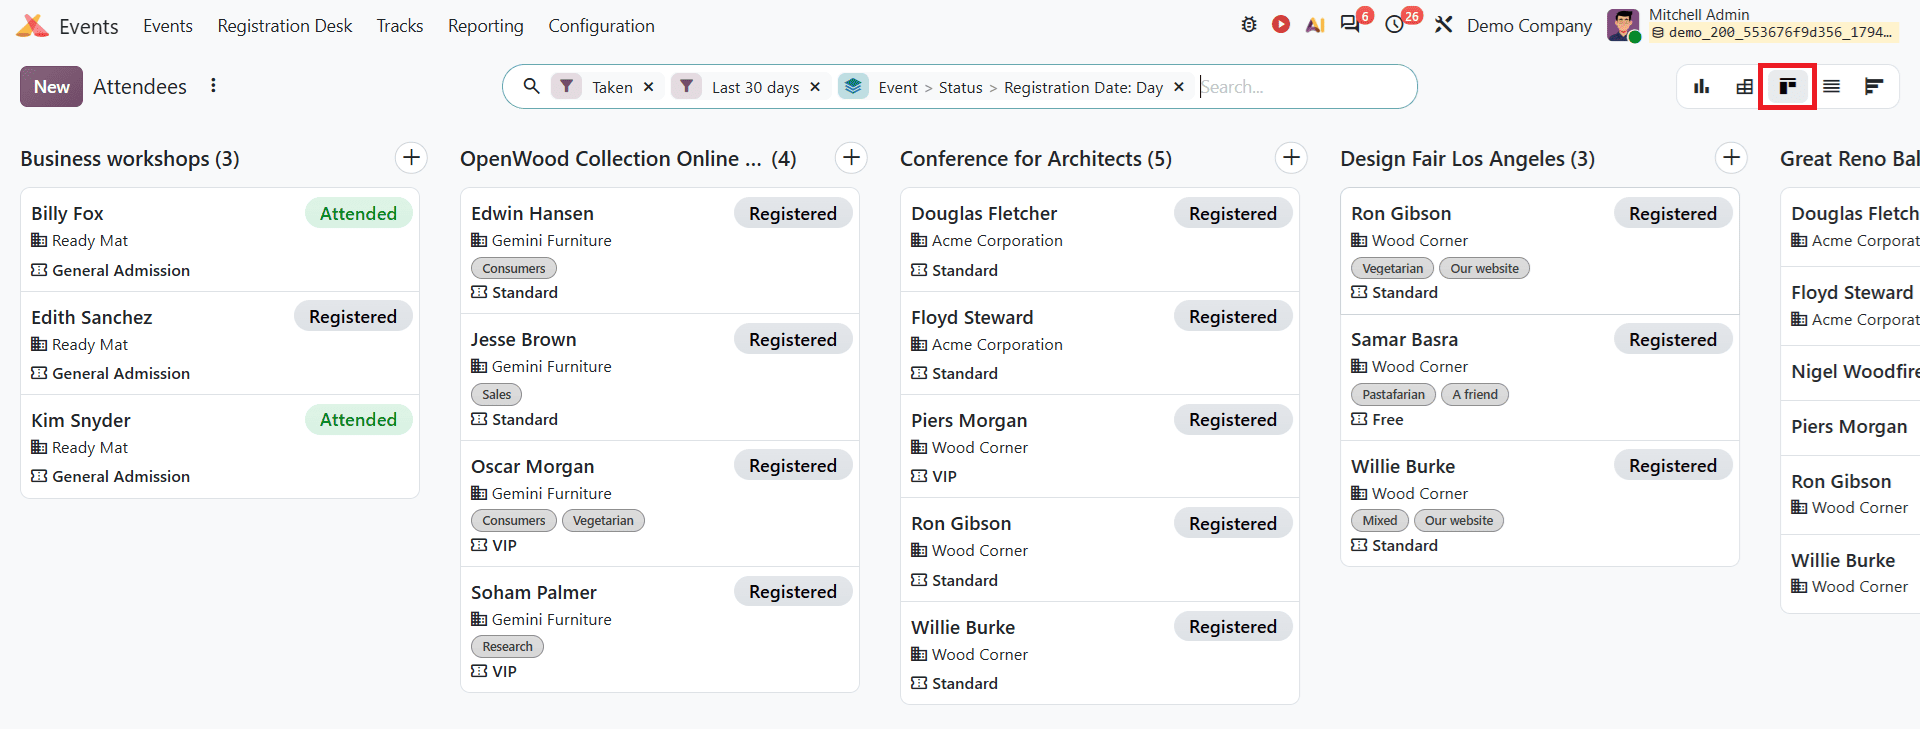
The Kanban View organises attendee records into separate columns based on events. Each card displays the attendee’s details along with their registration status, such as Registered or Attended. This view helps users get a clear overview of attendees and their status across different events.
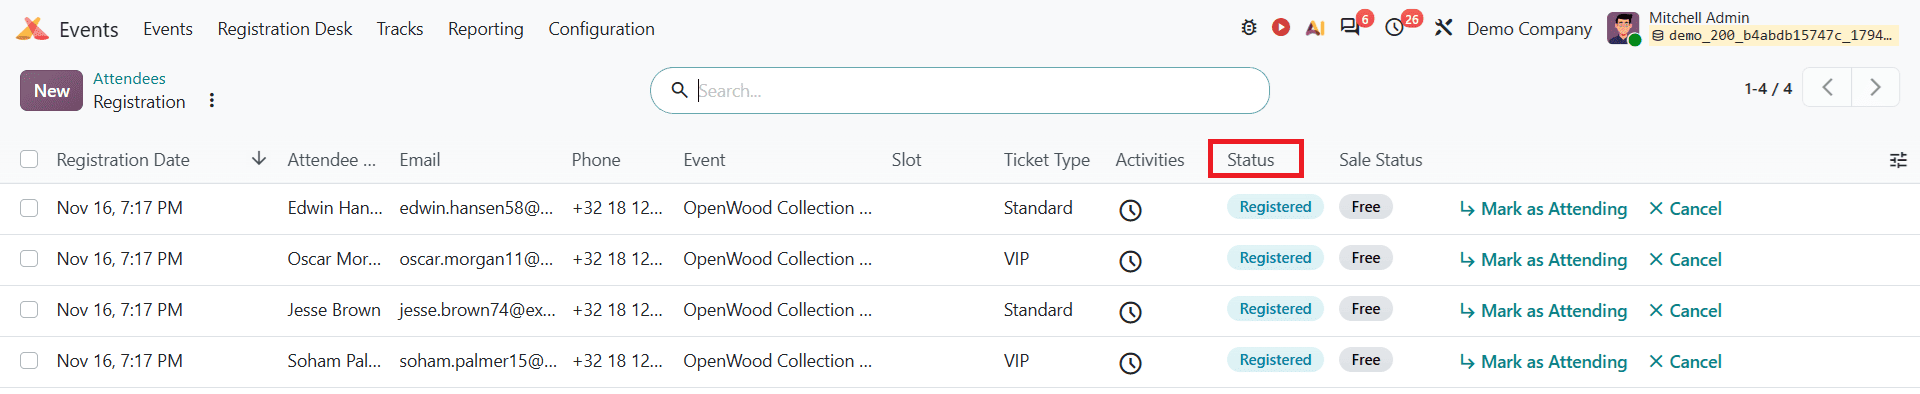
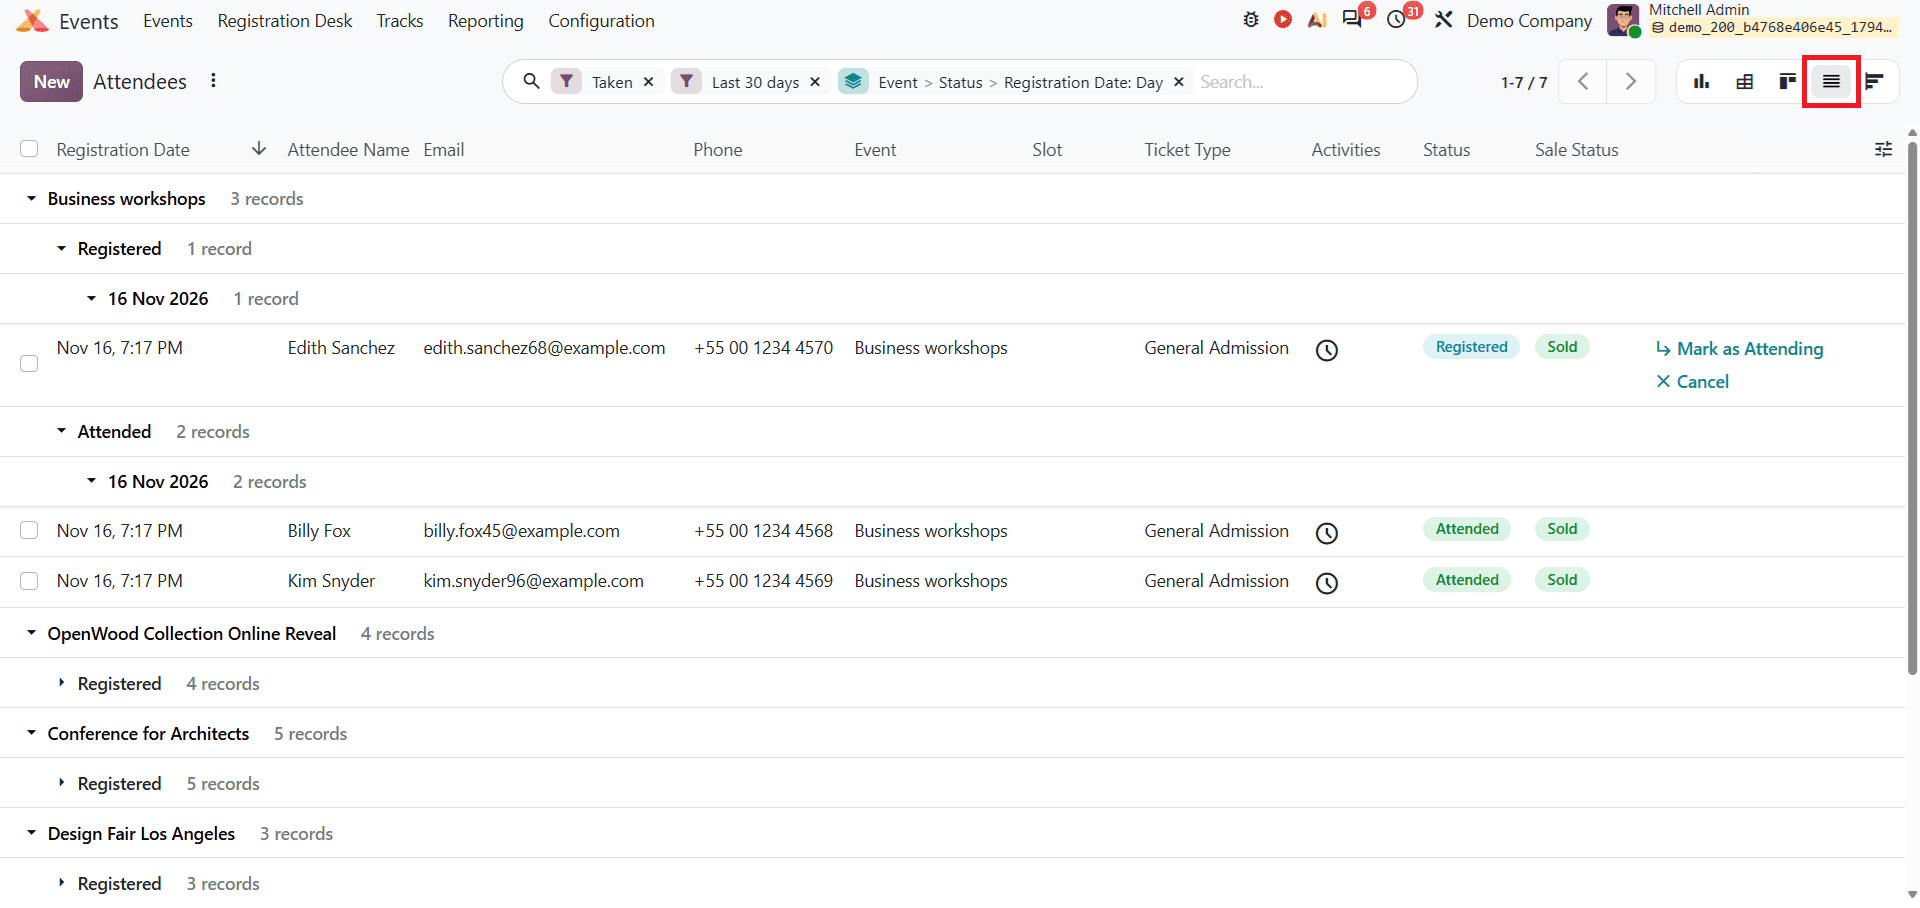
The List view displays attendee records in a structured format. It includes details such as Registration Date, Attendee Name, Email, Phone, Event, Slot, Ticket Type, Status, and Sale Status. Users can also group records by event and registration status to make it easier to review attendee information. By clicking on an individual attendee record, users can open its form view to access additional registration details and information provided during registration.
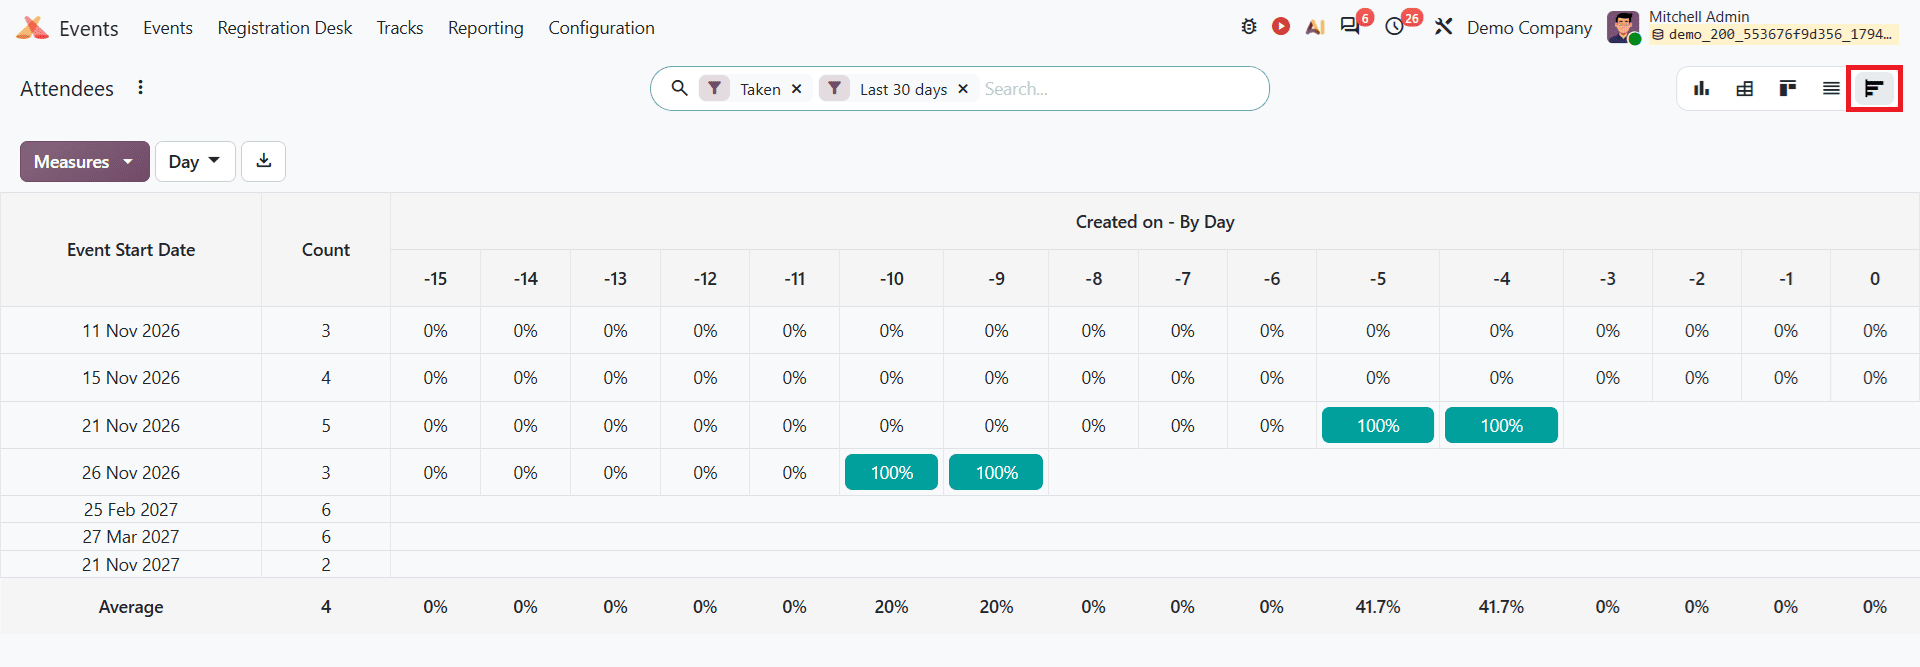
The Cohort view helps users analyse the percentage of event registrations per time interval over a specific period. It organizes the records based on the event start date and attendee count. Users can also adjust the time interval to analyse data by Day, Week, Month, Quarter, and Year. The measure option allows users to analyse attendee count. By clicking on an individual cell, users can access the corresponding attendee records for further analysis.
Users can also apply filters to narrow down the attendee data and save frequently used searches under Favorites for further access. The available filter options are shown below.
Revenues Report
Select Revenues from the Reporting menu. The Revenue report helps users track and analyse the financial performance of their events in Odoo 20. It is available in Graph and Pivot Views. It also includes a filter and grouping menu to customize the report.
Graph views
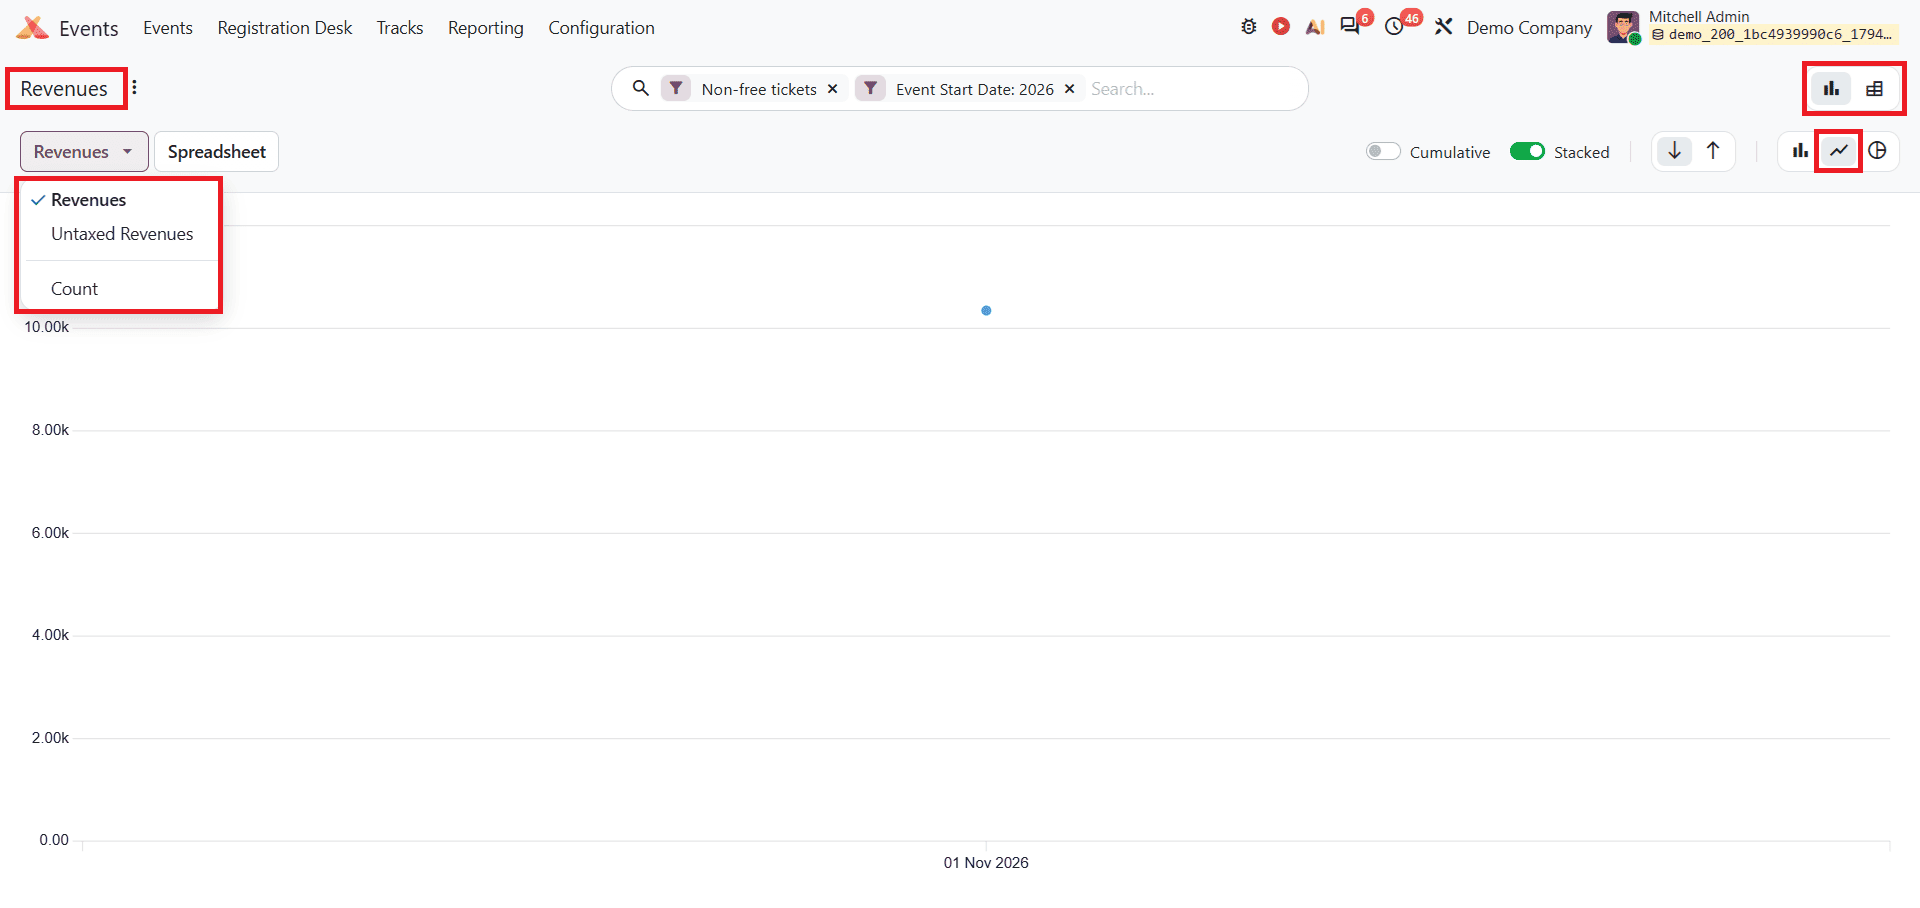
By default, Odoo 20 displays the Revenues report as a stacked Line Chart filtered by non-free tickets and the current year's event start date. It helps users track event ticket revenue trends and growth over time. This report includes three measures: Revenues, Untaxed Revenue, and Count. Users can select the required measure from the Measures drop-down to analyse different aspects of the event performance.
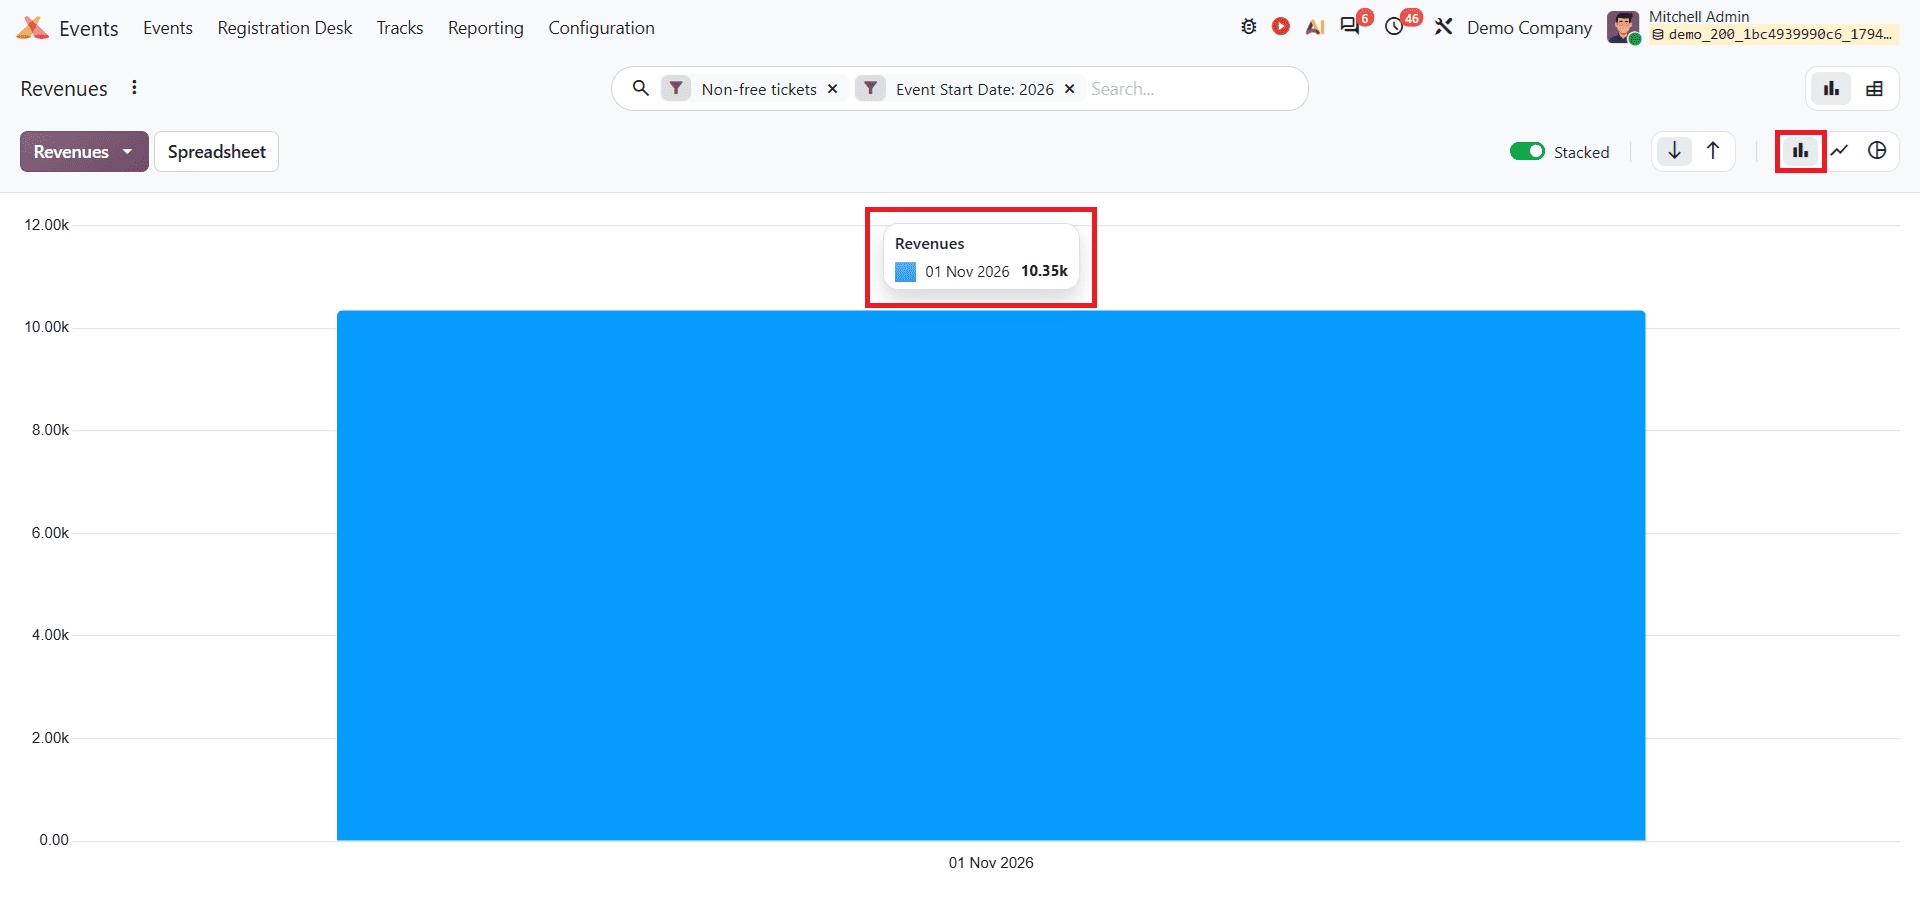
The Bar Chart represents event revenue using vertical bars, making it easier to visualise and compare revenue figures. Users can hover over a bar to view the corresponding revenue value for a specific period, as shown below.
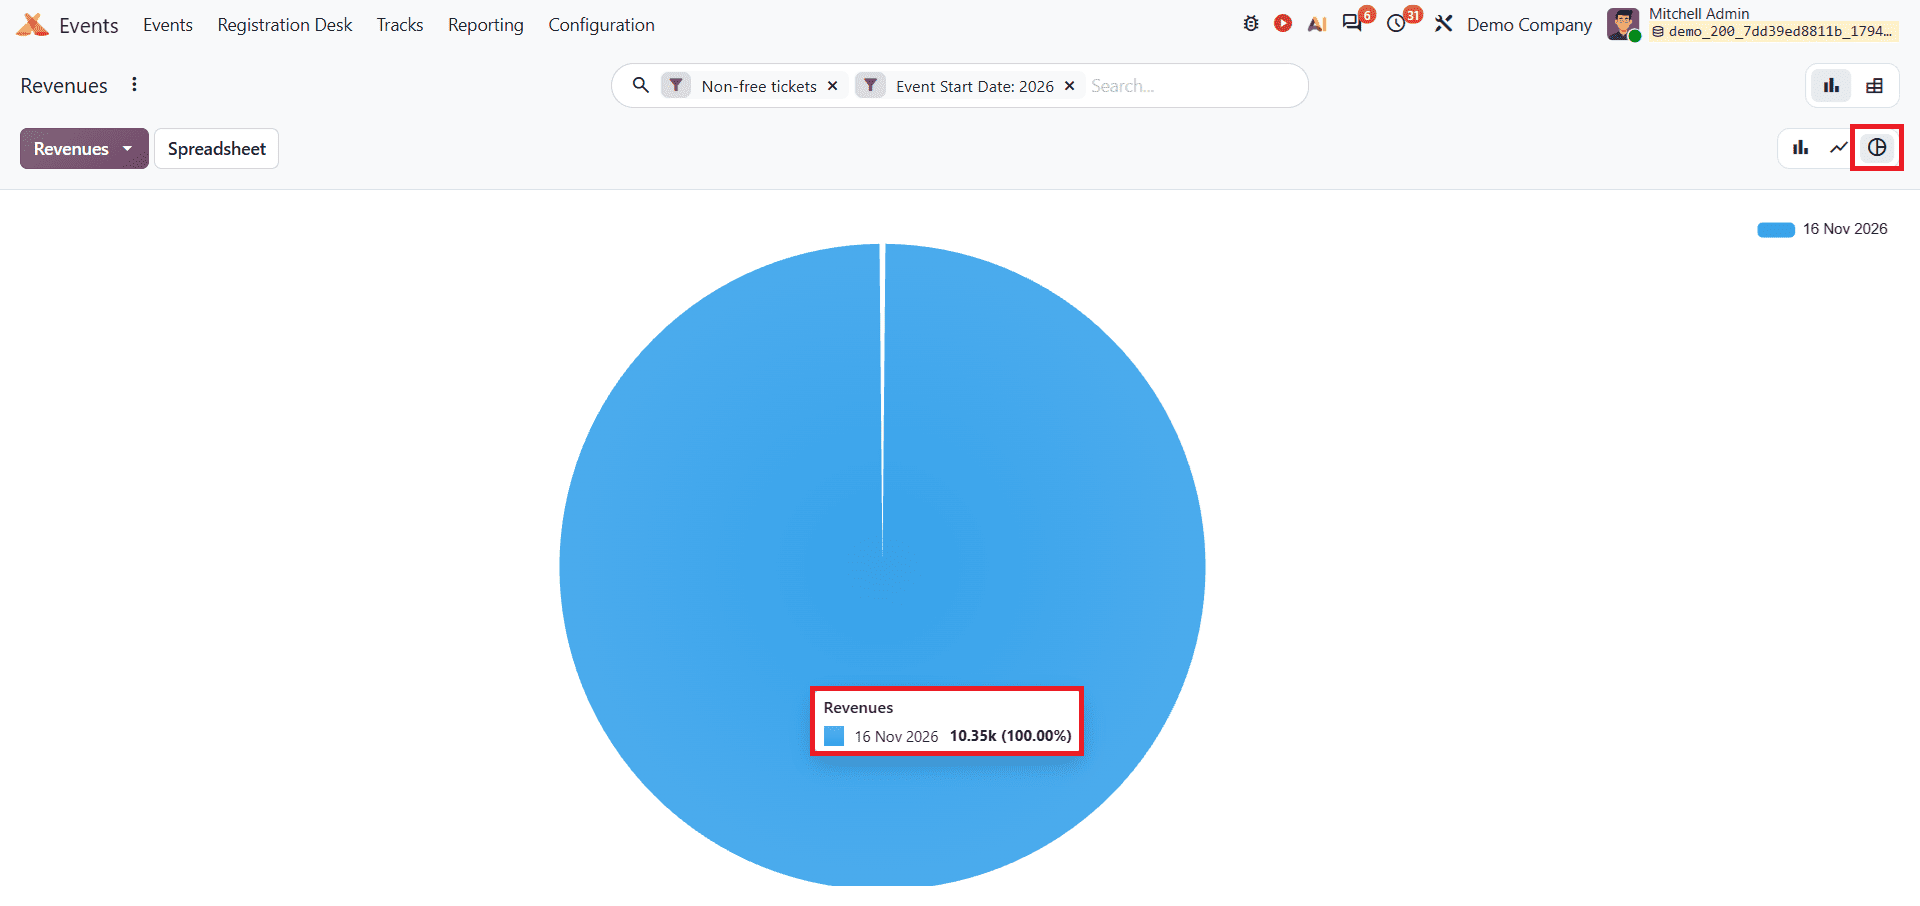
The Pie Chart provides a visual representation of event revenue, displaying the proportion of revenue generated across different categories. Each segment represents a share of total revenue, helping users understand revenue distribution. By applying different filters and grouping options, users can analyse revenue contribution from individual events or other criteria.
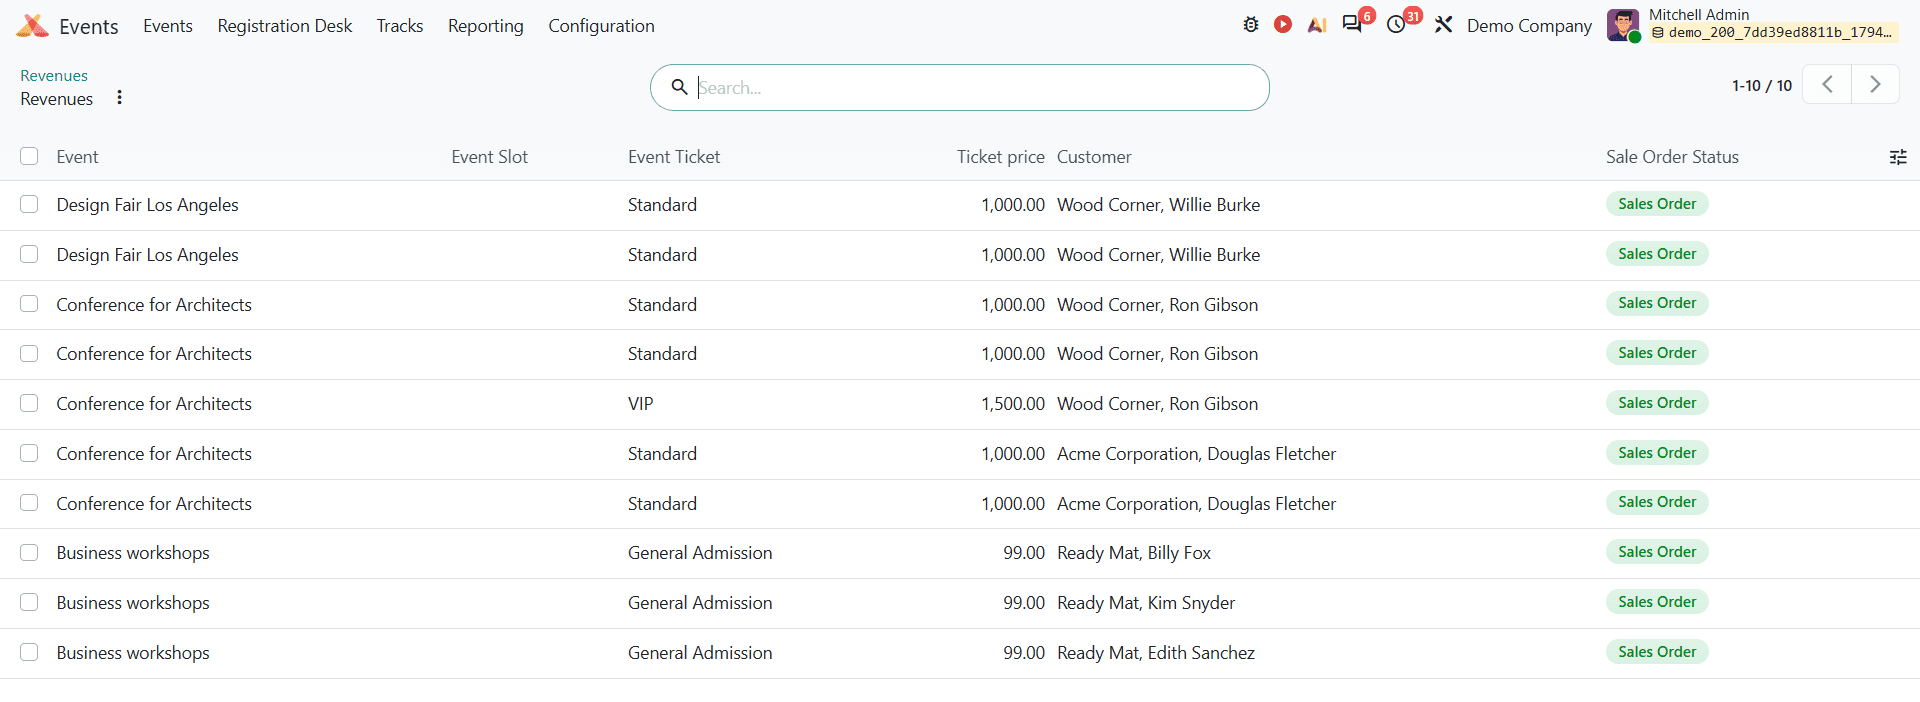
When the user clicks on the diagram, they can see the details as shown below.
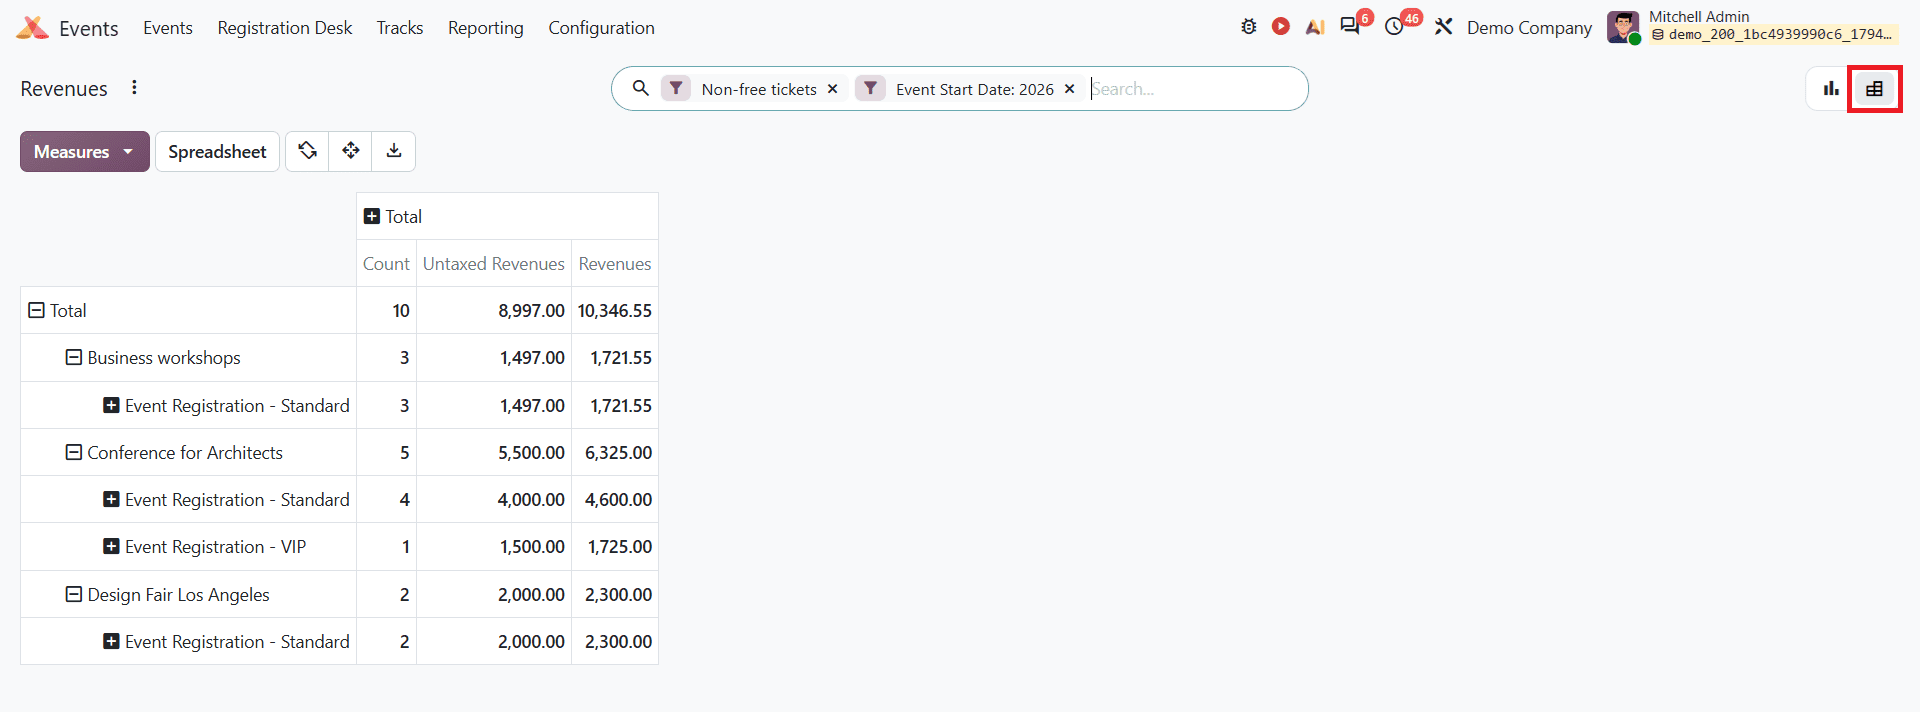
The Pivot view provides a detailed analysis of event revenue in a tabular format. It displays measures such as Count, Untaxed Revenues, and Revenues, with the event name and product in a single view. It helps users break down data for deeper analysis.
Analyzing Ticket Revenue using Filters
Odoo 20 provides different filtering and grouping options to help users analyze event revenues based on specific requirements. Users can access these options from the search bar. The available revenue report options are given below.
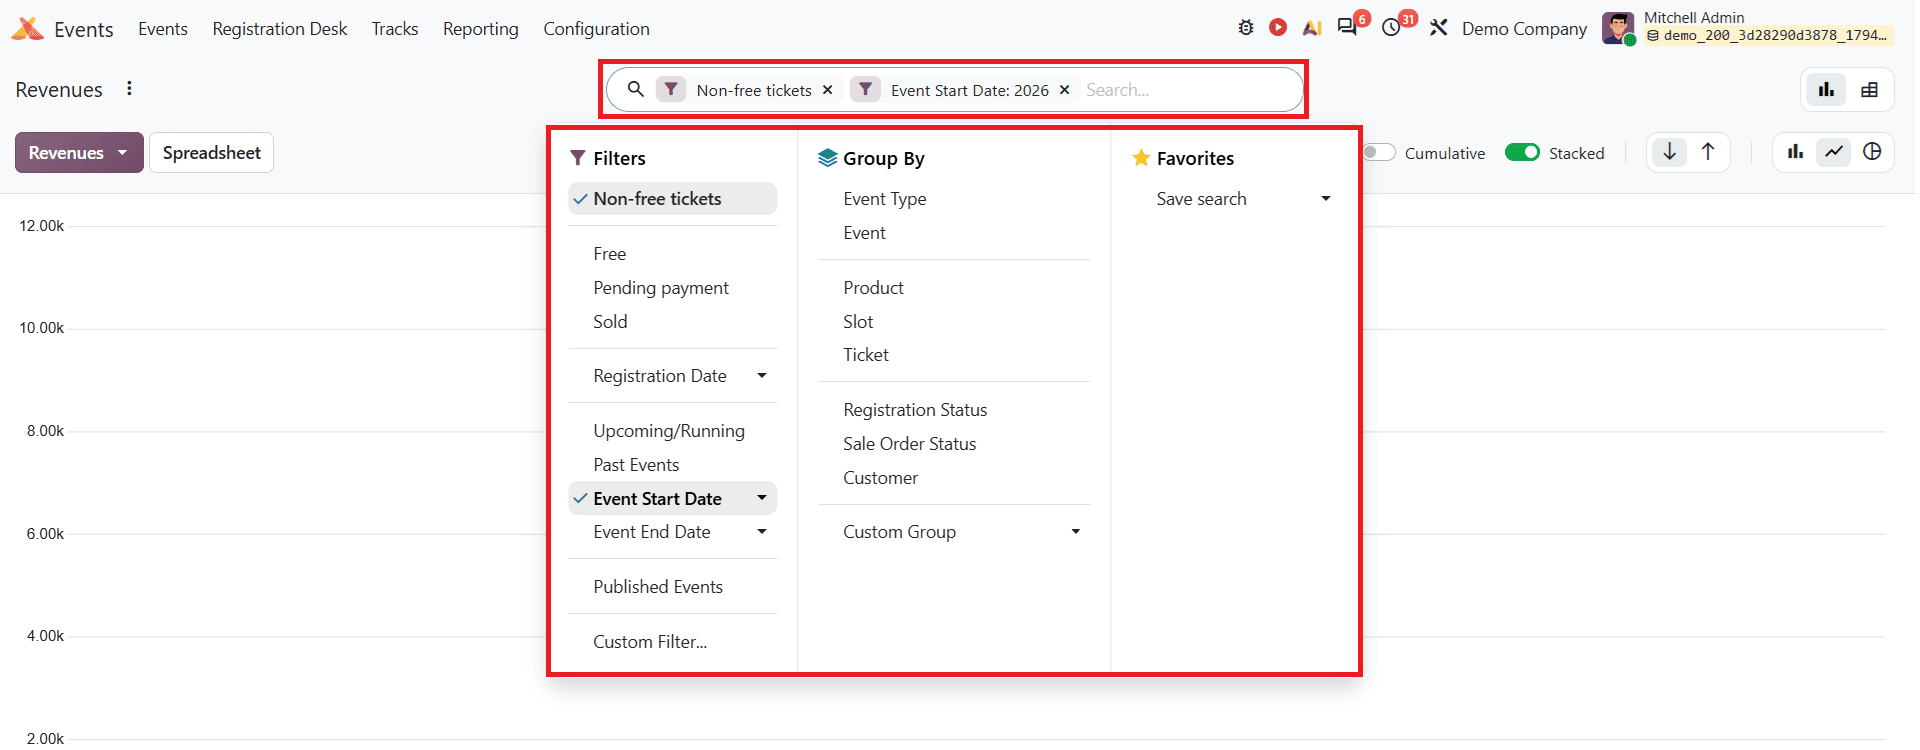
The Filter options include Non-free tickets, Free, Pending Payment, Sold, Registration Date, Upcoming/Running, Past Events, Event Start Date, Event End Date, and Published Events. Users can also create custom filters to break down revenue data.
The Group By option helps users organise revenue records based on different groups such as Event Type, Event, Product, Ticket, Registration Status, Sale Order Status, and Customer. Multiple grouping options can be selected together, and users can also create custom groups for more detailed analysis.
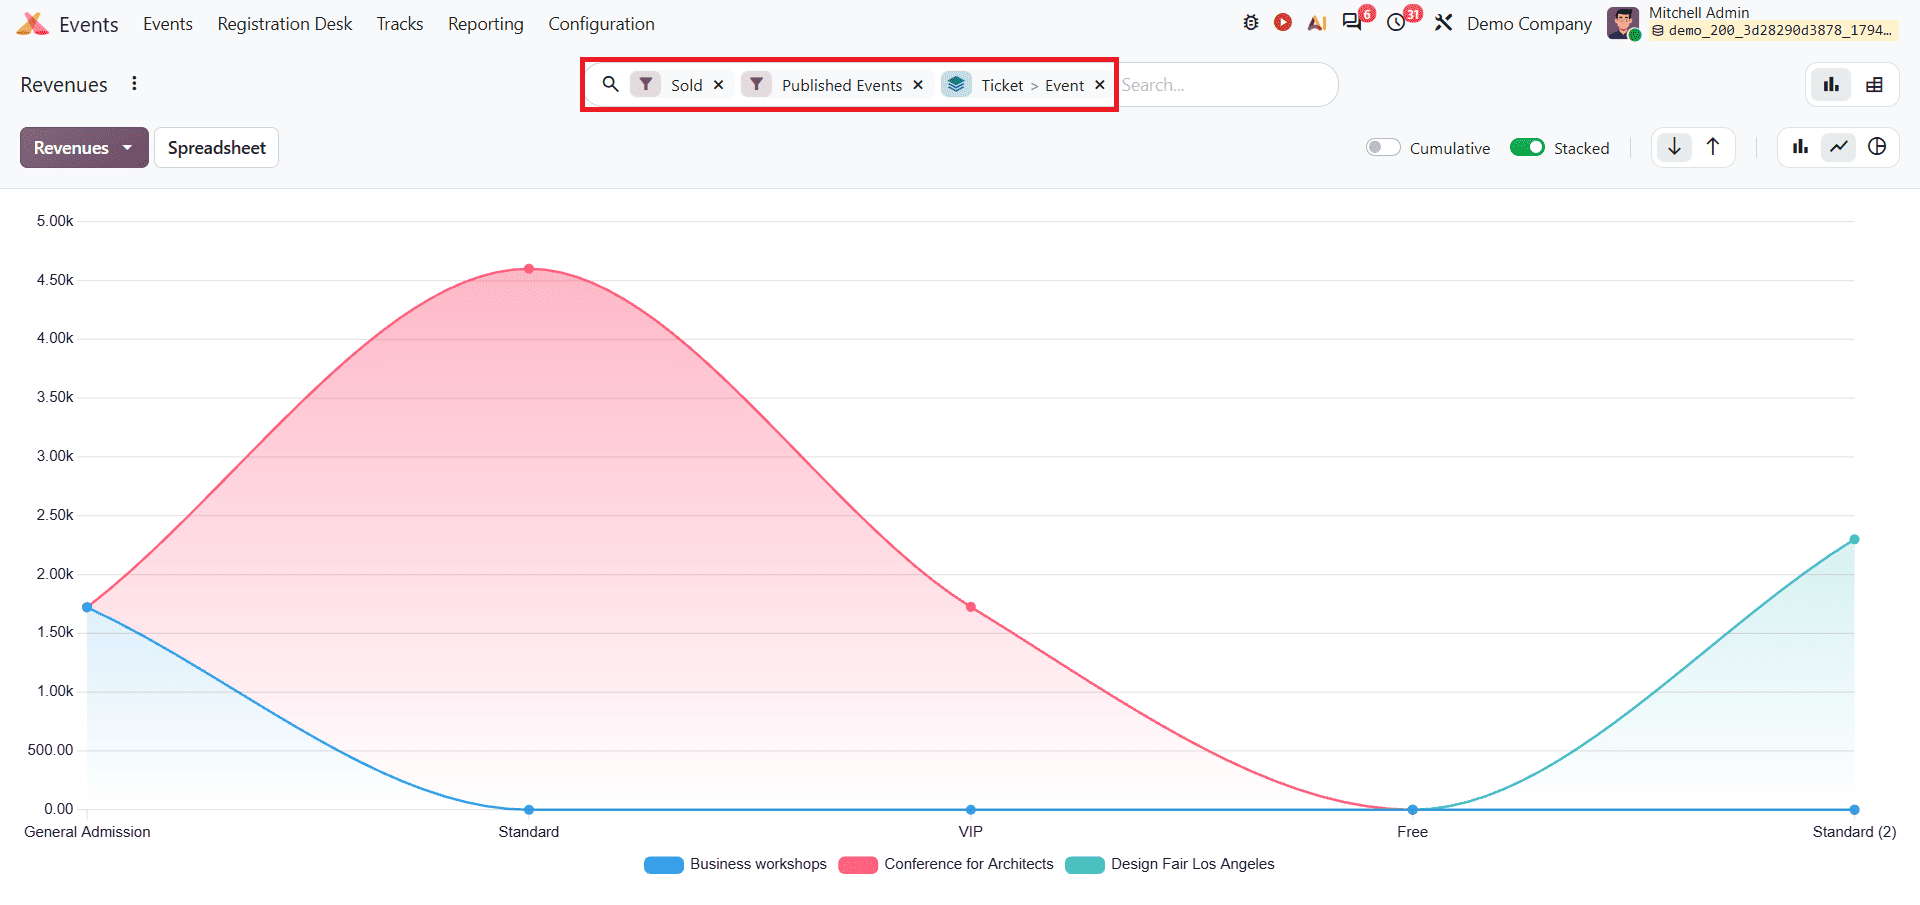
To analyse ticket revenue in the Odoo 20 Event Revenue report, open the search bar filter group and select options such as Free, Sold, or Published events. Next, in the Group By menu, select Event, followed by Ticket. This organises the display of performance metrics by events and breaks them down by ticket type. For example, you can see the ticket revenue graph as shown below.
Odoo 20 Event Report provides useful insights into event registrations, attendee information, and revenue performance. With different reporting views and filtering options, users can examine attendee records, track registration trends, and analyse revenue generated from events. These reporting options help businesses to understand their event performance and make better decisions for organising future events.
To read more about How to Analyze Recruitment Performance with Odoo 20 Reports, refer to our blog, How to Analyze Recruitment Performance with Odoo 20 Reports.