Studio Book V17: Line Chart

In Odoo 17, a Line chart serves as a visual representation illustrating data points connected by straight line segments. This tool is employed to portray trends and variations over time, where the horizontal axis denotes the time, and the vertical axis represents the corresponding data values.

Example of Line Chart:

odoo-studio

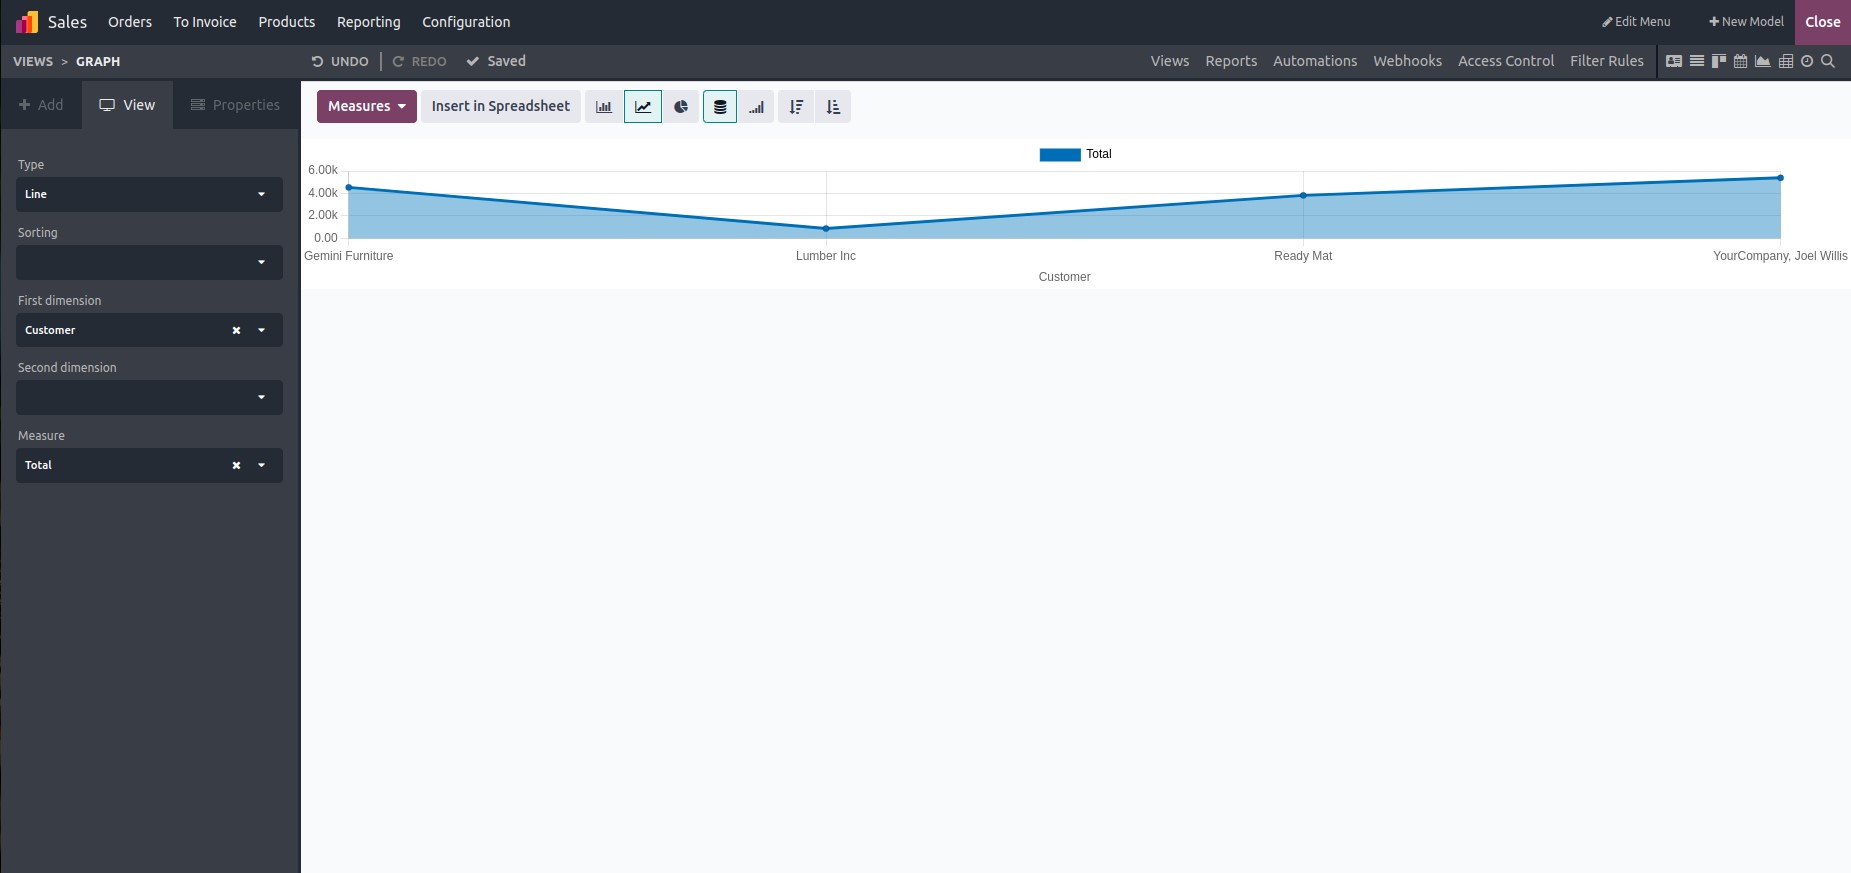
Let's make a line chart in the studio module:

  • In Odoo 17, access the Studio module and select the specific model for which you intend to create a line chart.
  • Select the "Graph View" from the available views by clicking on the Views tab in Odoo 17.
    odoo-studio
  • Choose “Line” as the chart type.
    odoo-studio
  • Choose the fields for the first dimension and second dimension, and measure. These will vary for the models.

    1.) Configure the first dimension: this pertains to the X-axis of the chart, organizing data according to a specific property or category in Odoo 17.

    odoo-studio

    2.) Specify the second dimension; this corresponds to the Y-axis of the chart in Odoo 17. It represents the value or quantity being measured and is identified as the Second Dimension.

    odoo-studio

    3.) The measure refers to the value or quantity represented on the chart's Y-axis.

    odoo-studio
  • In the Studio module, the line chart can be sorted either in descending or ascending order.
    odoo-studio
  • Ascending order in the studio module
    odoo-studio
whatsapp
location

Calicut

Cybrosys Technologies Pvt. Ltd.
Neospace, Kinfra Techno Park
Kakkancherry, Calicut
Kerala, India - 673635

location

Kochi

Cybrosys Technologies Pvt. Ltd.
1st Floor, Thapasya Building,
Infopark, Kakkanad,
Kochi, India - 682030.

location

Bangalore

Cybrosys Techno Solutions
The Estate, 8th Floor,
Dickenson Road,
Bangalore, India - 560042

Send Us A Message