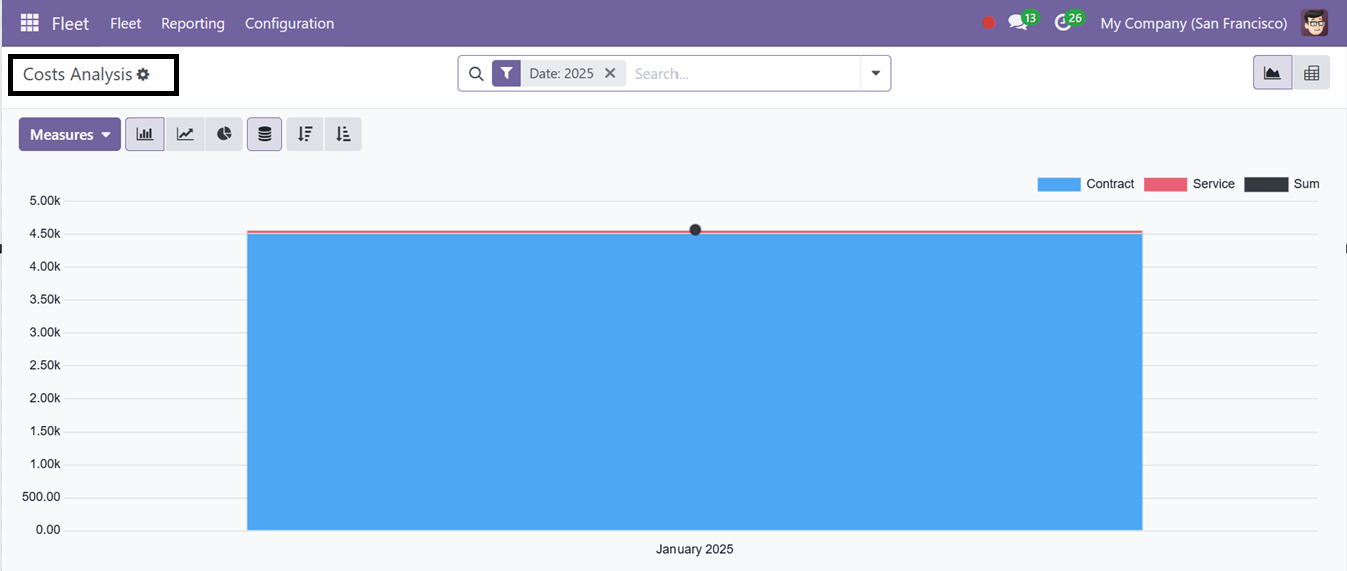
The Fleet module’s ‘Reporting’ menu option enables you to generate detailed reports on service costs through its ‘Cost Analysis’ reporting window. With both graphical and pivot views, the reporting tool offers quick insights.
Inside the graphical representation, the X-axis typically shows the date, while the Y-axis reflects the cost, as illustrated in the screenshot below.
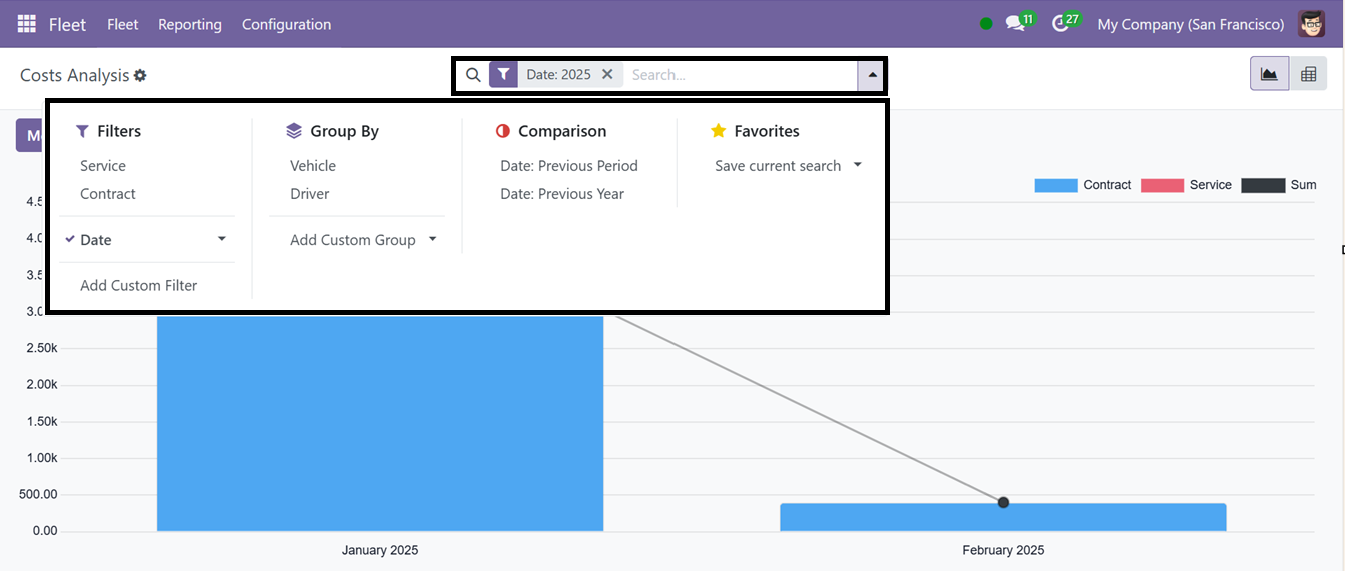
You can view key metrics such as Count and Cost on the ‘Measures’ section. Sorting options such as Filters and Group By help create customized reports. The Comparison filter can be used to compare the costs based on various dates. Also, you can mark the favorite filter data using the ‘Favorites’ option provided inside the advanced search bar area.
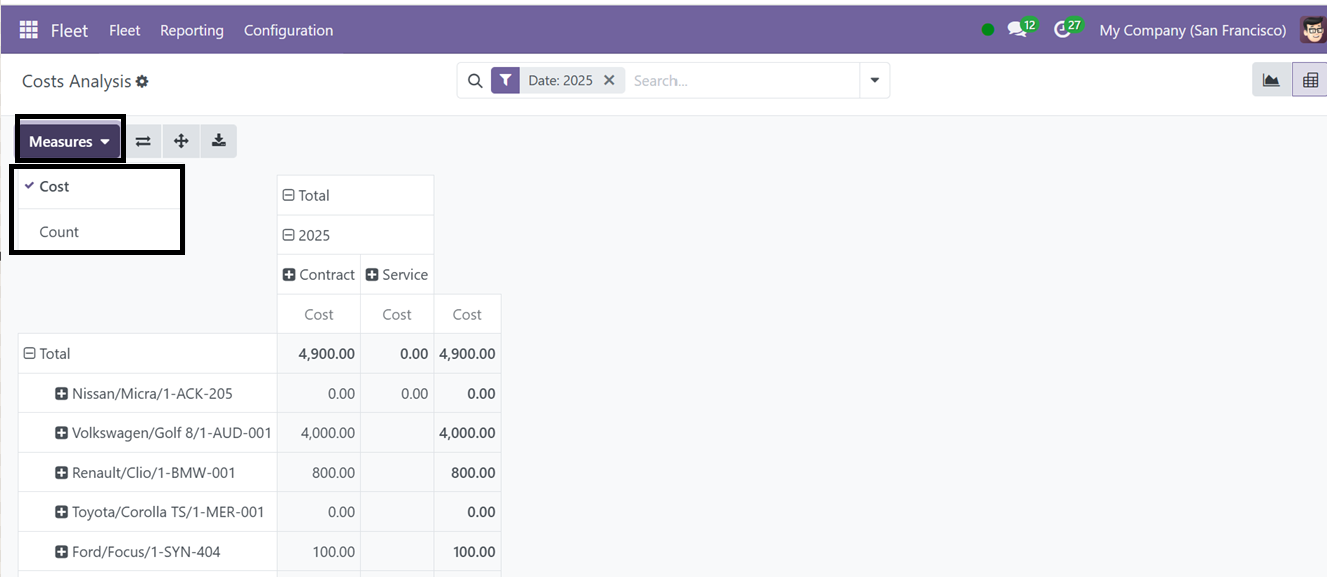
Odoo's Cost Analysis reporting window features a robust Pivot View, allowing users to interact with data in a flexible and detailed manner. This feature allows users to manipulate data dynamically using expandable pivot axes, revealing granular details like individual expenses within a department or costs associated with specific products. Users can customize data representation, drill down for granularity, and apply filters and measures to derive deeper insights.
The Fleet Management Module in Odoo 18 is a powerful tool for companies to efficiently manage their vehicles. It streamlines fleet operations, including fuel consumption tracking, scheduling services, driver assignments, and contracts. It integrates with other Odoo modules, eliminating the need for external tracking systems. The module also offers automation features, allowing users to set alerts for contract renewals and maintenance. This unified platform allows businesses to optimize fleet management, reduce costs, and ensure smooth operations, all within a single, unified platform.