Profiling
Code profiling involves a dynamic analysis of a program, evaluating factors such as its complexity, execution time, frequency of function calls, and memory consumption. Utilizing a profiler, which is a dedicated tool for code profiling, allows for a detailed examination of code performance. Profiling is conducted through the performance analysis of either source code or binary executables.
Profilers help developers to understand how well their program performs on different platforms. They pinpoint specific parts of the code that might be slowing down the program, allowing developers to optimize those sections for better overall performance. Essentially, profiling is a useful approach for identifying and addressing performance bottlenecks in software.
There are primarily two categories of profilers:
● Server-side profilers:
These profilers monitor transaction request metrics, such as the duration of web requests and any failures. They track the performance of each line of code.
● Desktop profilers:
Desktop profilers, on the other hand, focus on monitoring memory usage and garbage collection. They provide insights into how well the code performs in terms of memory management.
In summary, server-side profilers analyze transaction times and failures, while desktop profilers concentrate on memory-related aspects like usage and garbage collection.
Graph a method
Odoo incorporates a built-in profiler within its code, allowing the generation of graphs illustrating function calls, execution time, memory usage, and more. To conduct analysis for a specific function, you can integrate the following code snippet into that particular function.
from odoo.tools.misc import profile
[...]
@profile('/path/prof.profile')
def mymethod(...)
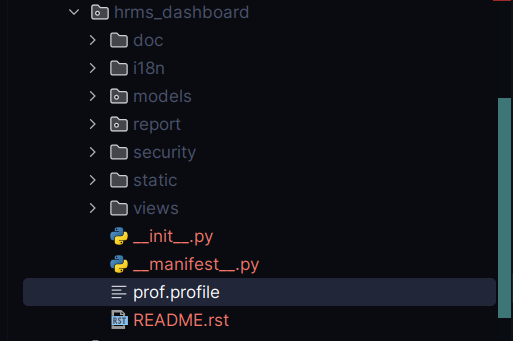
The @profile('/path/prof.profile') annotation should contain the desired file path, specifying where you want the resulting 'prof.profile' file to be created. When you use this code snippet, it generates a file named 'prof.profile' in the specified location ("/path/").
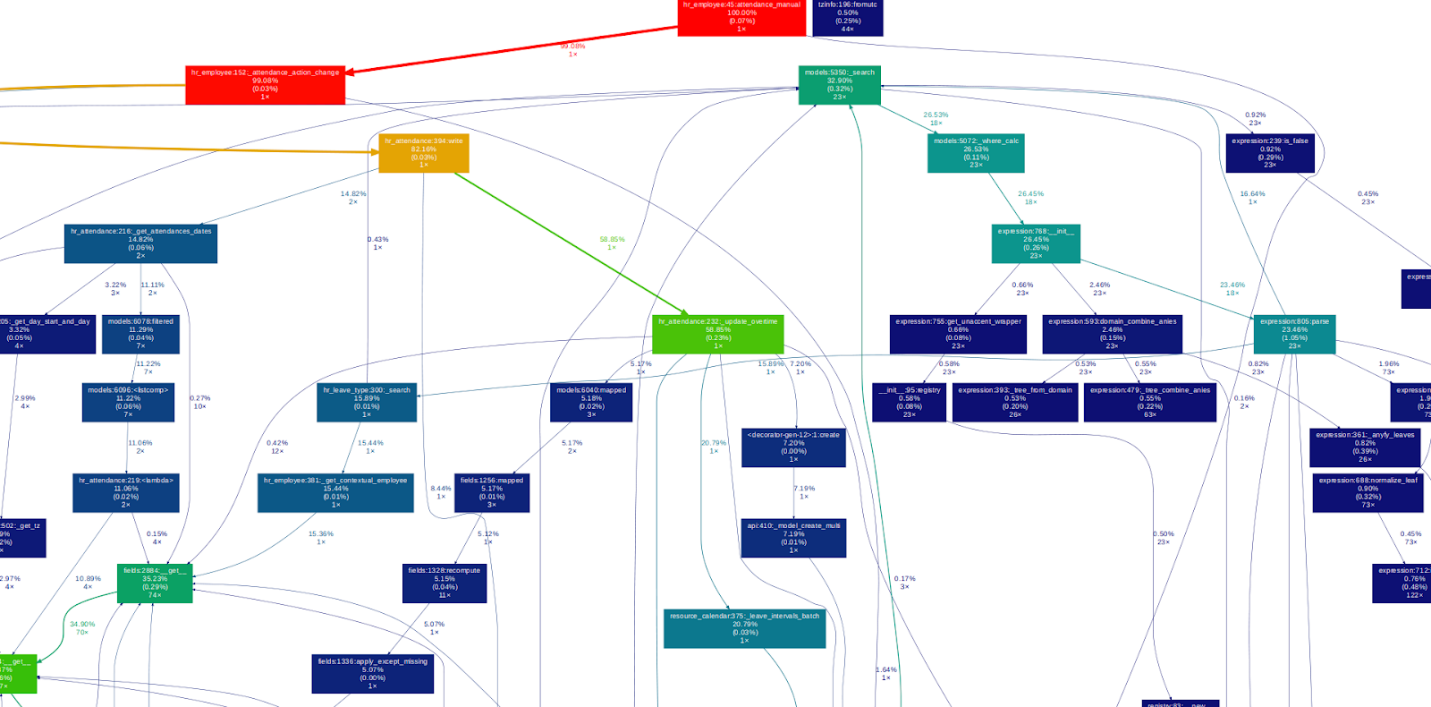
You can employ the tool gprof2dot to generate a graphical representation of the analysis results.
gprof2dot -f pstats -o /path/prof.xdot /path/prof.profile
Execute the provided command in the terminal, replacing "/path/prof.profile" and "/path/prof.xdot" with the actual file paths you intend to use.
To view the graphical analysis, you can utilize the following command.
xdot /path/prof.xdot
To observe the graphical analysis, we make use of the xdot tool. This tool helps visualize the analysis, offering a representation as below.
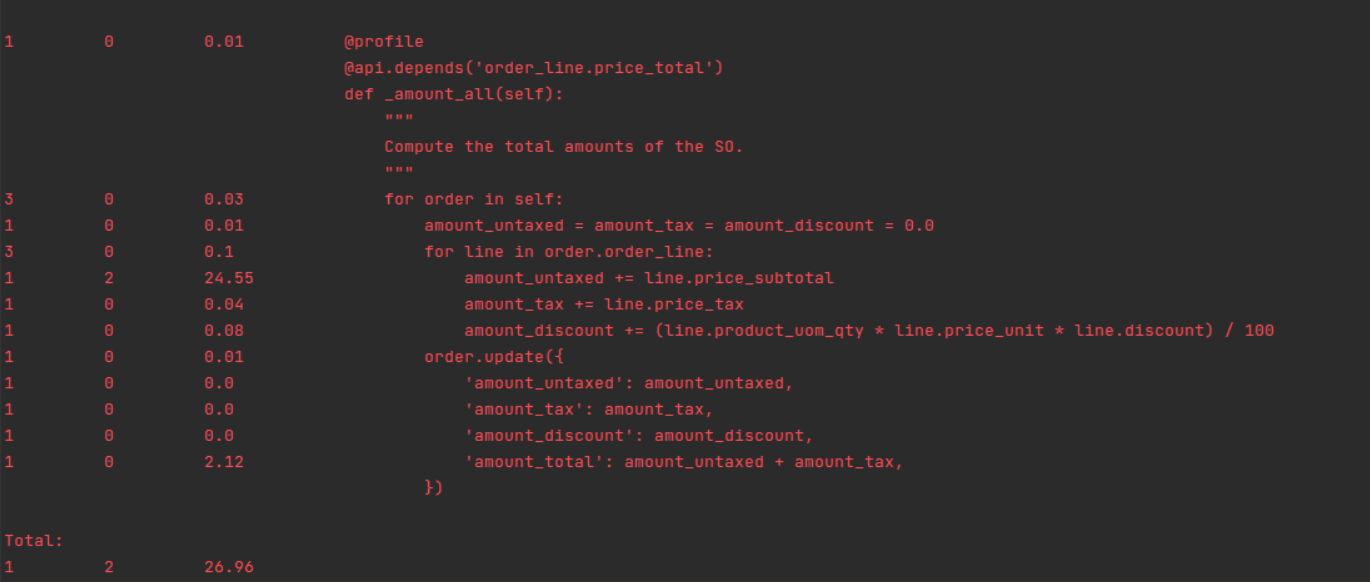
Log a Method
To log statistical data for a method using a different profiler, you can employ the provided code.
from odoo.tools.profiler import profile
[...]
@profile
@api.model
def mymethod(...):
Once the procedure to be analyzed has been thoroughly assessed, the statistics will be provided in the logs.
Tracing Code Execution
A tool named pyflame is handy for examining underperforming processes. To begin, install pyflame and flamegraph. The flame graph, a visual representation, helps analyze the results effectively. Simply put, it displays the call stack in a graphical format.
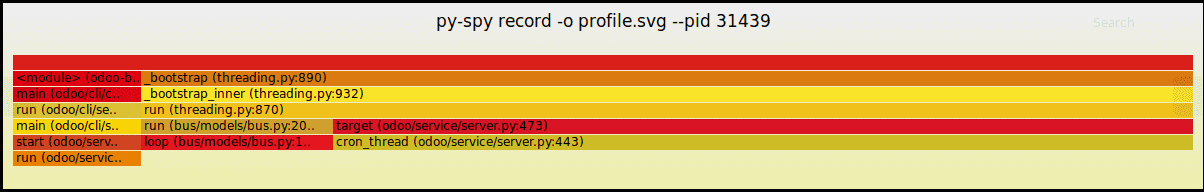
pip3 install py-spy
Now that py-spy is installed, it captures the lines of code being executed. This tool records the stack trace of the process several times per second.
udo env "PATH=$PATH" py-spy record -o profile.svg --pid
Replace with the specific Process ID of the Odoo process that you wish to create a graph for.