35. Accounting Reports
Odoo offers a robust and user-friendly reporting framework that
allows businesses to generate detailed financial reports like tax
reports, balance sheets, and income statements. To create or
customize these reports, go to Accounting ‣ Configuration ‣
Management: Accounting Reports.
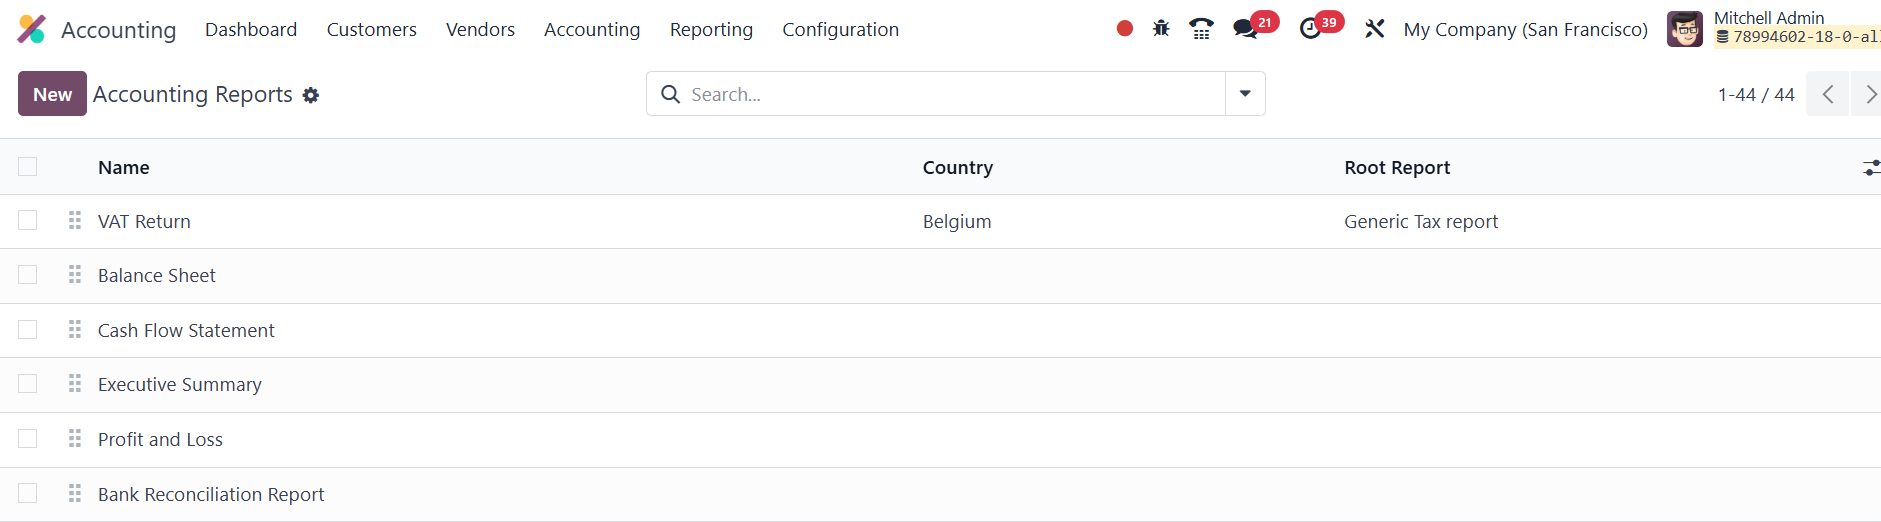
Here, you have the option to create either a root report or a
variant.
A root report serves as a generic template that can be customized
further for specific accounting practices. If a report doesn't
reference another as a root, it is automatically treated as a root
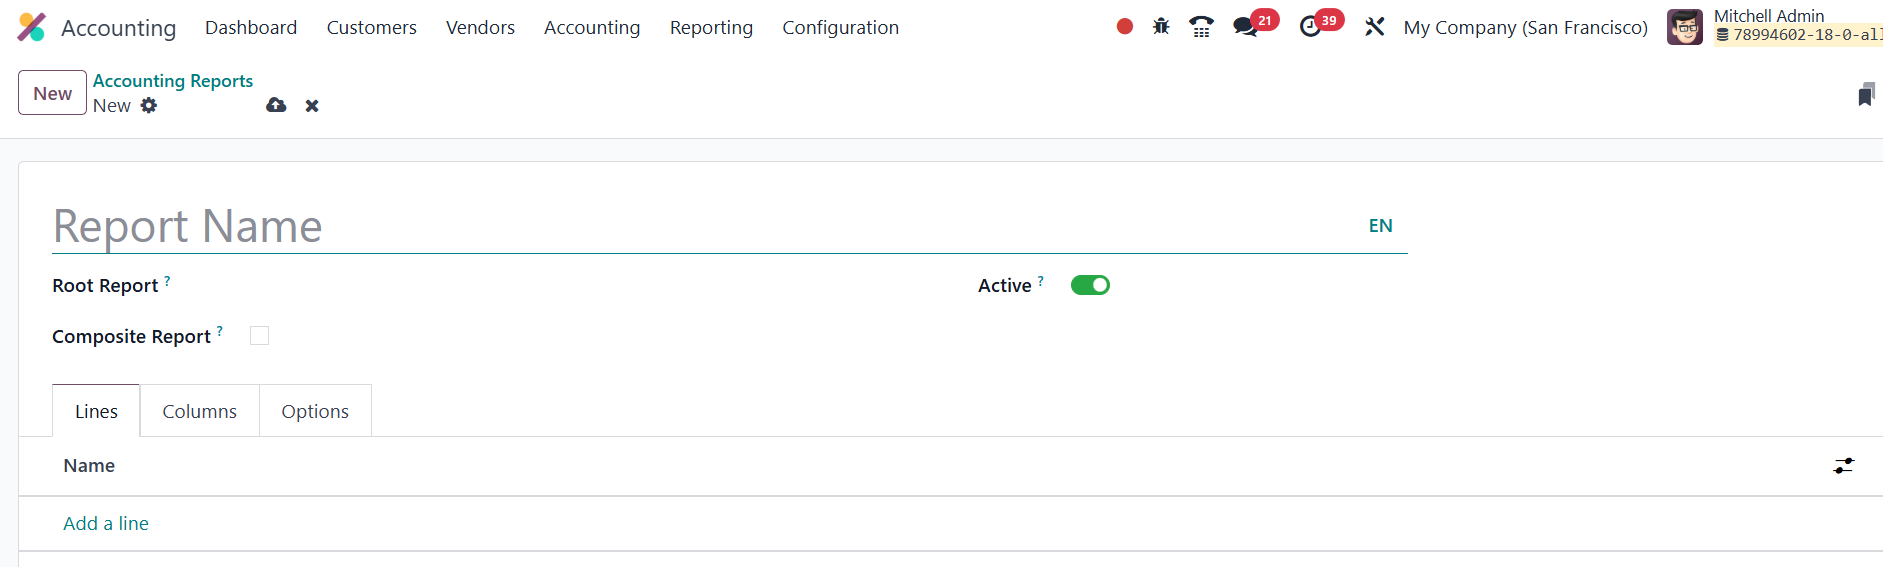
report itself. After creating your report, you will need to add
lines to it, either by clicking Add a line to create a new entry or
by selecting an existing one for modification.
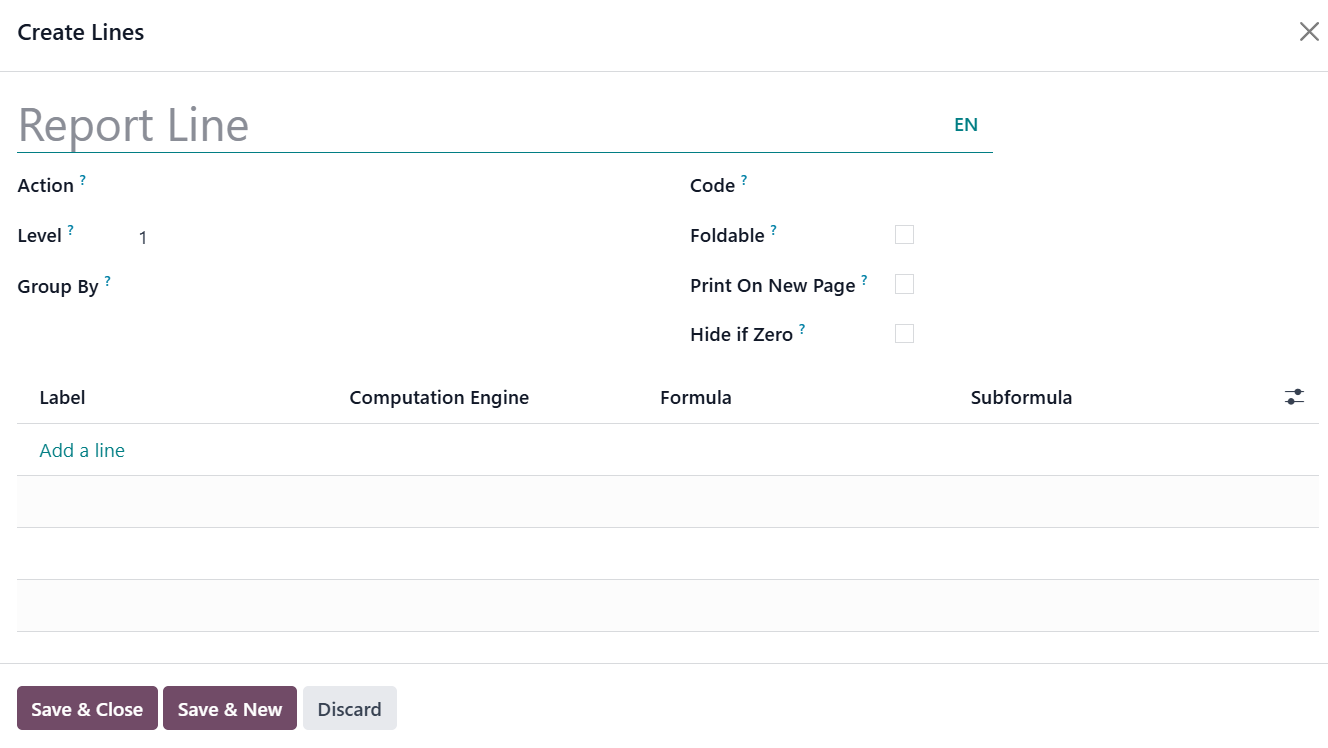
Each line requires a Name, and you can optionally assign a Code to
each line if you intend to use it in formulas. When creating an
expression in Odoo 18, you must assign a unique label to identify it
within each line. This label ensures that the expression can be
distinctly referenced. Additionally, you must specify both a
Computation Engine and a Formula. The computation engine determines
how the formula and any subformulas are interpreted; different
engines may use different logic or syntax. Notably, Odoo allows
mixing expressions that use various computation engines within the
same line, offering flexibility for complex calculations and
reporting needs.
Reports in Odoo can accommodate multiple columns, with each column
pulling values from expressions defined in the lines.
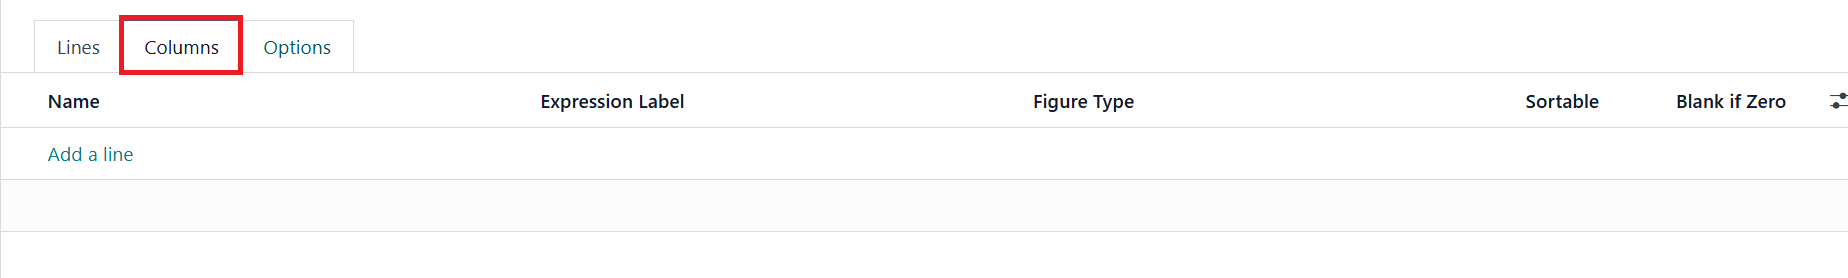
The expression_label field of each column defines the label of the
expression that will display its value. If a line does not have an
expression in the field, no value will appear in that column. For
reports with multiple columns, ensure that each column has a
distinct expression_label to differentiate the displayed values.
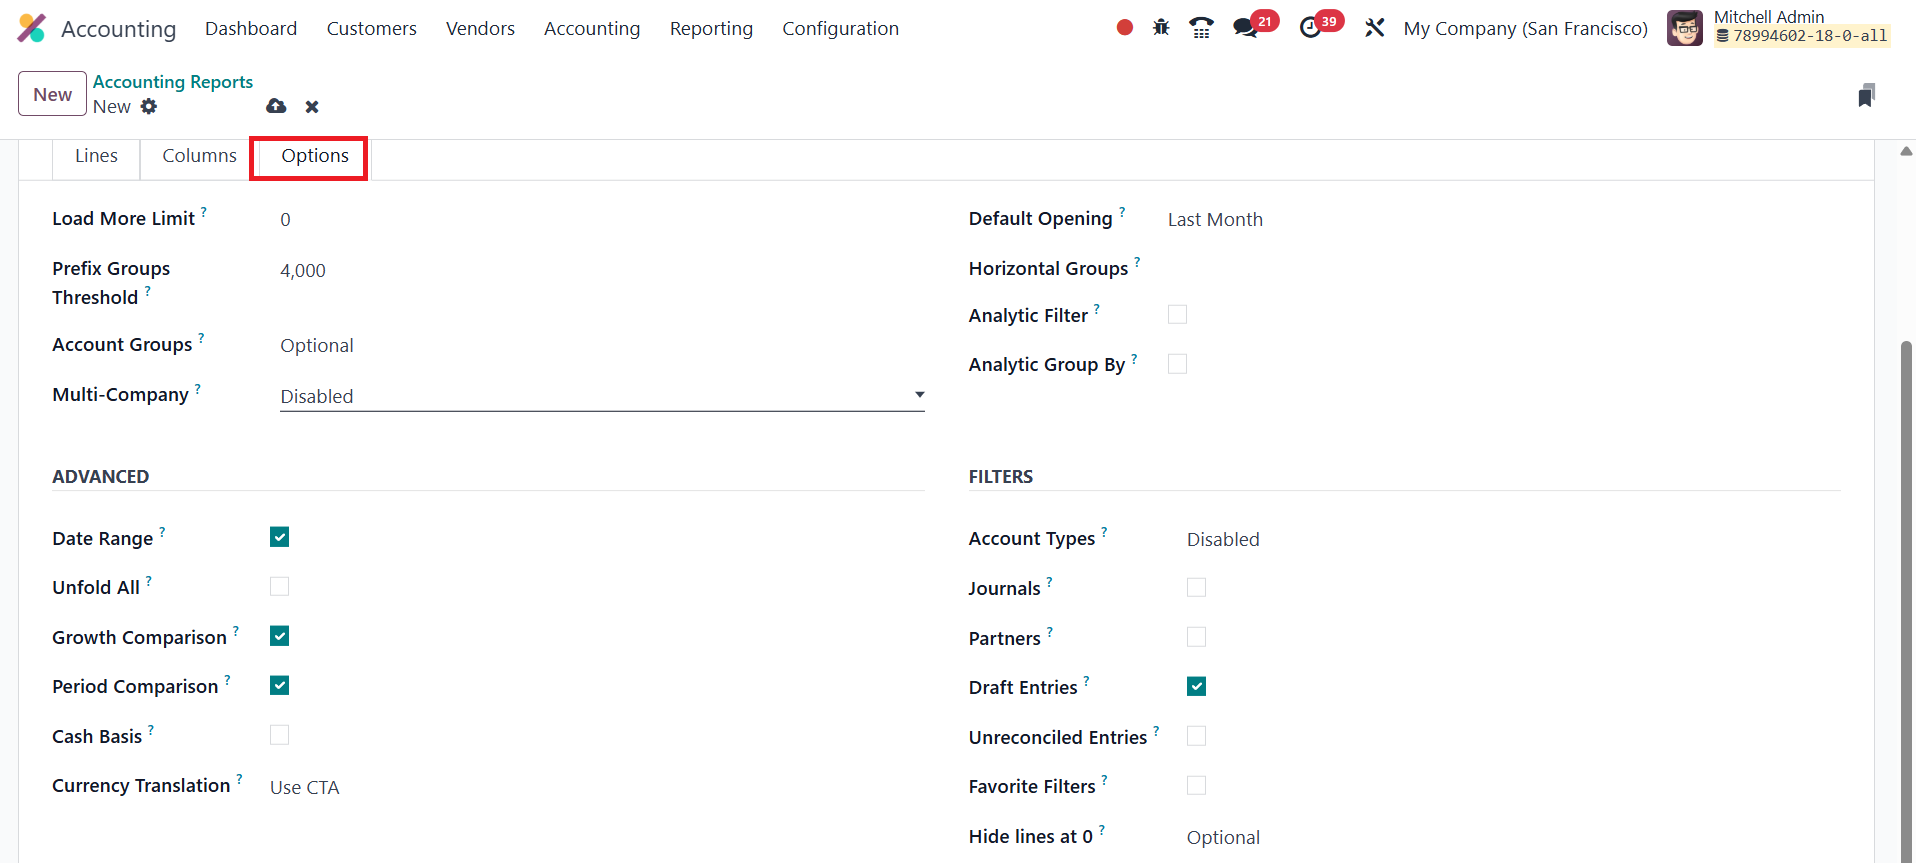
The Load More Limit allows you to adjust the number of records
displayed at once. This is particularly useful when working with
large datasets, ensuring the report loads efficiently.
The Account Groups function offers three settings: Always, Optional,
and Enabled by Default, allowing you to control the inclusion of
account groups in the report. You can also customize the
Multi-Company Filter by enabling the Use Company Selector or Use Tax
Unit options. If multi-company reporting is not required, you can
disable this feature. For reports like the Aged Receivable, you can
set a Default Viewing Period, ensuring that the report is displayed
for a specific time period by default.
Further customization can be made by adding Horizontal Groups to
organize data visually and enabling Analytic Filters and Analytic
Group By for enhanced sorting and grouping options. These settings
provide more flexibility when analyzing financial data.
In the Advanced Options section, you can enable features like the
Date Range filter, which allows you to specify a date range for the
report, and the Unfold All option to expand all data rows. For those
seeking comparative analysis, the Growth Comparison and Period
Comparison features enable side-by-side financial data analysis
across different periods. Additionally, enabling Cash Basis Mode
allows for cash-based accounting reports. The Filters section also
lets you add specific filters like Account Types, Journals,
Partners, Draught Entries, and Unreconciled Entries to refine the
report further.
These advanced customization features provide comprehensive control
over how your reports are structured and displayed, allowing
businesses to gain deeper insights into their financial data.