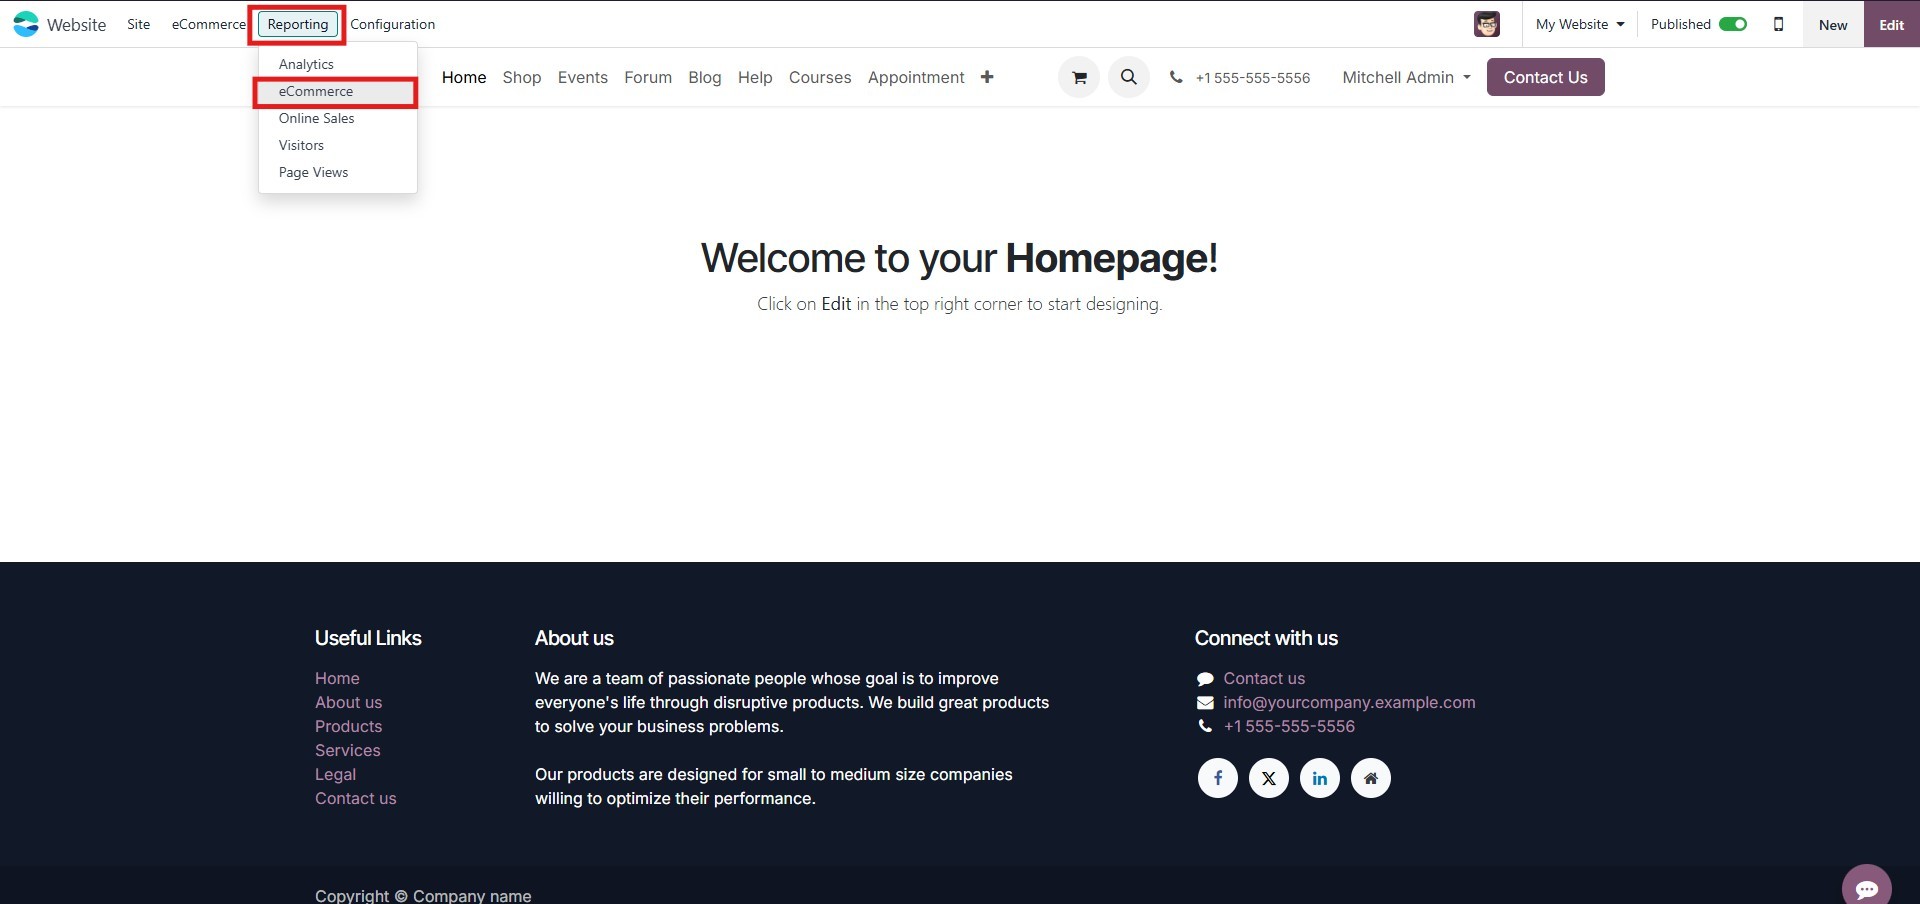
8. Online Sales Report
You can access the Online Sales Analysis by navigating to the
reporting section of the eCommerce module. This dashboard provides a
comprehensive overview of your online sales performance.
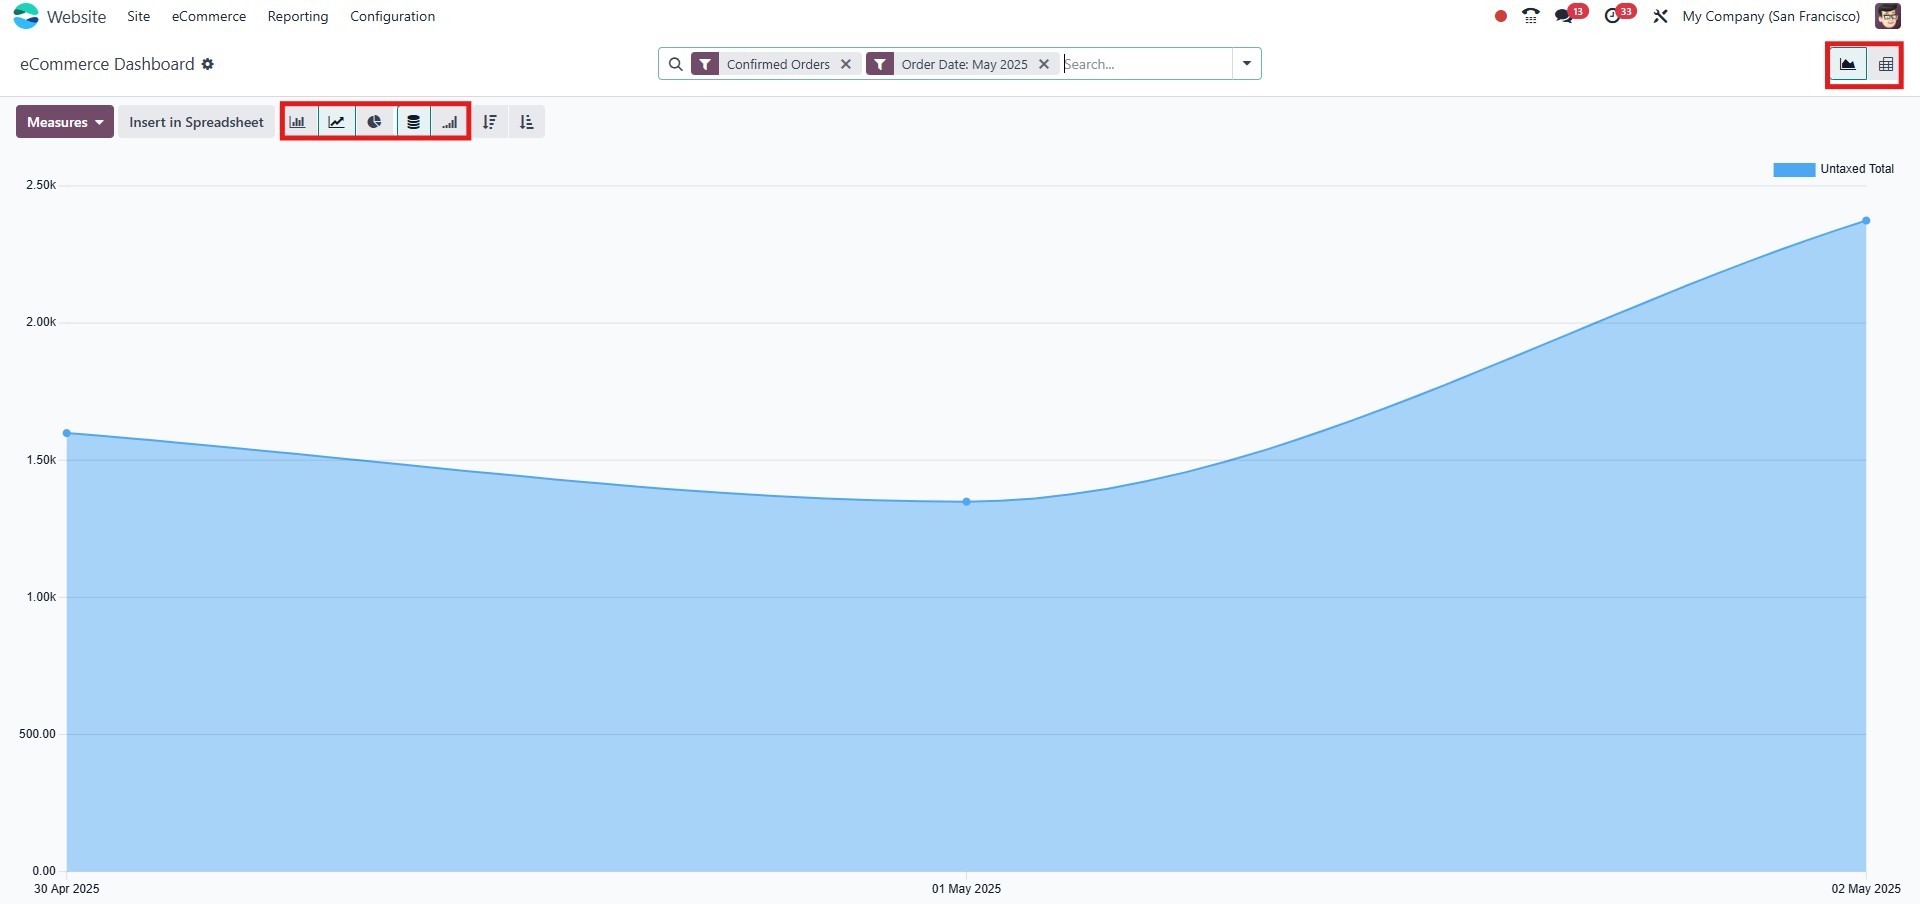
8.1 Graph View
In the Graph View, you can visualize key metrics related to your
eCommerce operations. Reports can be displayed using several chart
types, including:
- Bar Chart
- Line Chart
- Stacked Chart
- Pie Chart
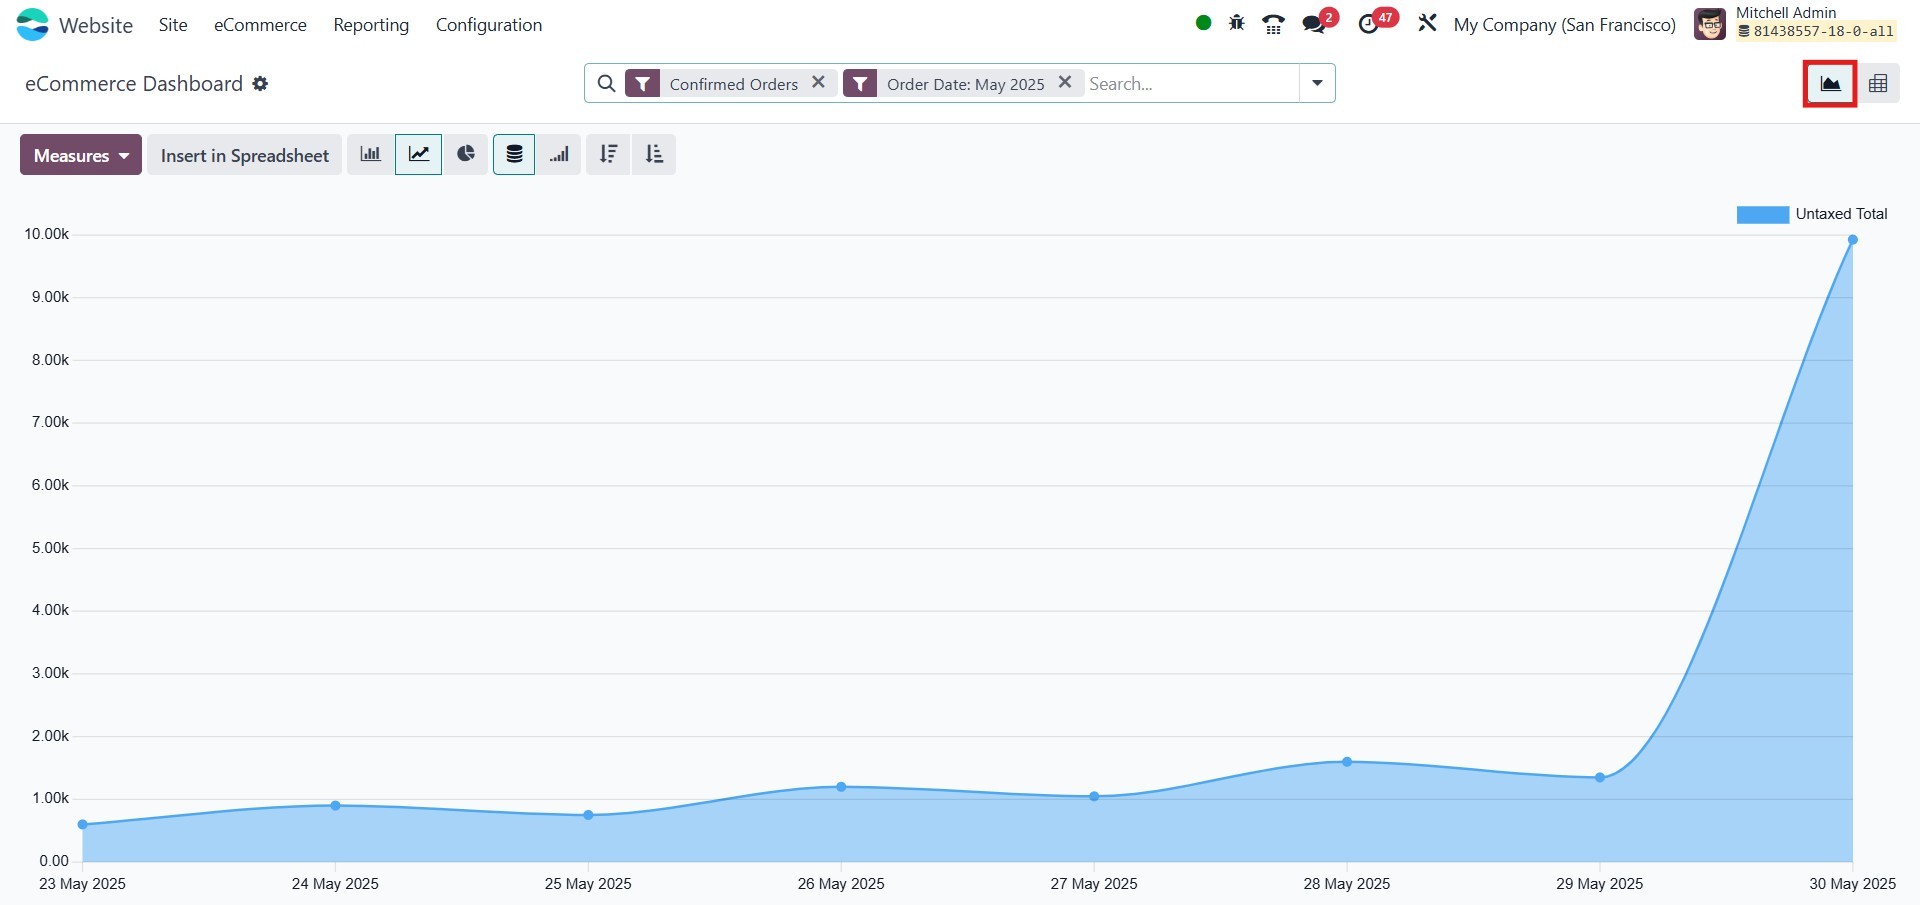
By selecting the appropriate icons, you can easily switch between
these chart formats and sort data in ascending or descending order.
You can analyze reports using a wide range of measures, accessible
under the Measures tab. Available metrics include:
- Number of Lines
- Discount %
- Discount Amount
- Gross Weight
- Quantity Delivered
- Quantity Invoiced
- Quantity Ordered
- Quantity To Deliver
- Quantity To Invoice
- Total
- Untaxed Amount Invoiced
- Untaxed Amount To Invoice
- Untaxed Total
- Volume
These measures provide valuable insights into sales trends, inventory
flow, and customer behavior.
8.2 Filters and Grouping
Use the Filters tab to refine your data. The default filter options
include:
- Order Date
- Unpaid Orders
- Confirmed Orders
For more specific reporting, you can create and apply custom filters
using the Add Custom Filter option.
The Group By menu helps you categorize data based on fields such as:
- Website
- Product
- Product Category
- Customer
- Customer Country
- Status
- Order Date
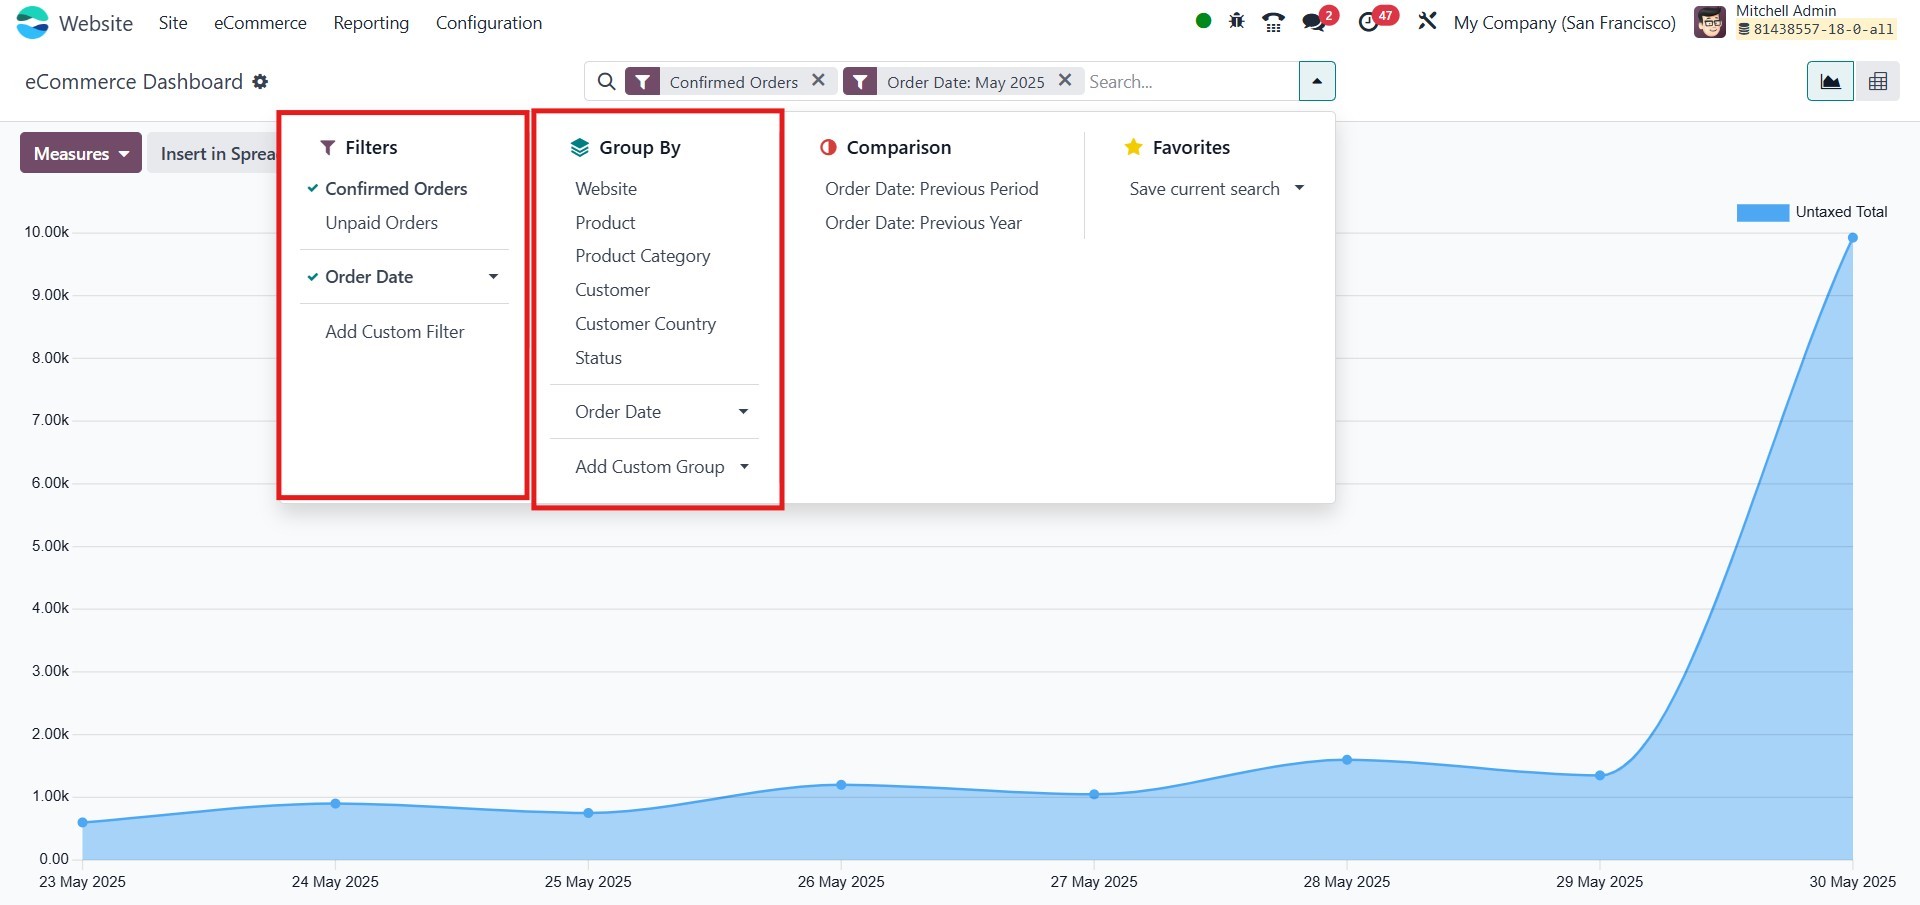
You may also create custom groupings to align the data structure with
your reporting needs.
8.3 Favorites
Under the Favorites tab, you have the option to:
- Save current search criteria
- Insert data directly into a spreadsheet.
These tools enhance report management and allow you to quickly
retrieve frequently used views.
8.4 Pivot View
To access the Pivot View, click the Pivot icon located in the
upper-right corner of the analysis window.
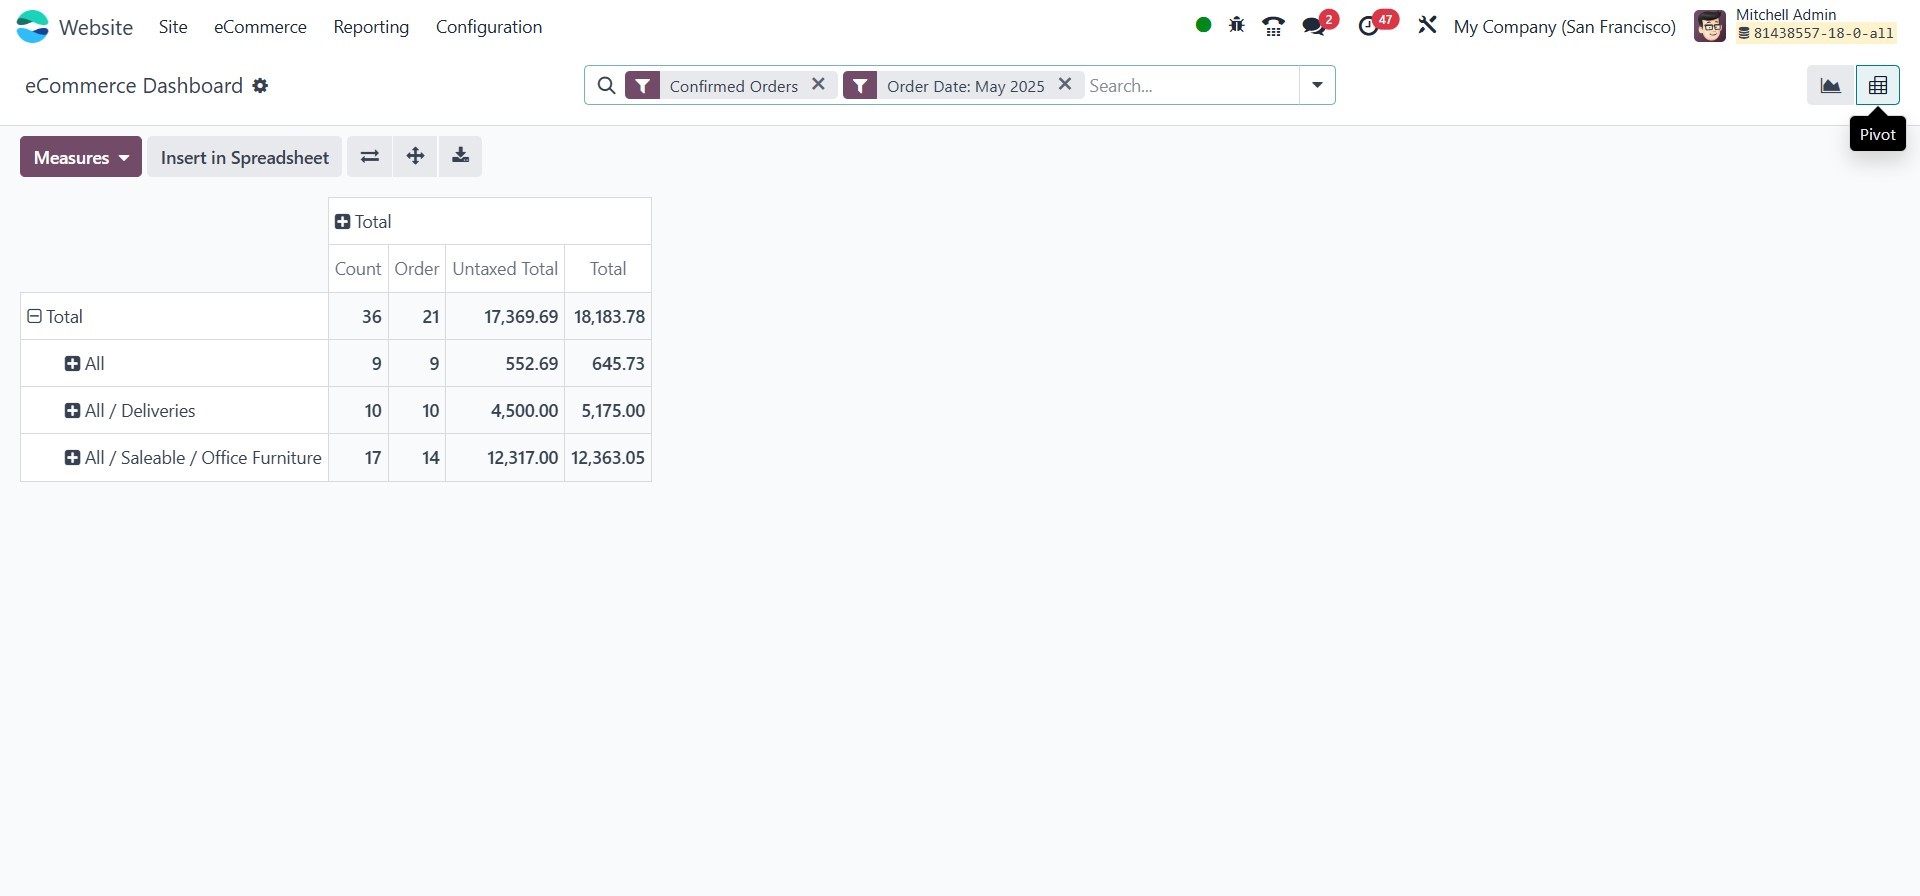
In this view, reports are presented in a tabular format, making it
easier to perform deep data analysis using multiple dimensions. You
can interact with the report using features such as:
- Filters
- Group By
- Favorites
- Search
Additional tools in the Pivot View include:
- Insert in Spreadsheet
- Flip Axis
- Expand All
- Download XLSX
These options enable you to customize and export your analysis,
providing flexibility for further processing and sharing.
With the powerful reporting capabilities available in the Odoo 18
eCommerce module, analyzing and managing your online sales has never
been easier. From real-time visual dashboards to detailed pivot
reports, you can make data-driven decisions with confidence.