4. Reporting
The reporting menu in the eLearning module facilitates the evaluation
of the eLearning process. The study consists of six separate
reports. Courses, contents, revenues, attendance, reviews, and
quizzes are among the several reports.
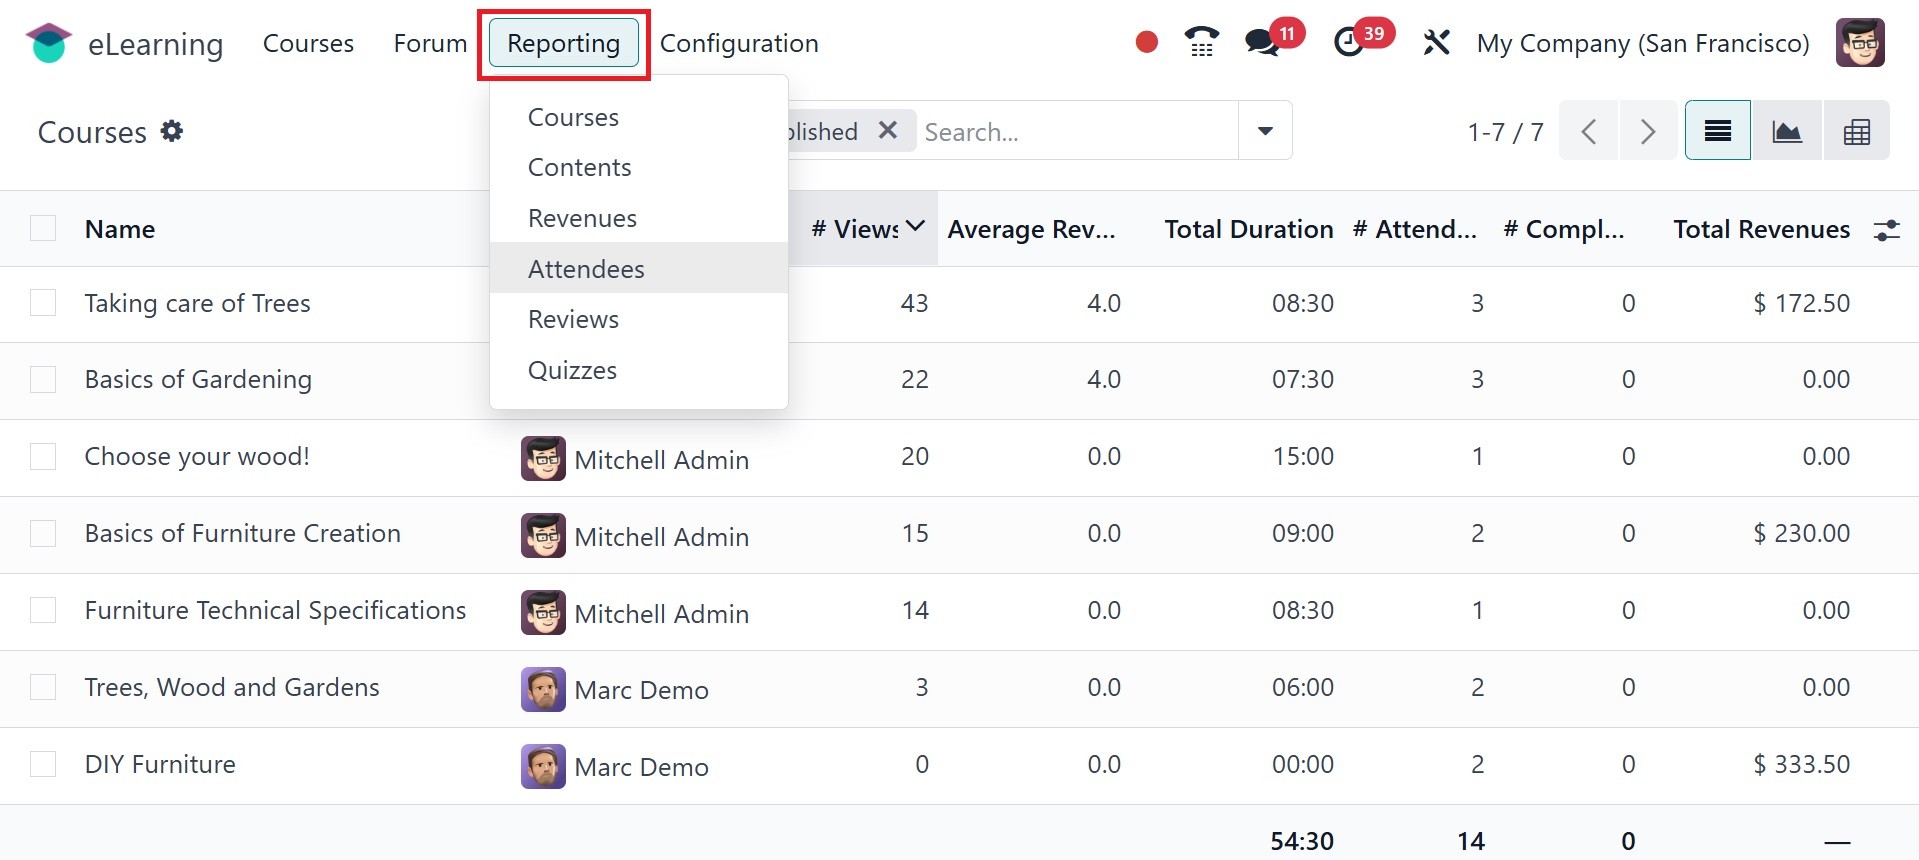
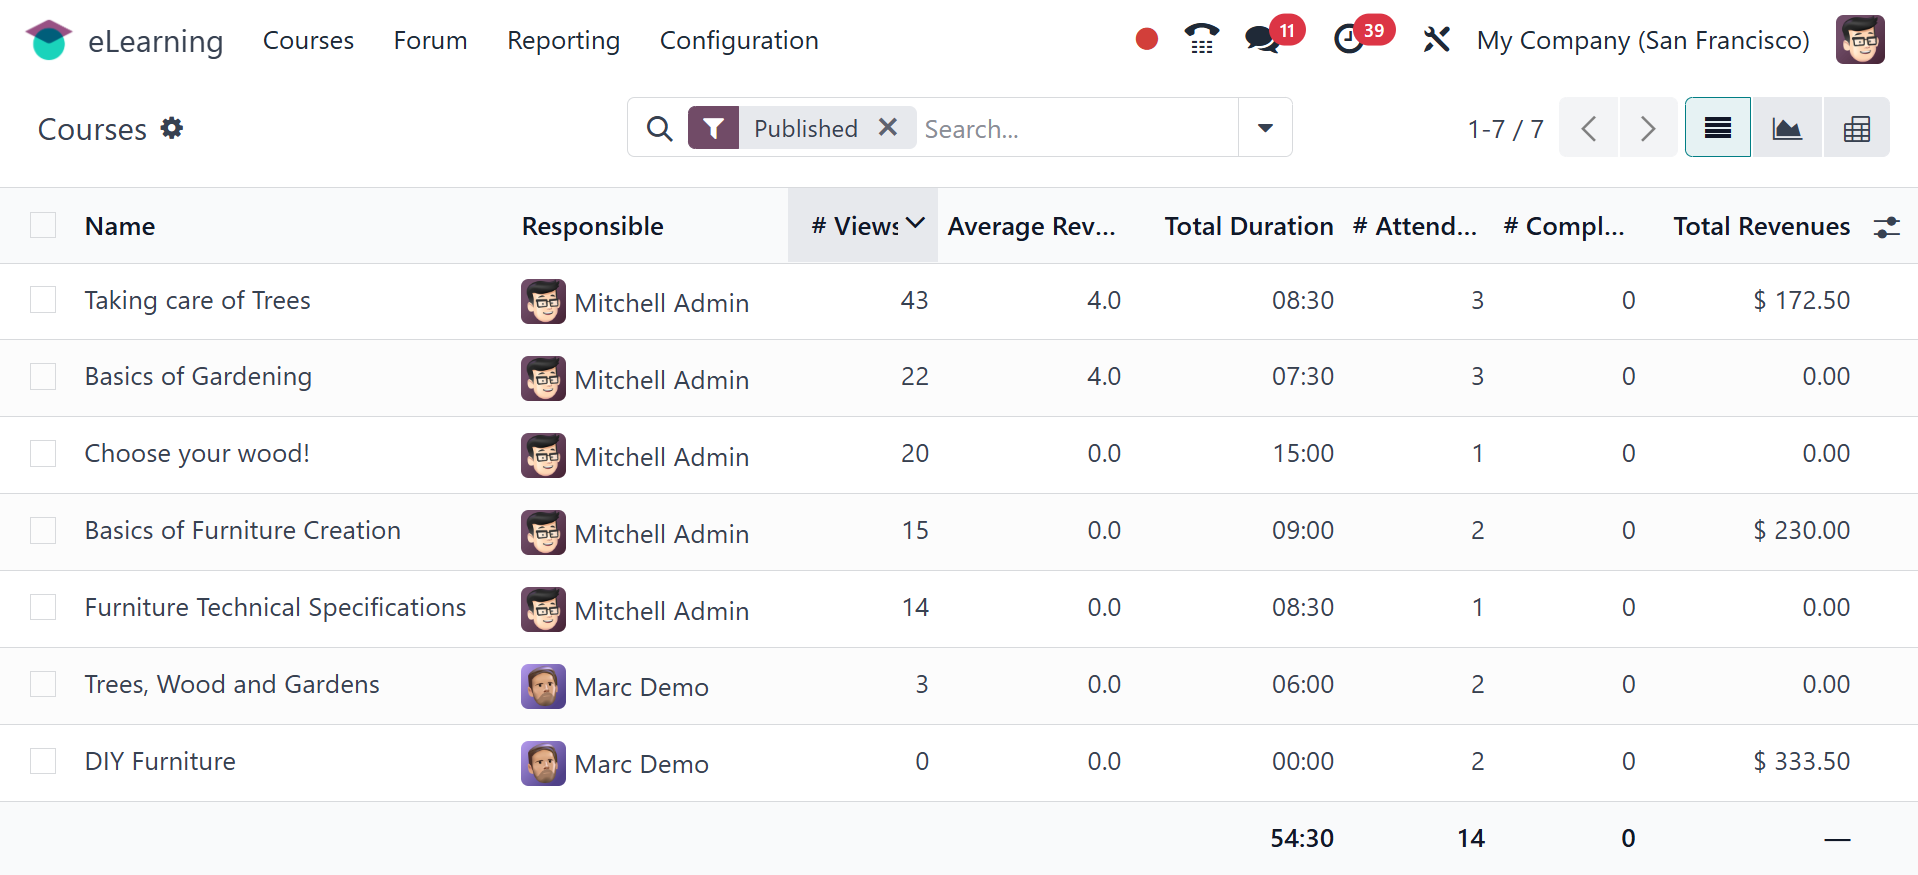
The course name, responsible person, total views, average views,
duration, number of attendees, total revenue, and other course
details are displayed under the Courses option.
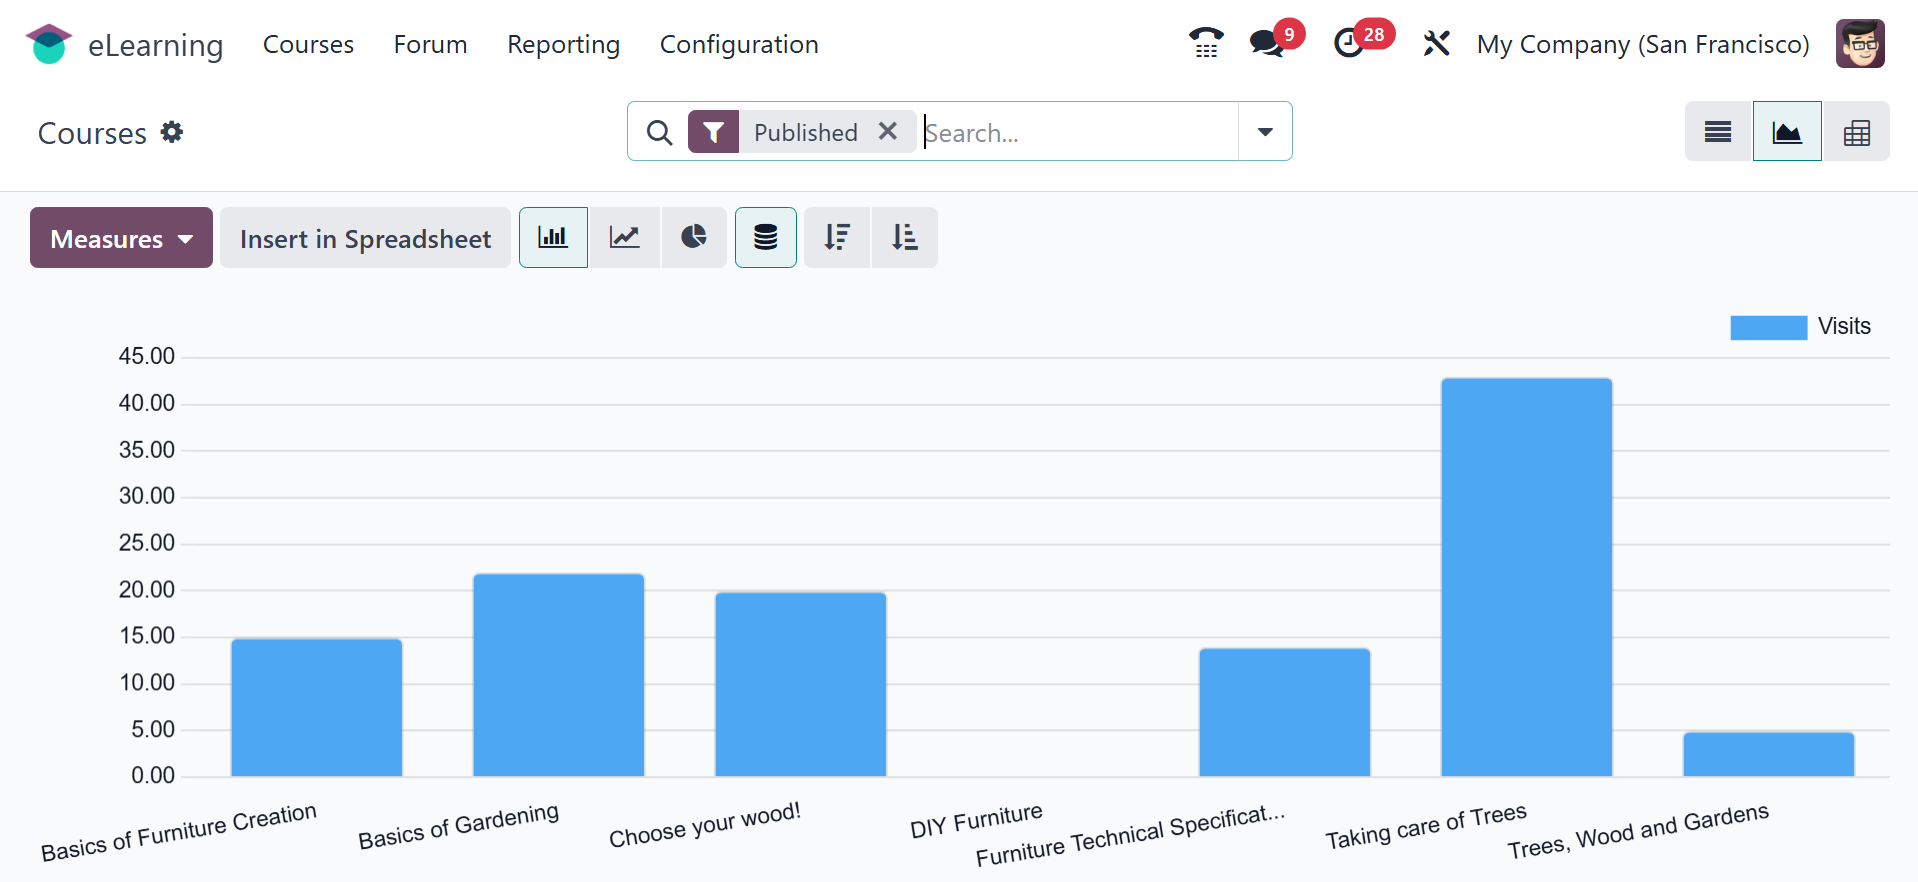
The graphical representation of the courses page will be as in the
screenshot below.
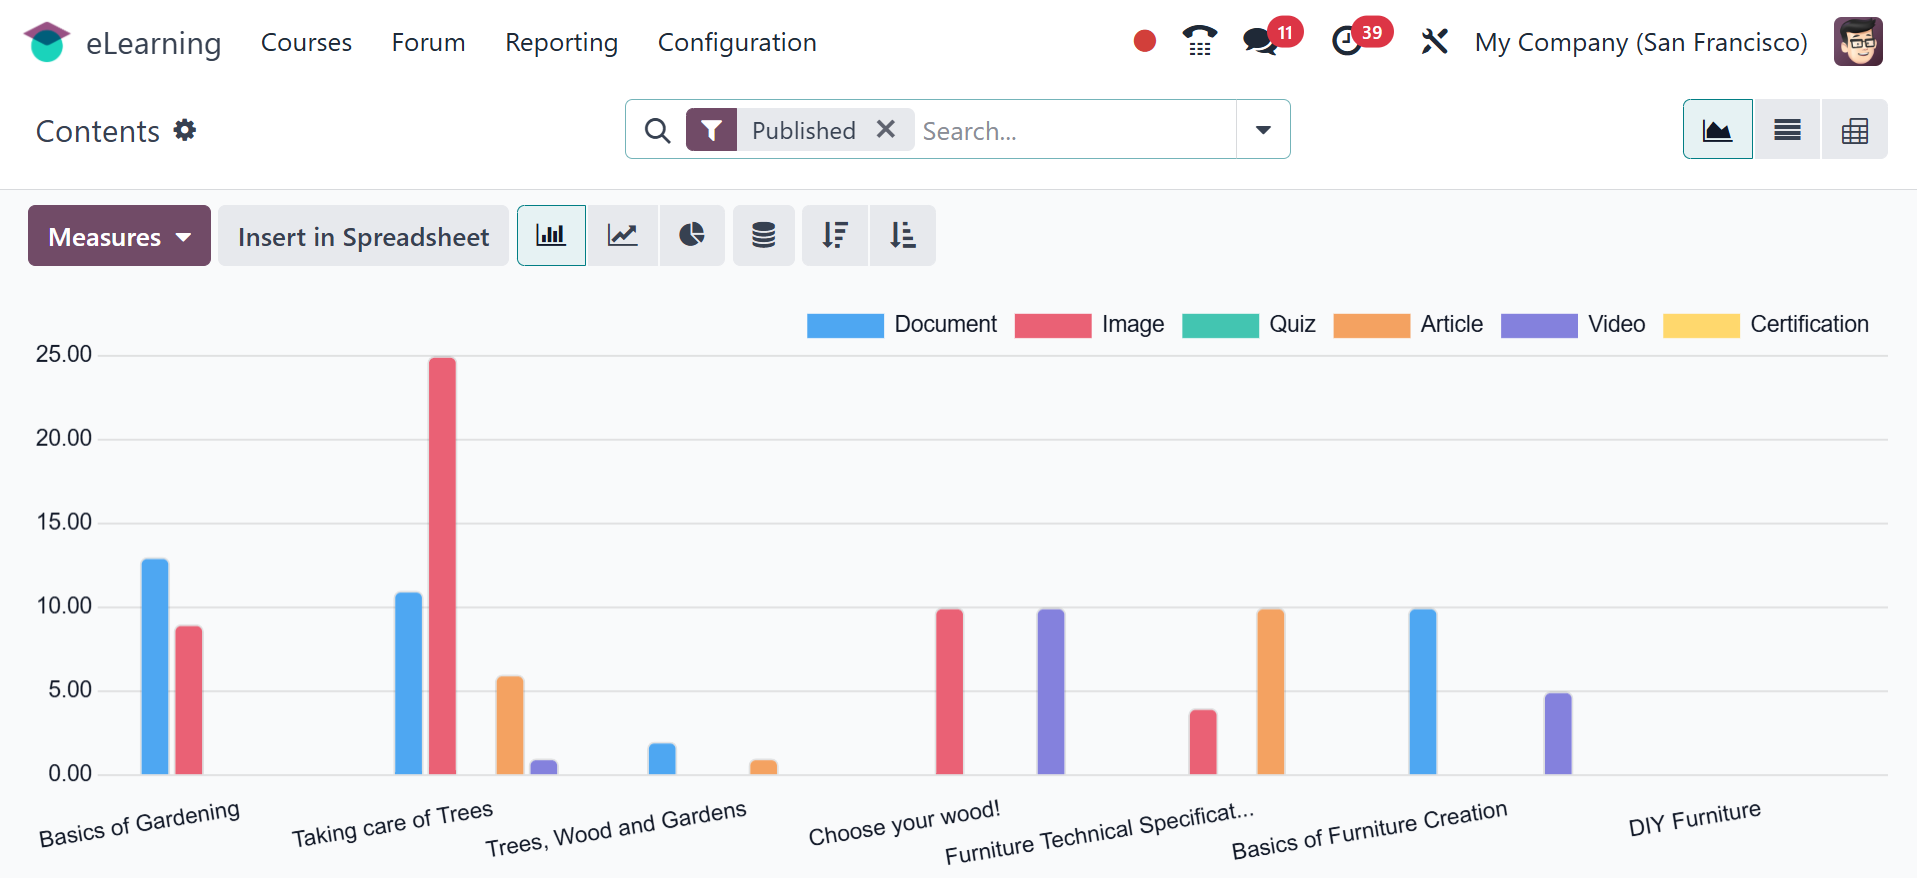
In the Contents report, which is a graphical representation of the
contents, you can access a variety of graph formats, including pie
charts, line charts, list view, pivot view, and graph view. The
metrics help you filter data according to user needs.
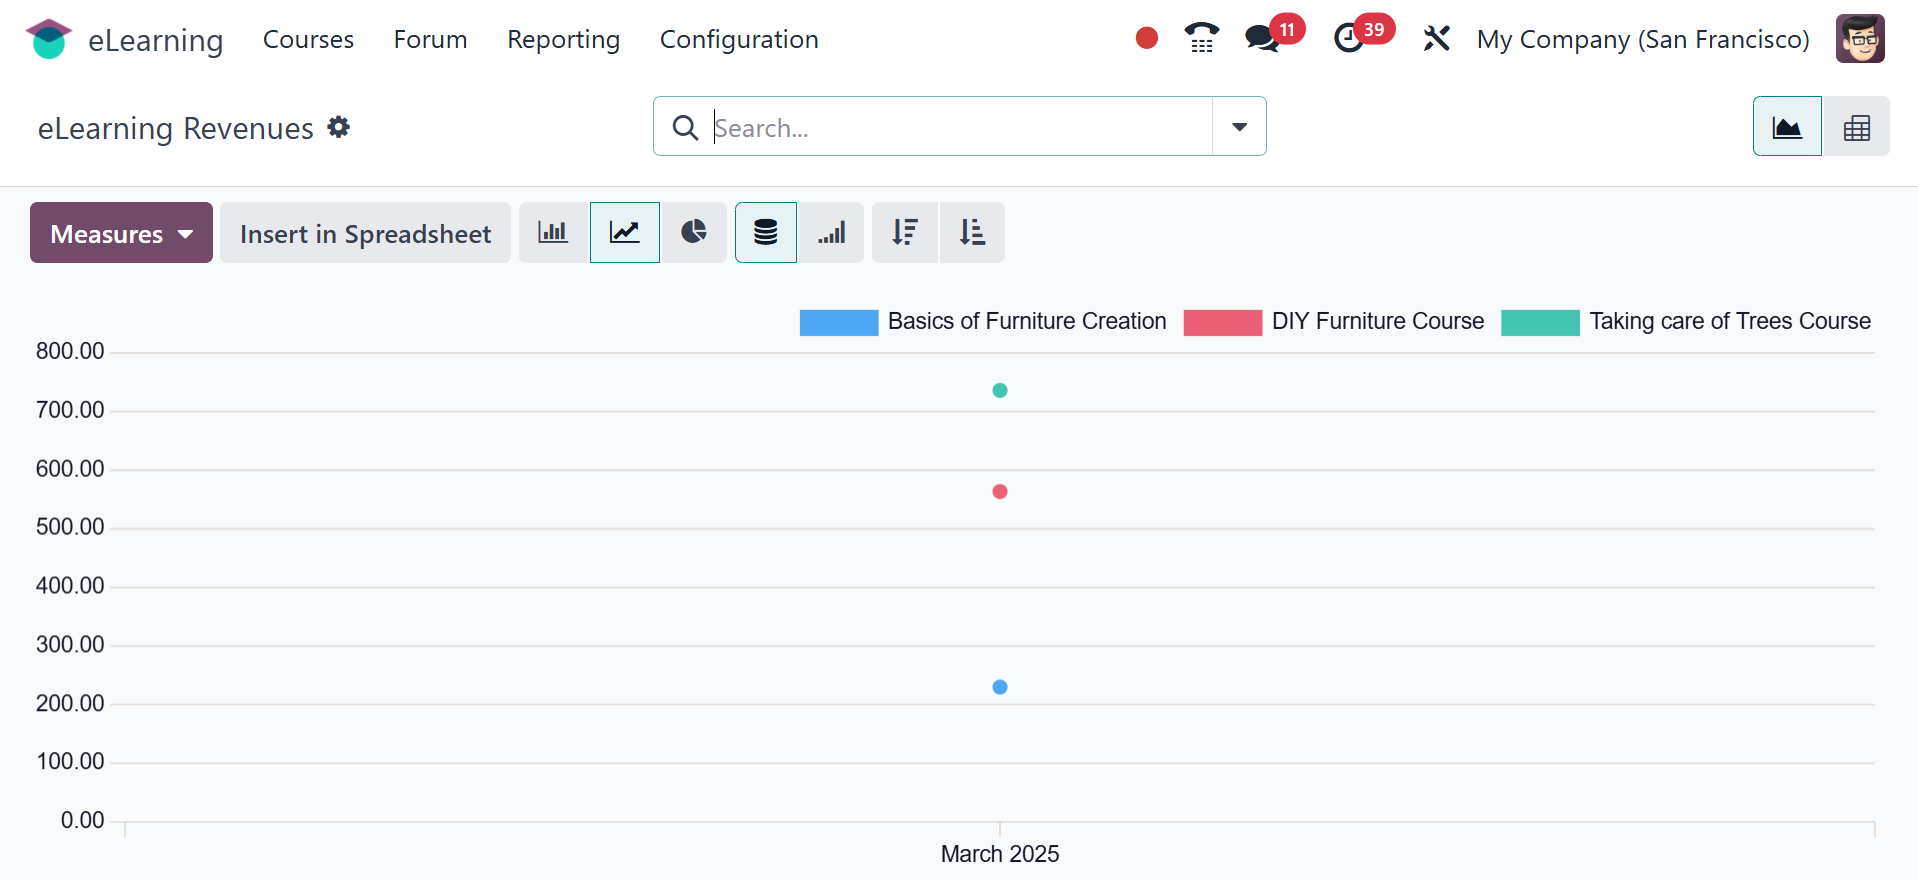
The eLearning Revenue reports contain the information for every
month. Filters, metrics, and multiple viewpoints are also available
for this report.
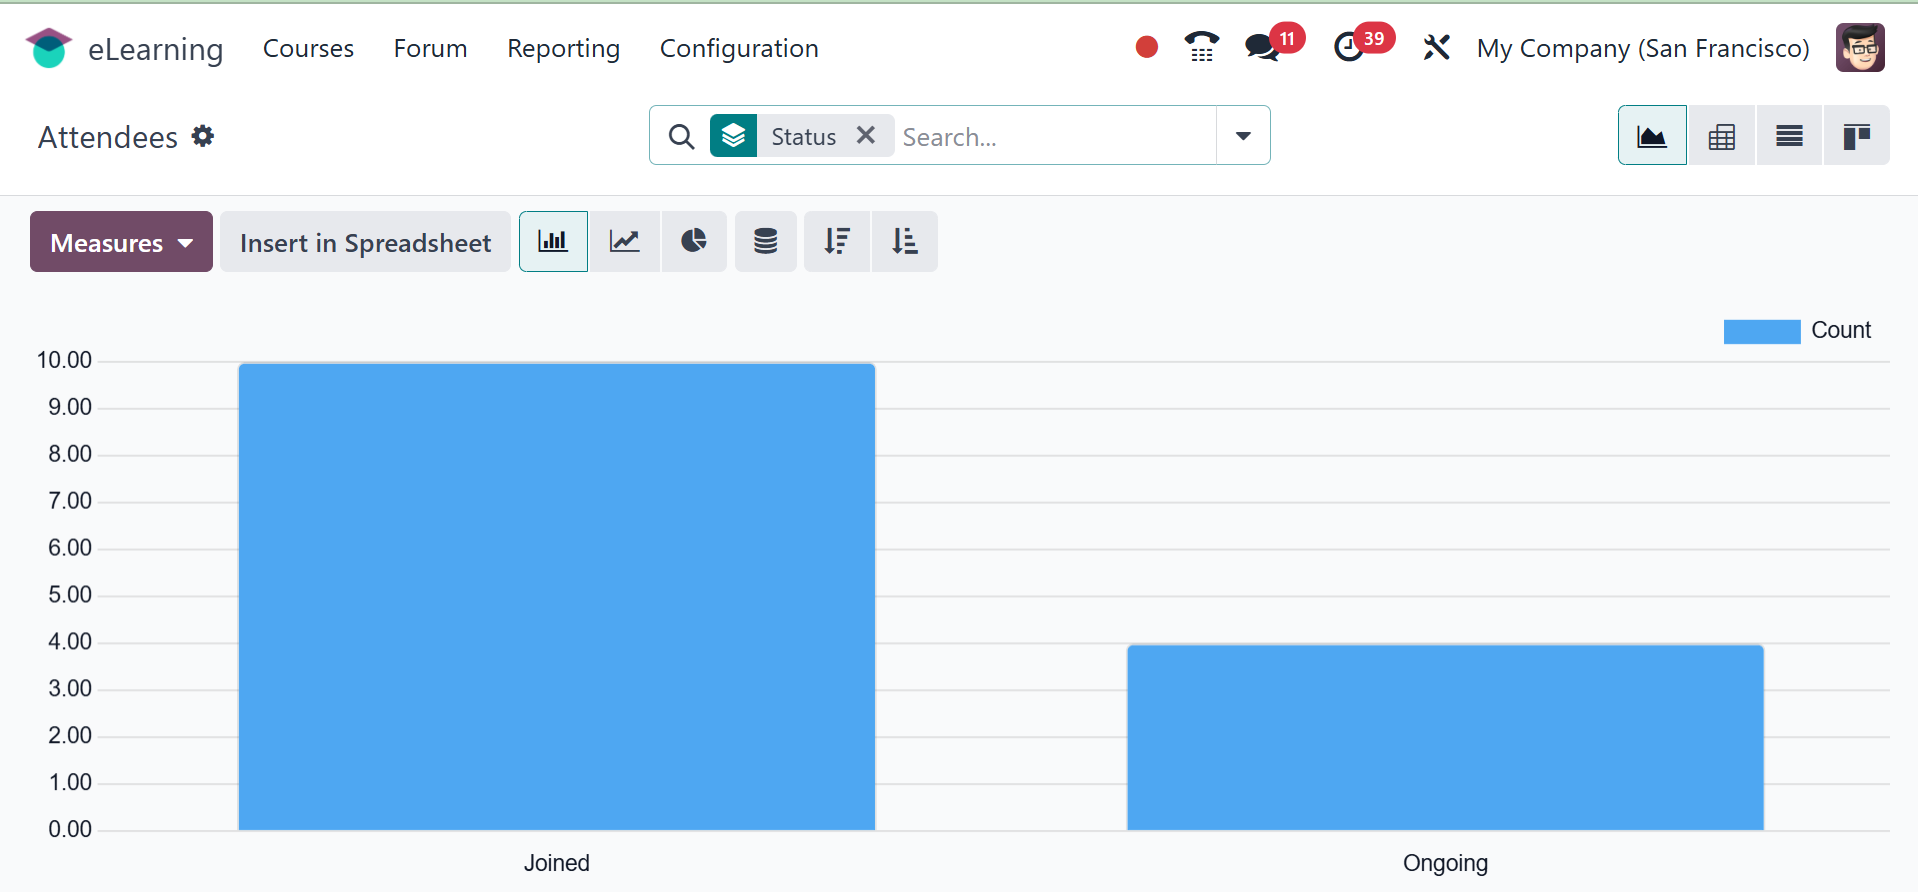
The status of the attendees can be evaluated using the Attendees
report. The names of the guests and their current information are
displayed in a graph format in the snapshot below.
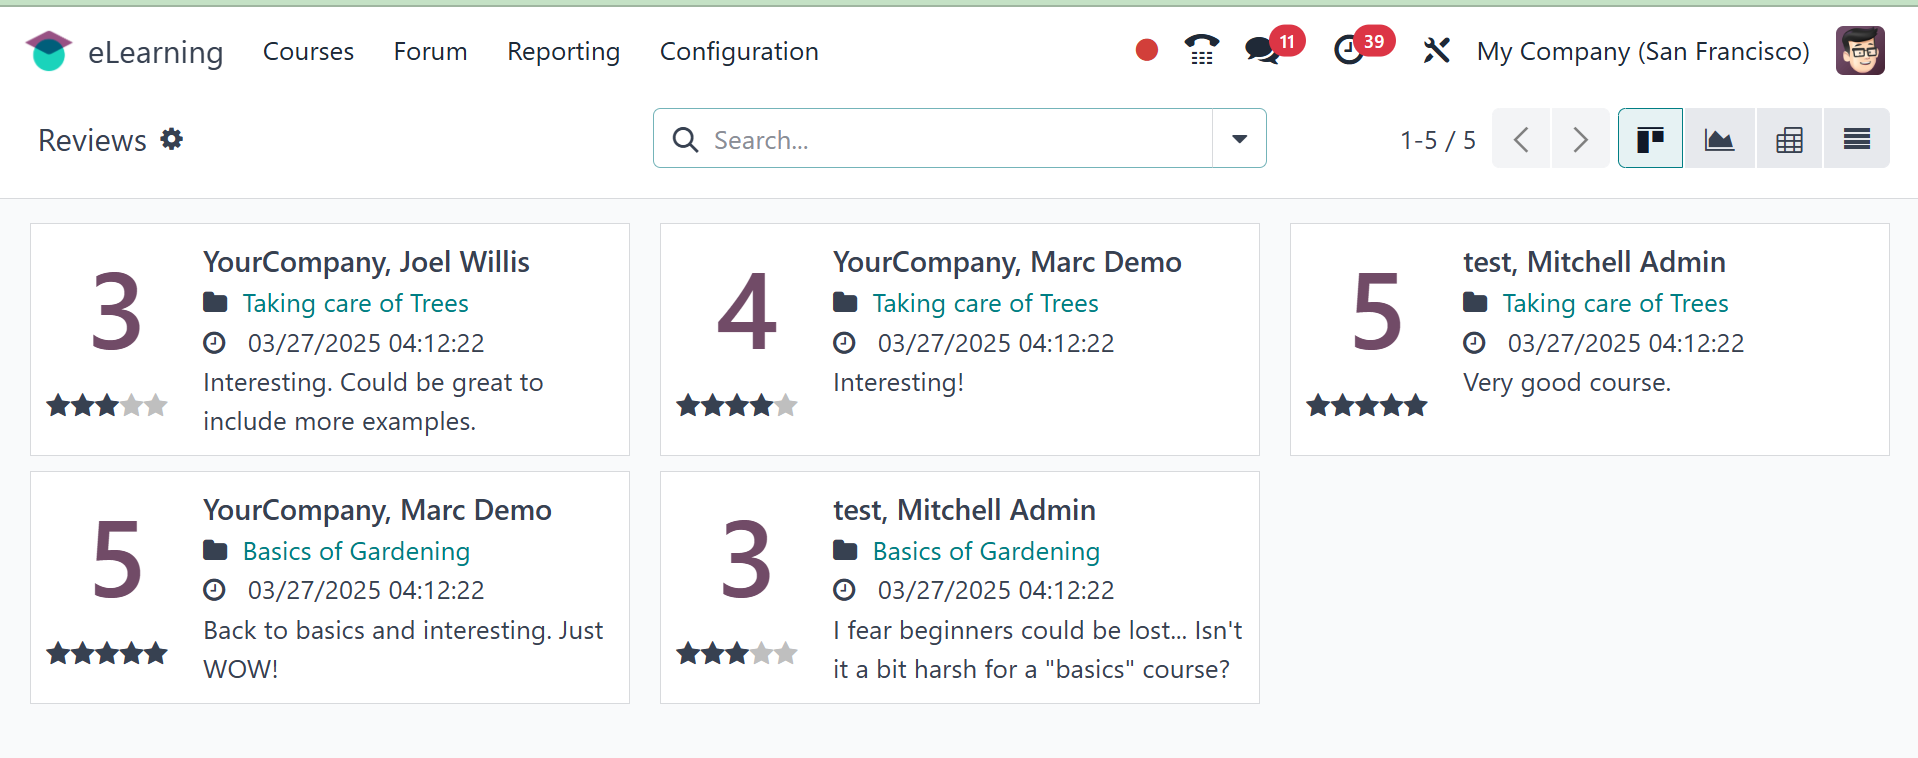
Users can add reviews to each course, and the Reviews report on the
back end can be used to review them. Review details, including the
name of the course, the submission date and time, the comment, the
rating, and so forth, are displayed in the Kanban view. To see
additional information, click on each one.
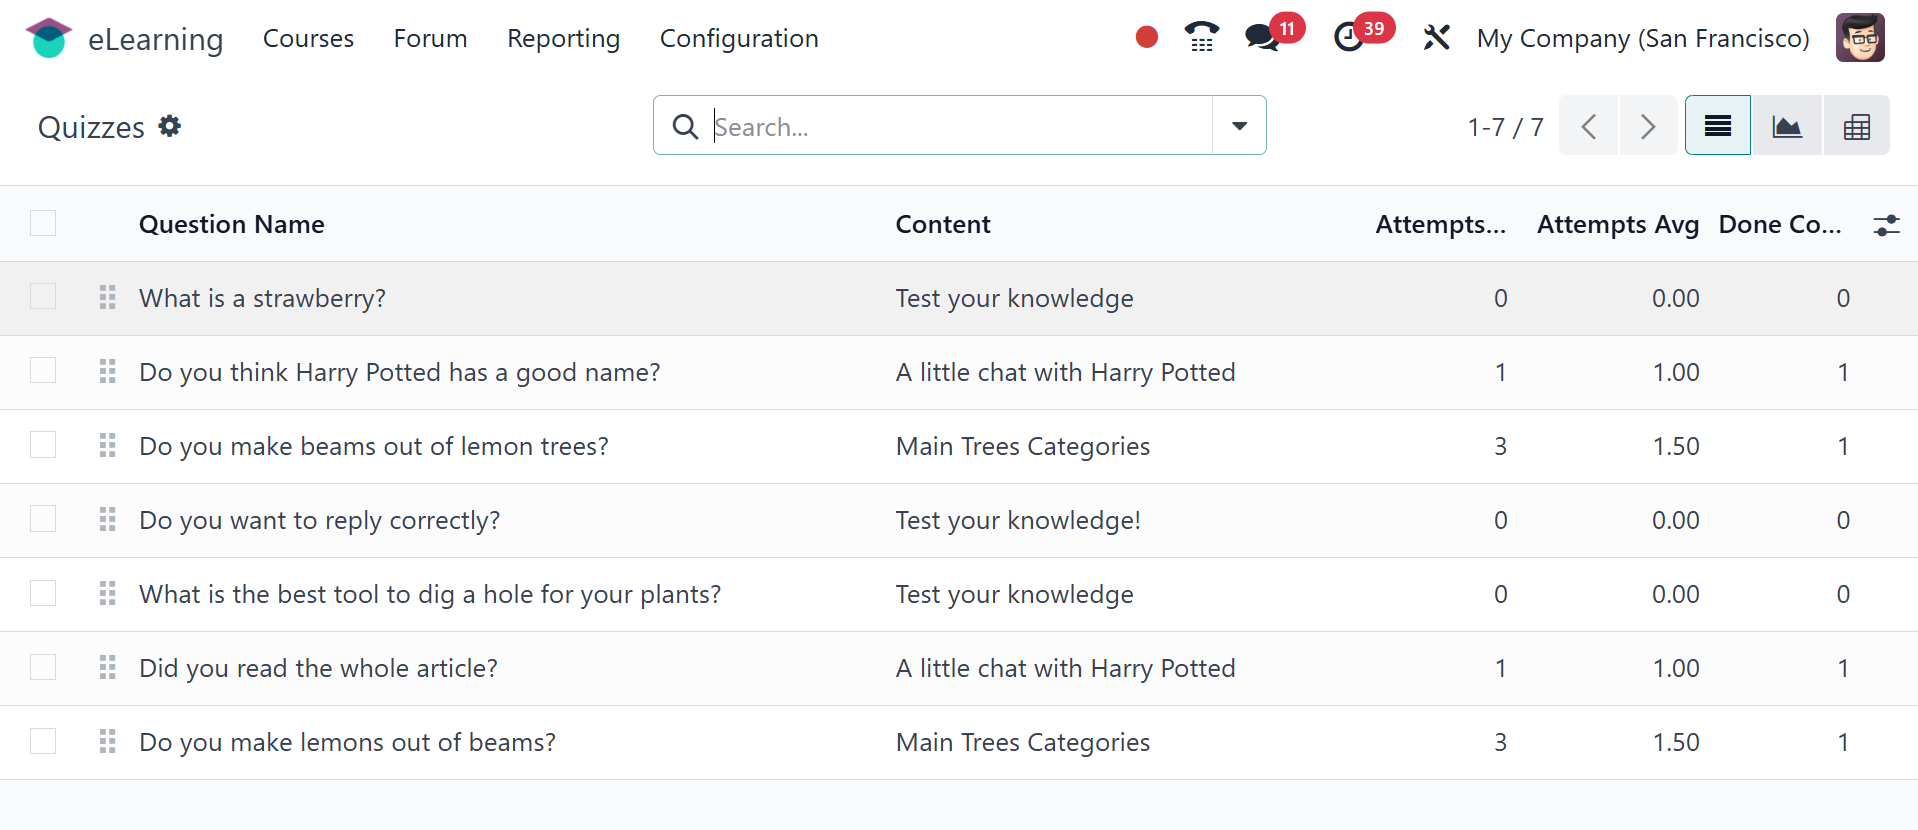
Quizzes are the last type of reporting. The questions in this
report's list view match the content's total number of attempts,
average number of attempts, number of completed attempts, etc.
The Odoo 18 eLearning module is perfect for overseeing eLearning
projects, to put it simply.