5. Reporting
In the Odoo18 Events module, you may create reports about the events
you host and
the attendees. By providing reporting options, Odoo 18 provides a
useful platform
for evaluating how well the company organizes events. You can
improve your working
methods and choose new strategies to boost output by looking over
the reports produced
by this site.
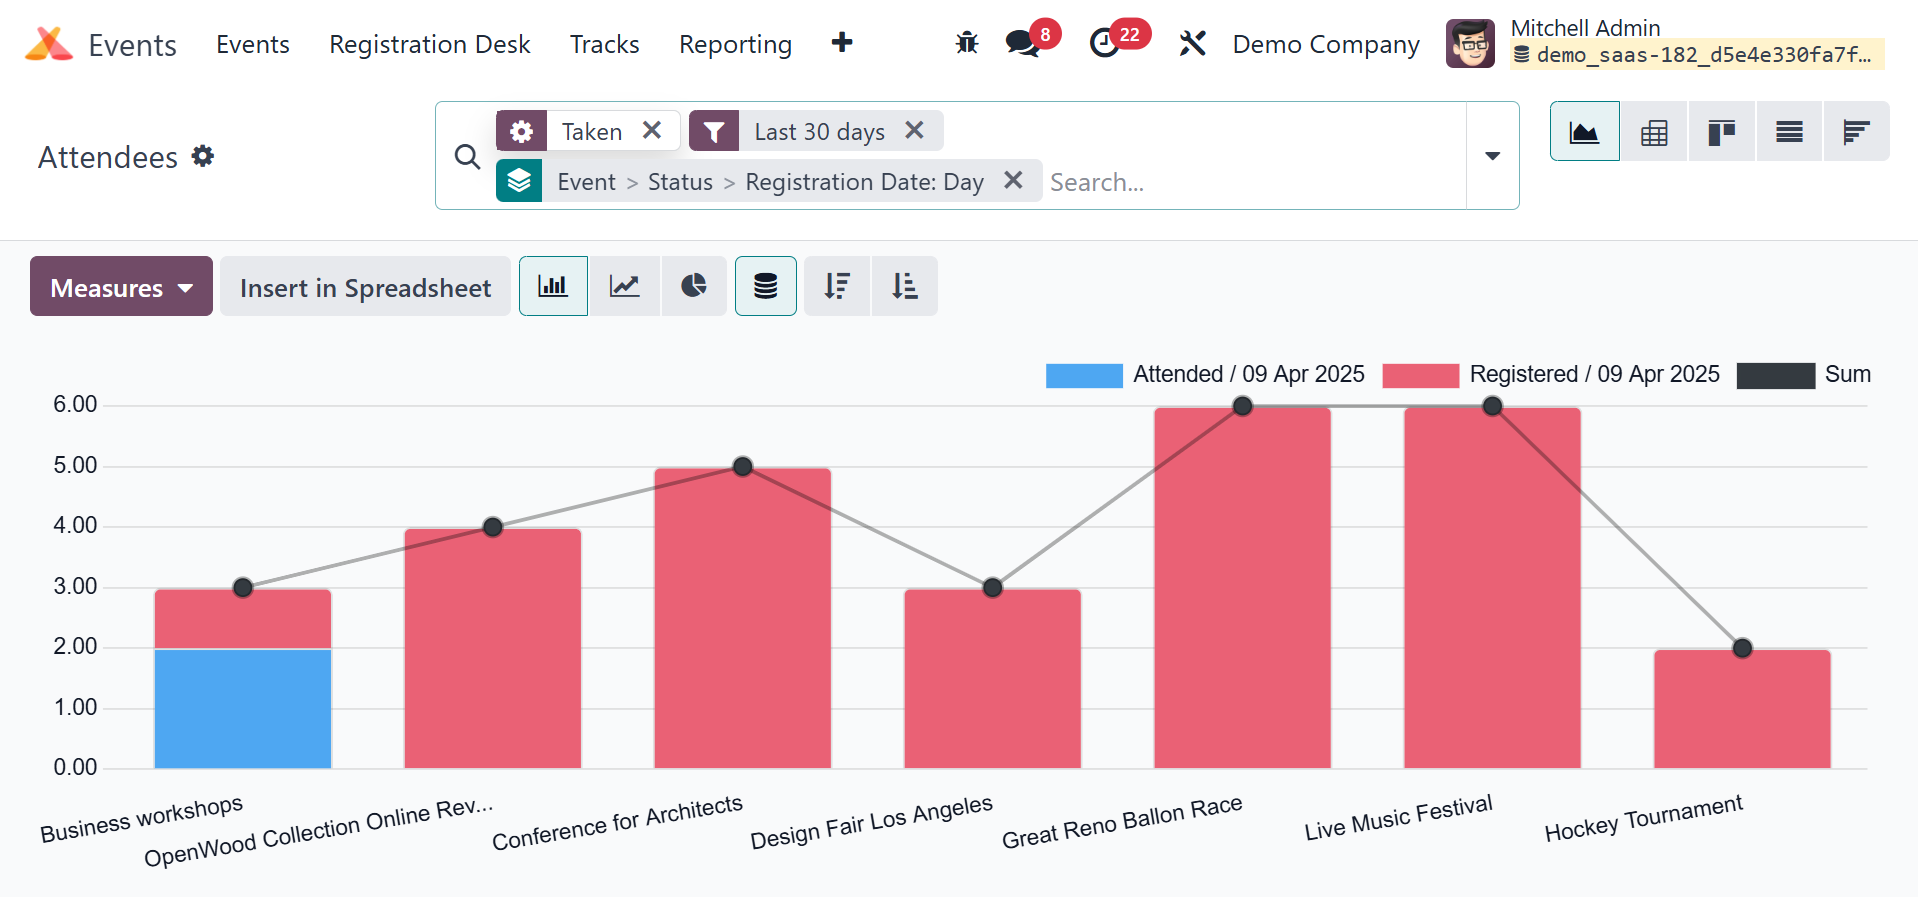
The Event Analysis pane displays the information both visually and
in pivot.
The graph view of the report appears as seen above. The Graphical
view includes
pie, bar, and line charts.
The Pivot view of the Attendees report will show the amount of
people who attended
each event. You can select the relevant measures for your report
from the Measures
tab.
You can also use the Filters and Group By options to expand the
report's data availability.
In graphic view, these parameters are also accessible. This platform
offers the
Kanban, List, Graphical, and Cohort views for viewing data.
The revenue page, will be, as in the screenshot below.
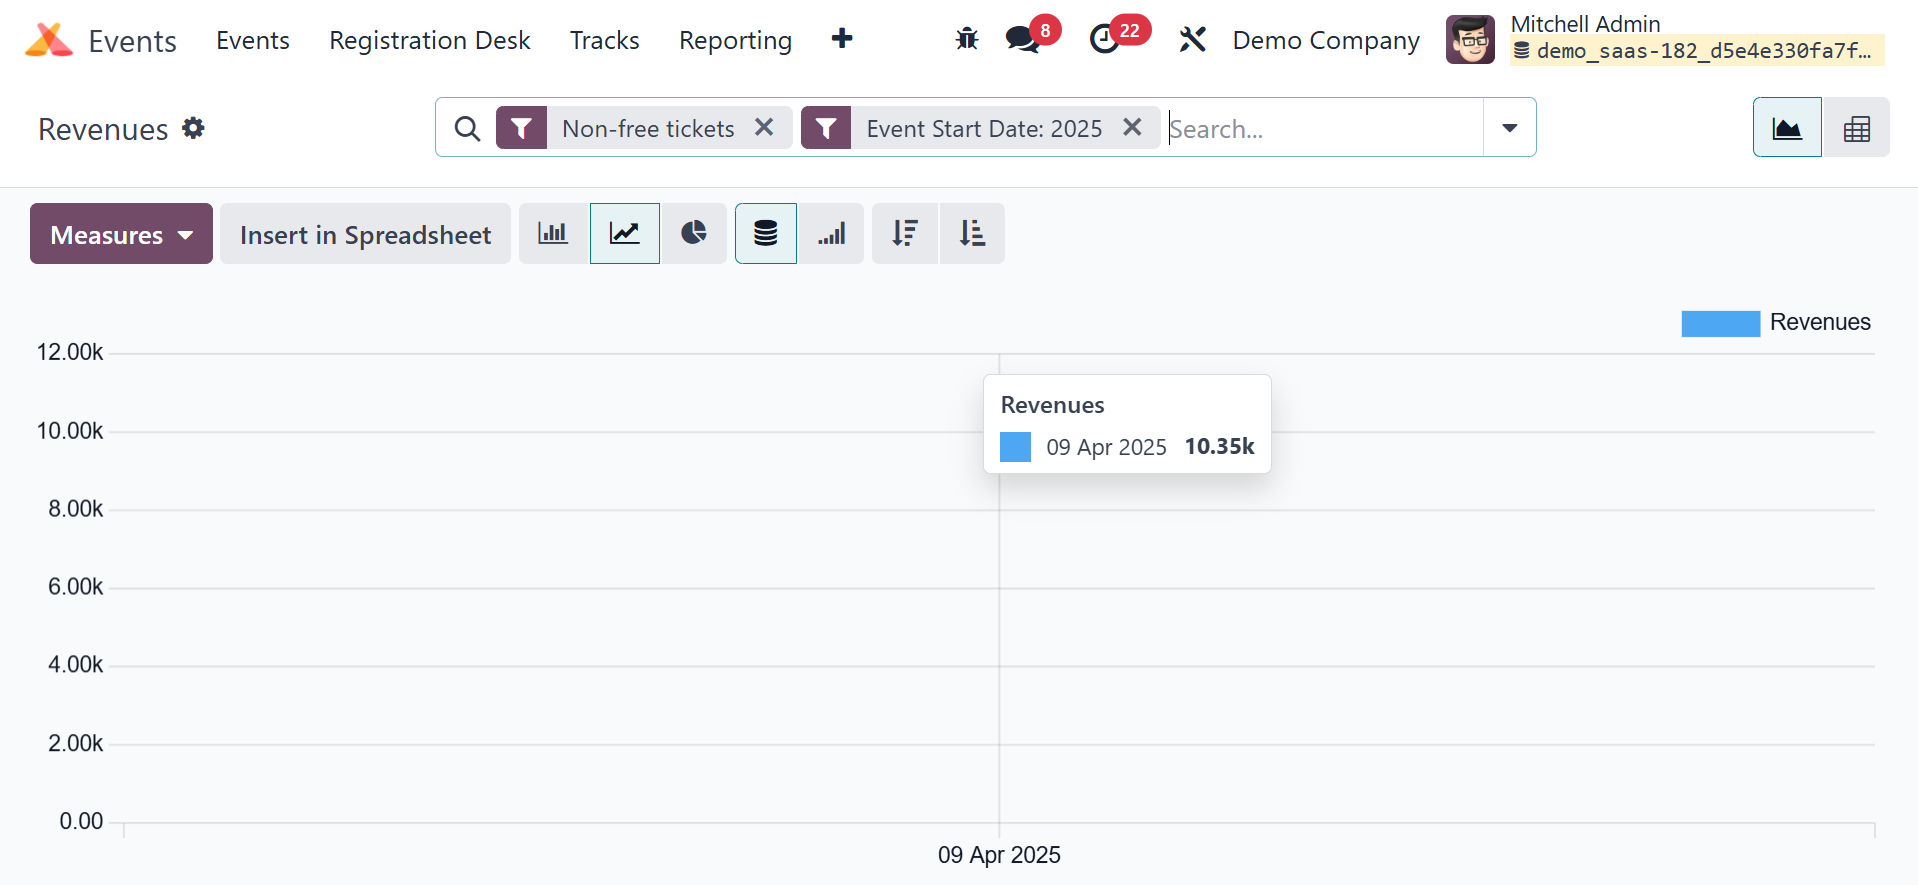
The revenue report can also be retrieved from the report. Pivot view
and Graph view
are also available. The Measures option allows you to choose the
appropriate measures
for your report.
The Odoo 18 Events administration module offers first-rate tools for
creating events
and managing them completely. You will be able to manage the stress
of event planning
with the help of this session. Odoo 18 provides a complete solution
for all event
management tasks, regardless of the event's size.