4. Reporting
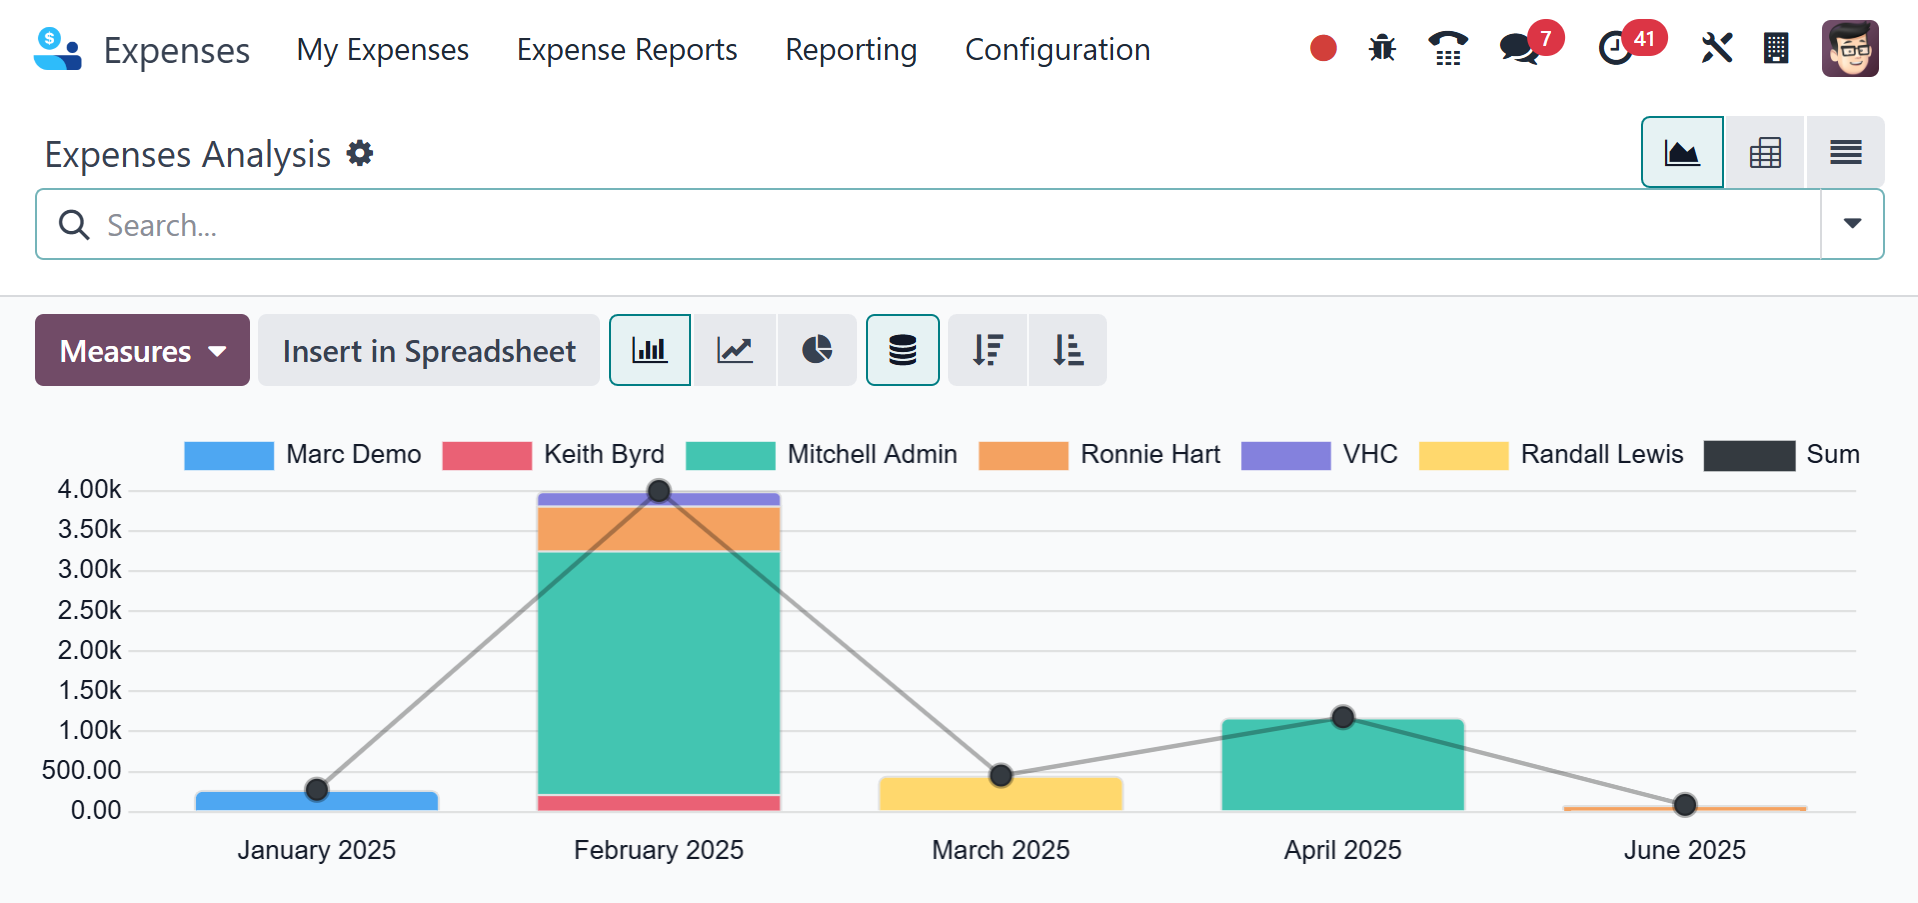
We can evaluate business expenses by utilizing Odoo 18 Expenses'
Reporting function. Selecting the Expenses Analysis menu in
Reporting brings up a graphical representation. The X-axis in the
graph view displays the date of the expense, while the Y-axis
displays the total number of expenses. Each employee's spending
total is displayed on the graph in a range of colors. You may also
change the values that are applied to the graph by choosing the
MEASURES icon.
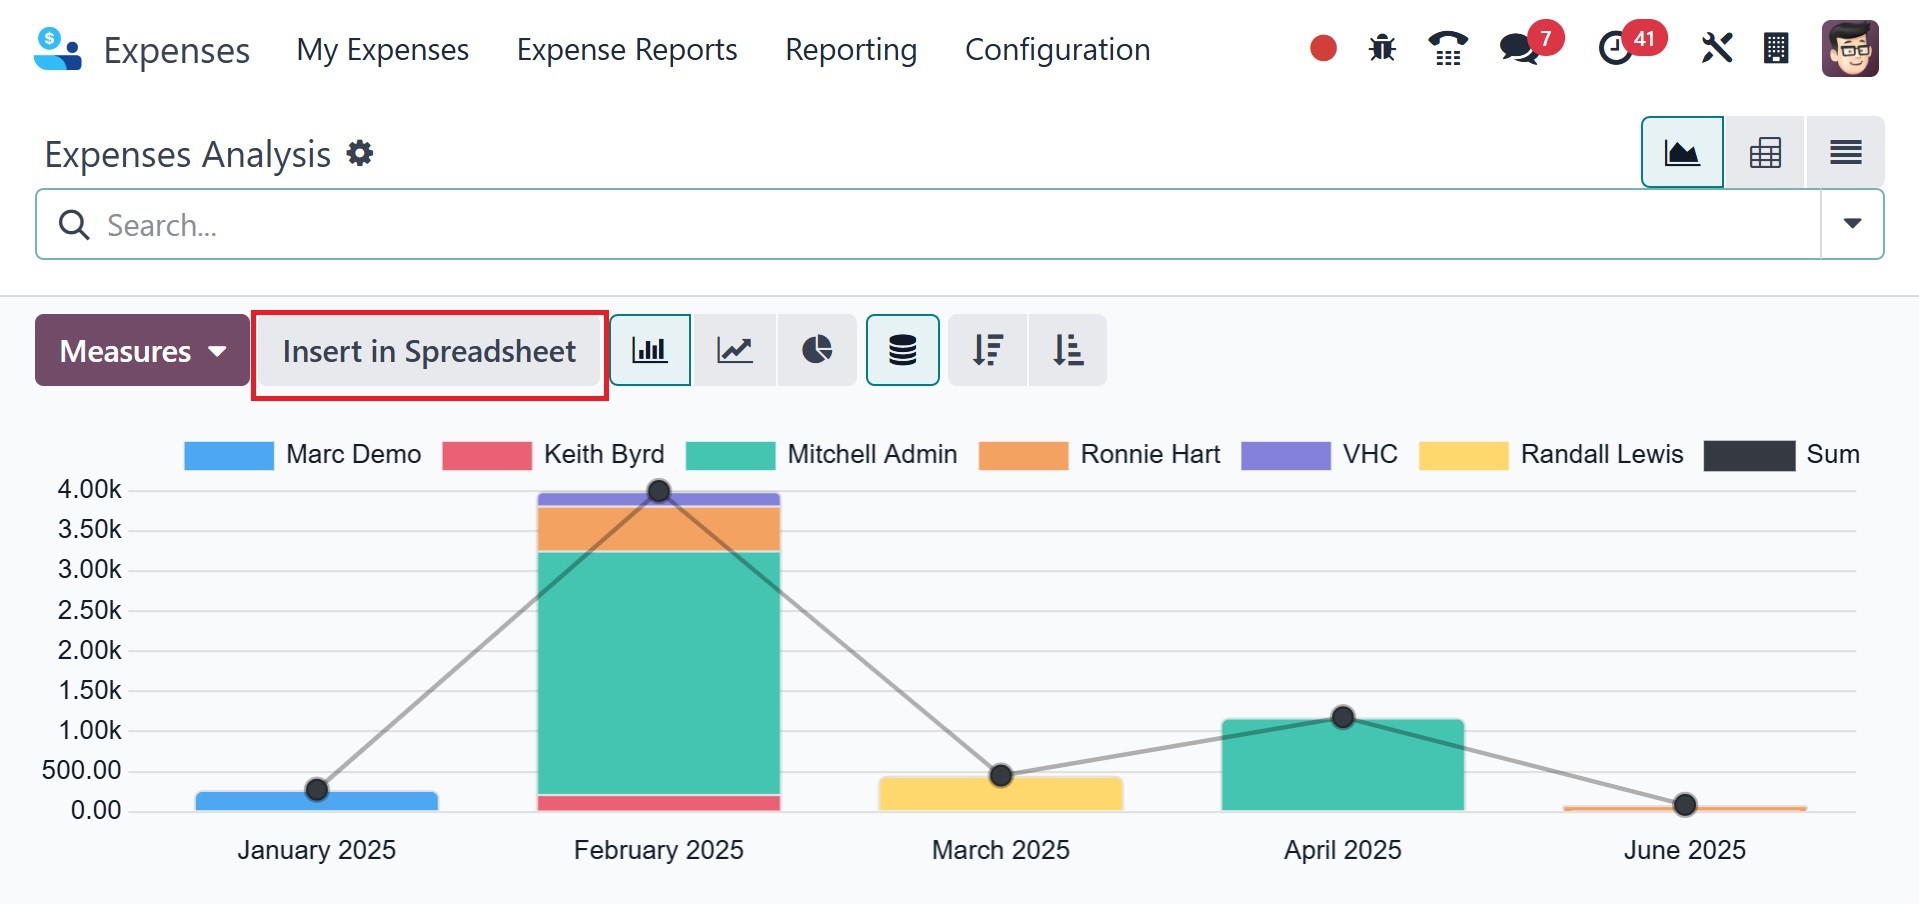
Among the metrics are Tax Amount, Total, Total Untaxed Amount in
Currency, Tax Amount in Currency, Count, and more. The graph is
displayed in line, pie, and bar chart formats. Click the INSERT IN
SPREADSHEET button if you need to upload a file.
Odoo 18's reporting feature gives us an overview of our company's
costs.