3. Reporting
The Fleet Management module, like all other Odoo modules, has a dedicated report
management tool that enables you to create reports in a variety of metrics. You
may see the Costs menu under the Reporting tab. You can access the Reporting window
after choosing this menu. The window's screenshot is shown below.
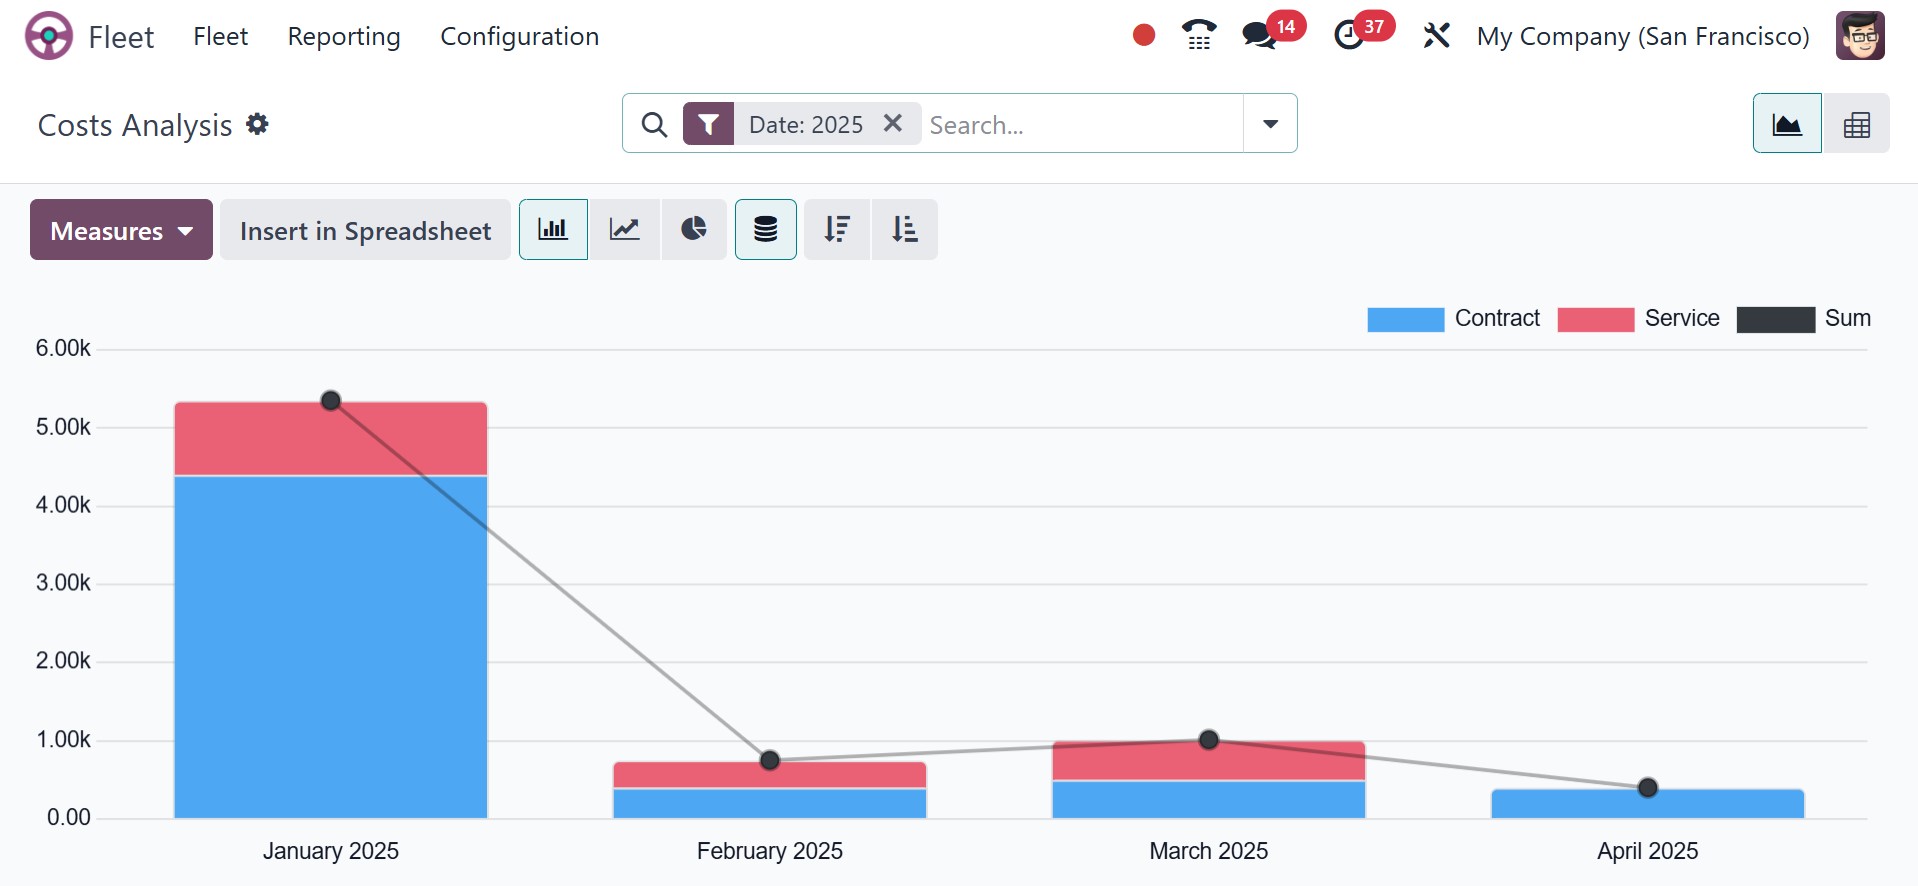
The Total Service Cost, Total Contract Cost, and Total Cost will all be entered
into the Cost Analysis window. By clicking on these reports, you can create a graph
report. In the graphical representation, the orange hue indicates the Services,
while the blue shade represents the Contract. Additionally, you have the option
to sort the data by both vehicle and driver. You can also create reports using bar
charts, line charts, and pie charts using this window. Both ascending and descending
order options are available for the graph displays.
You can examine your reports from various angles using the default and customisable
options found under the Filters tab.
You can use the window to compare the reports from this year to those from prior
years. The choices found under the Comparison tab can be used to accomplish this.
Additionally, the Pivot menu allows the reports to be seen in tabular form.
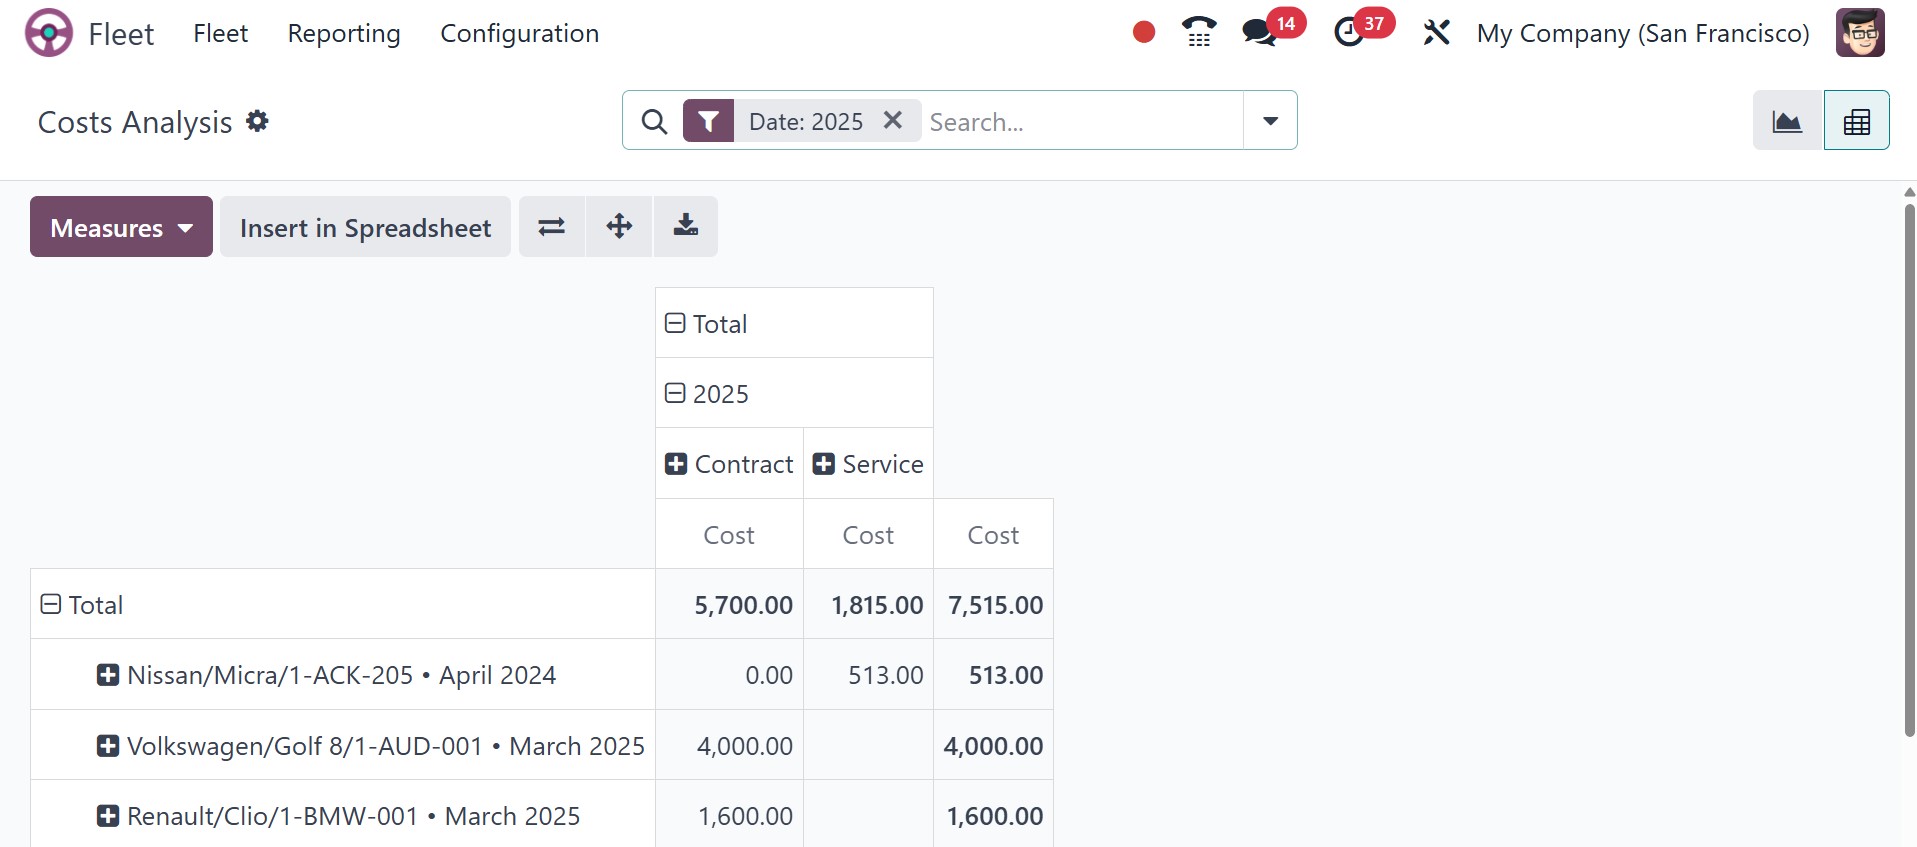
You can see additional options like INSERT IN SPREADSHEET, Flip axis, Expand All,
and Download XLSX in addition to all the options we covered in the graph view.
The Odoo Fleet Management Module is the all-in-one solution for managing your company's
commercial vehicles and increasing fleet productivity and income. The Odoo Fleet
Management System assists you in managing your fleet and managing all aspects of
vehicle management, including maintenance and repair tasks, as well as the responsible
driver.