4. Reporting
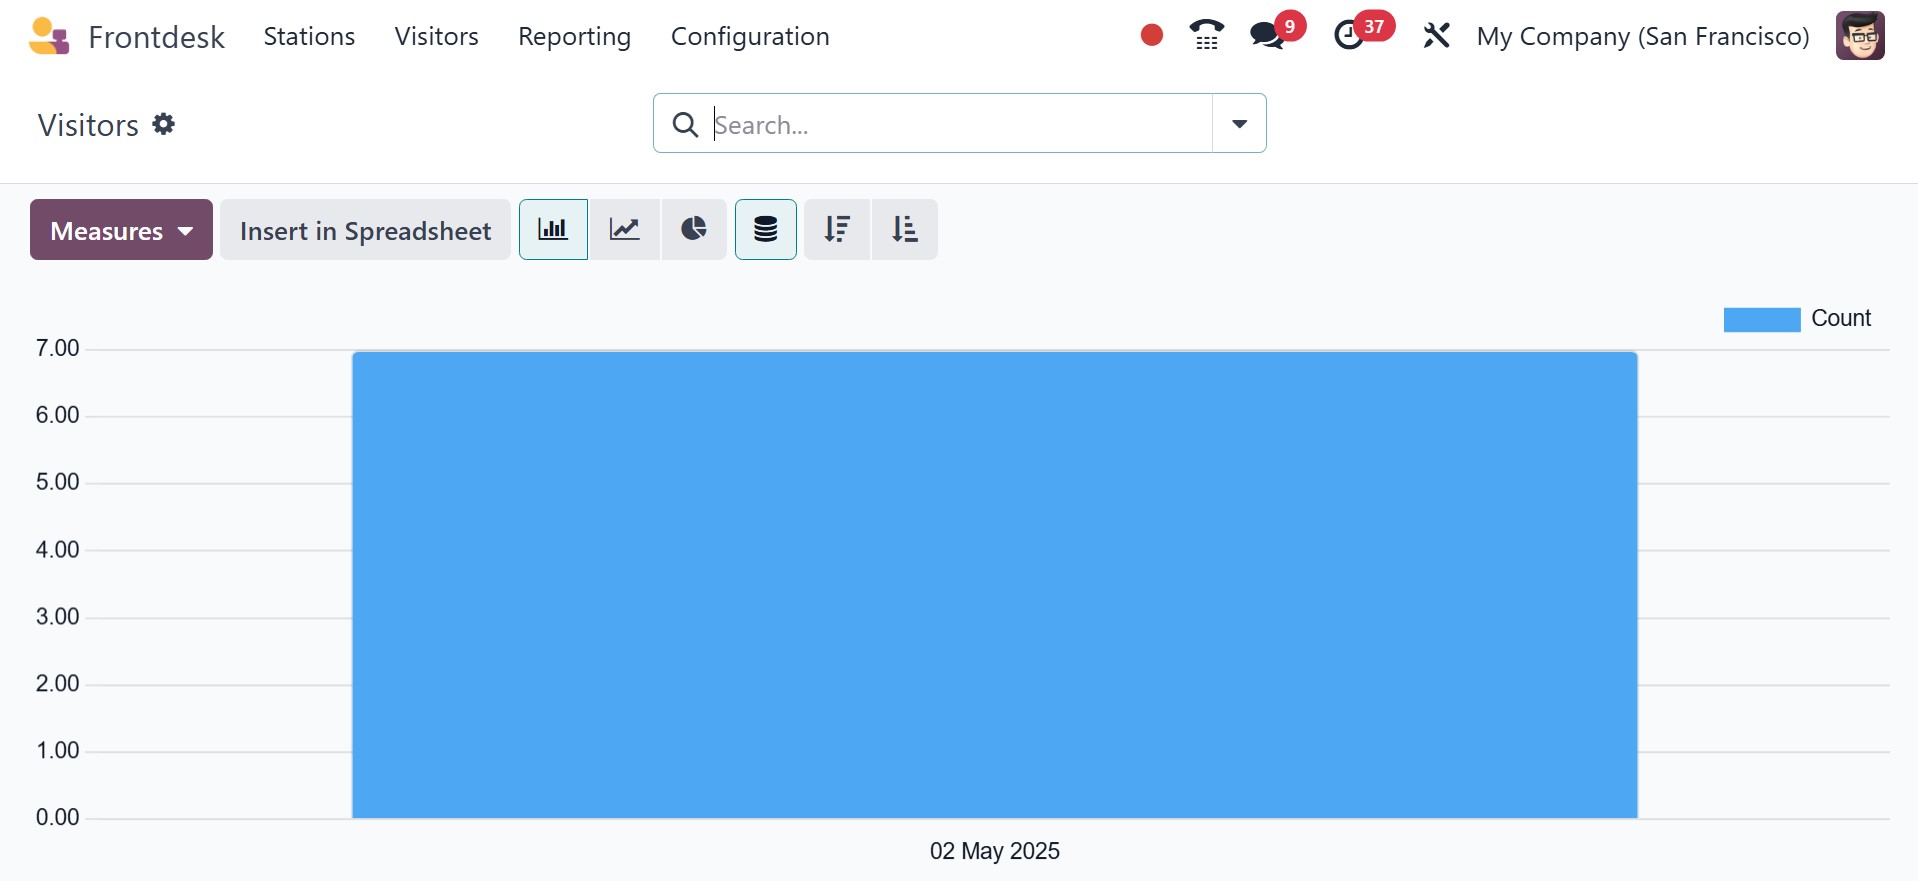
The first report is on visitors. Users can filter the data using the Measures option,
as seen by the monthly check-in visits. There are many different graph forms available
on this website. It's also now able to contribute data to the spreadsheet.
As a result, the report makes it easy to examine the beverages the business utilizes.
For such, users might use the Drinks report.
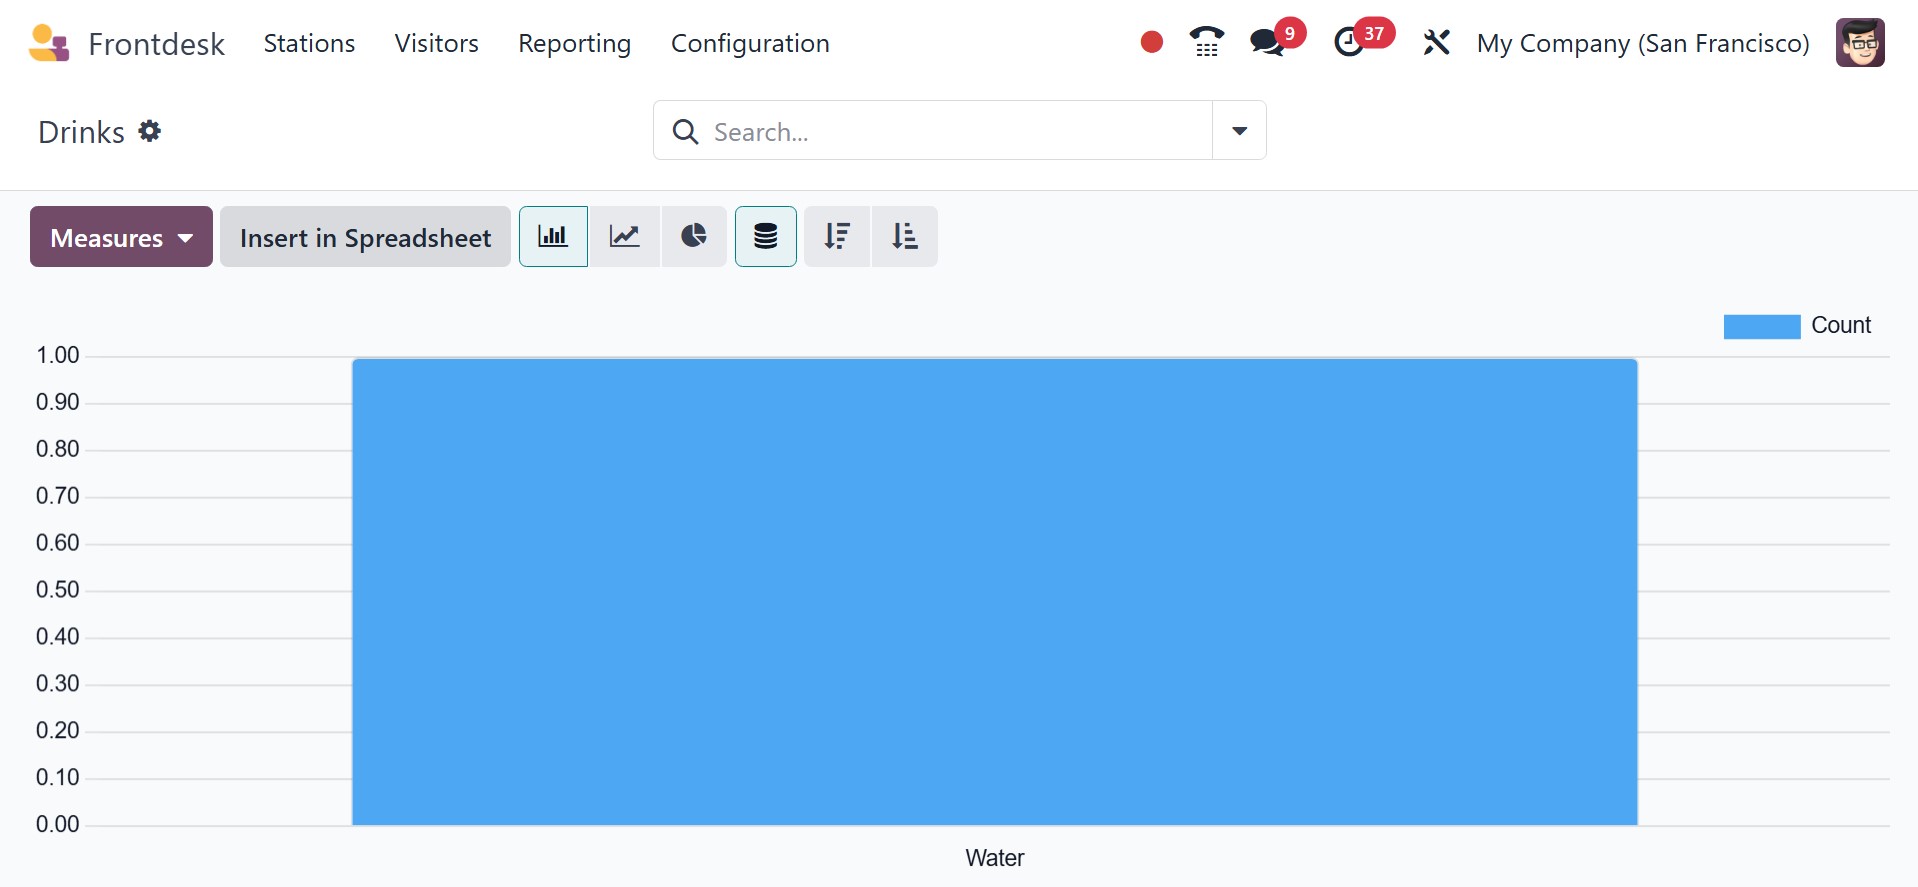
You have the ‘measures’ and ‘insert in spreadsheet’ options. And you can also make
use of the filters and group by options available here, as shown in the image below.
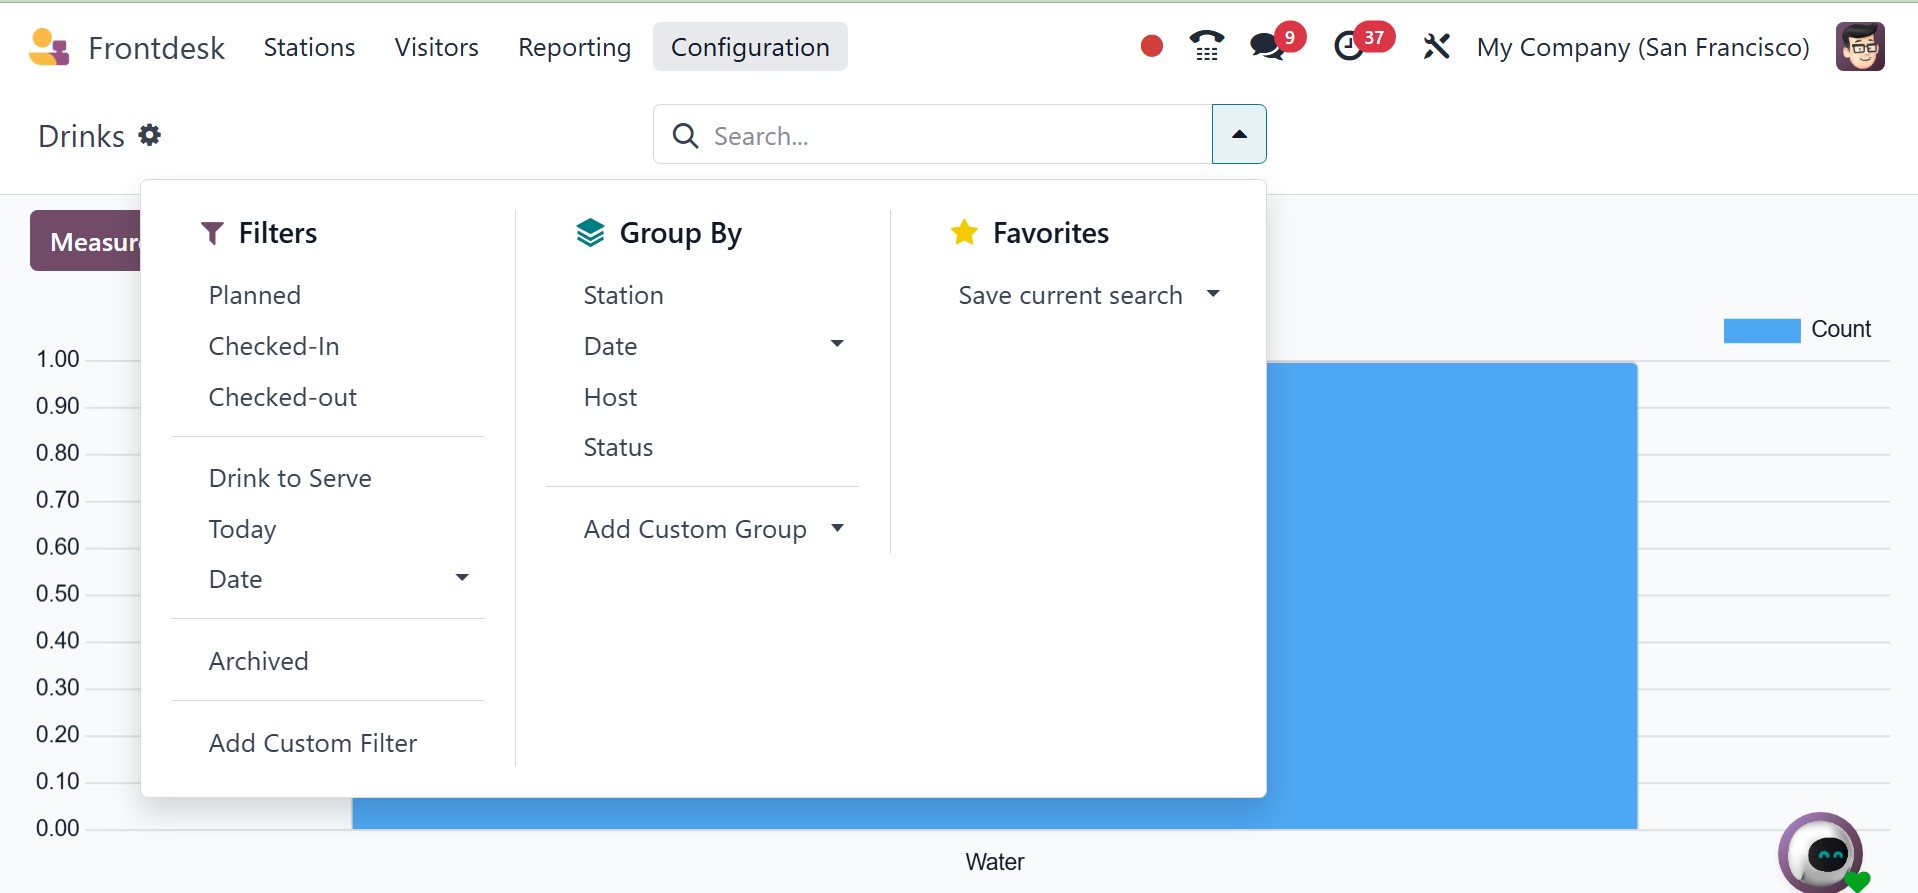
In the filters, you have the planned, checked in, checked out, drink to serve, today,
date, and add custom filter. Under the group by, you have the station, date, host,
status, and add a custom group. Finally, there is the favorites option with the
save current search as well.
These days, using the Front Desk module to manage guests can be quite beneficial
for any organization. Customers' opinions of the company are also enhanced by the
drinks menu, which is simple to control with this module.