6. Reporting
The Odoo 18 Manufacturing module
enhances production
management with robust
reporting capabilities,
providing detailed insights
into "Work Orders" and
"Overall Equipment
Effectiveness," enabling
informed decision-making and
process optimization,
enhancing productivity and
operational success.
7.1 Work Orders
Odoo 18's Manufacturing module's
Work Orders reporting offers
a comprehensive view of
production processes,
enabling businesses to
monitor and analyze
individual work orders'
performance. This data helps
identify areas for
improvement, optimize
resource allocation, and
align production schedules
with business goals,
enhancing productivity and
control.
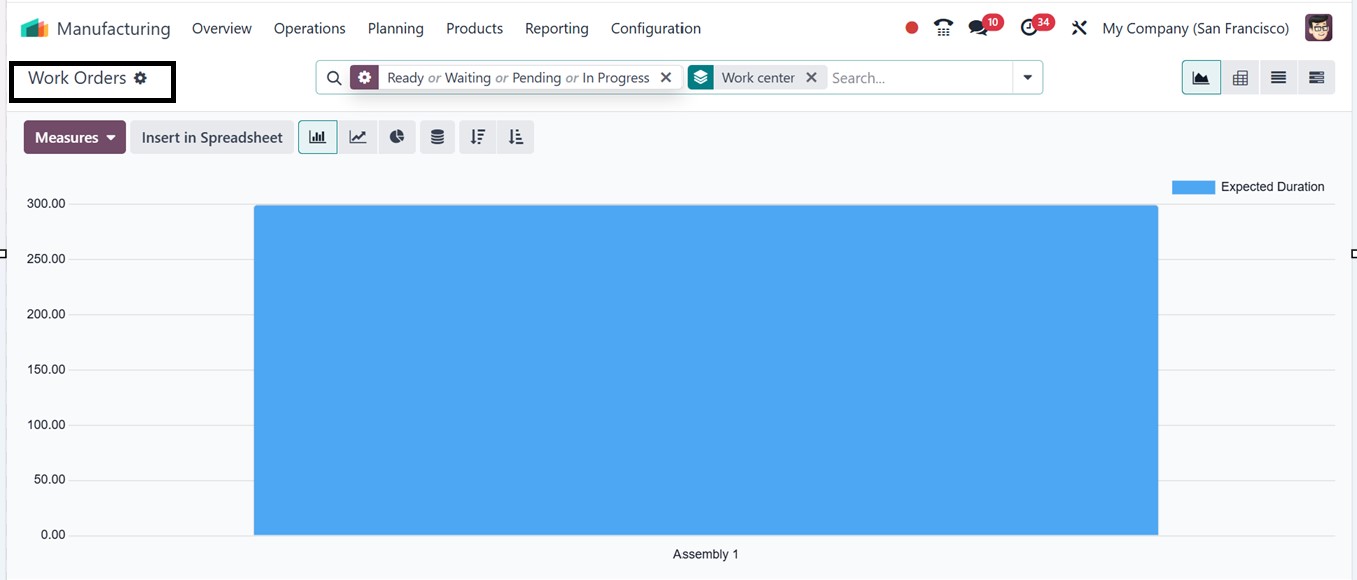
The ‘Work Orders’ reporting
section will provide the
analysis of all the work
orders which are ready,
waiting, pending, or in
progress as illustrated in
the screenshot below.
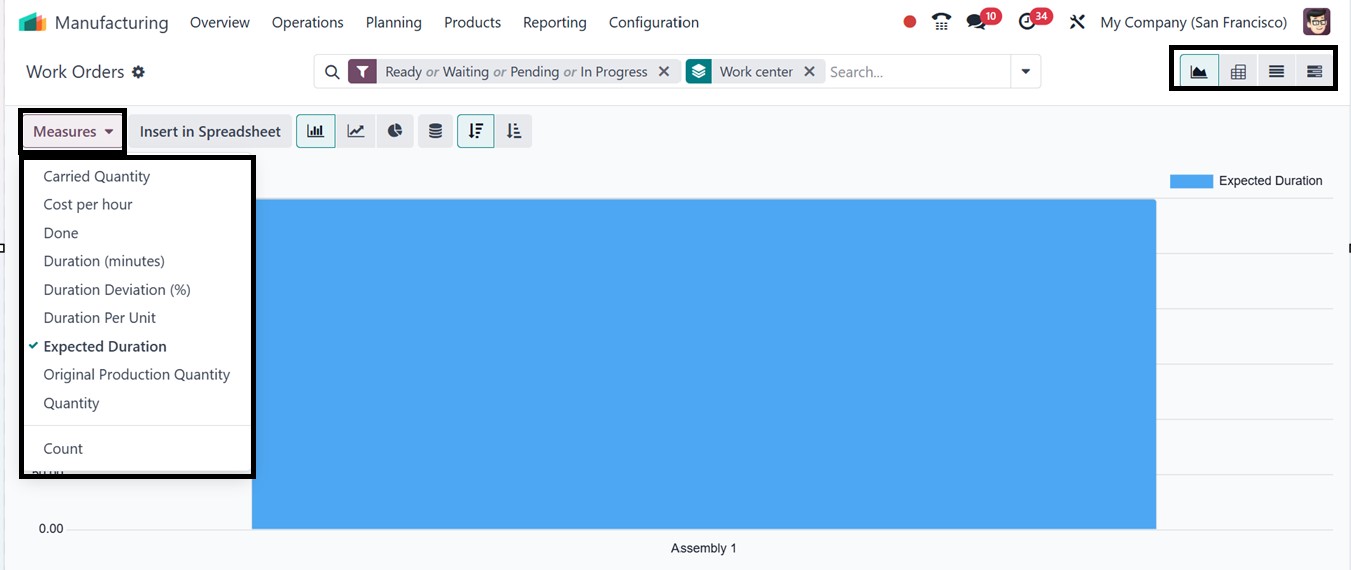
In this Work Orders window, the
report specifics can be
switched with various metrics
that can be used to analyze
the report data based on
multiple parameters such as
the Carried Quantity, Cost
per hour, Done, Duration
(Minutes), Duration
Deviation, Duration Per Unit,
Expected Duration and other
options from the ‘Measures’
button, as illustrated in the
screenshot below.
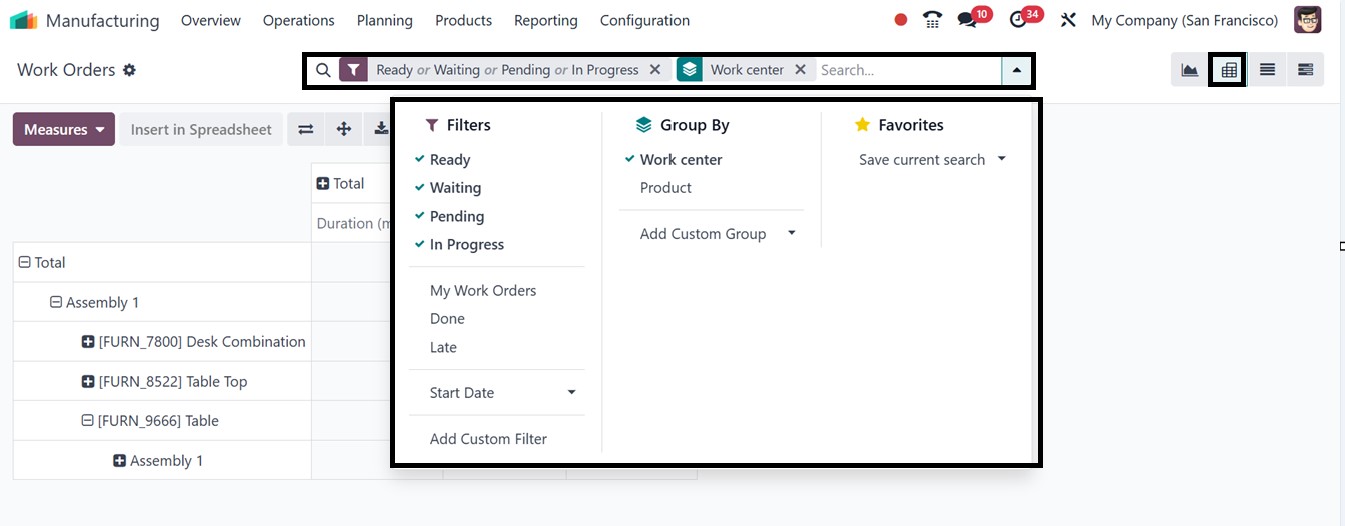
You can also view the reporting
data in Graphical, Pivotal,
List and Gantt formats by
choosing the relevant icon
provided at the top right
corner of the window, with
the pivot view providing a
more analytical approach. The
reporting tools help
facilitate effective and
insightful report creation
with the Filters, Group By
and Favorites sorting options
provided in the advanced
search bar area. To get
customized reports as per
your company specifics, you
can utilize the ‘Add Custom
Filter,’ and ‘Add Custom
Group’ options provided under
the Filters and Group By
sections respectively.
7.2 Overall Equipment
Effectiveness
The Overall Equipment
Effectiveness (OEE) of the
company's work centers can be
assessed using the OEE
reporting platform.
By integrating availability,
performance, and quality into
a single KPI, the
Manufacturing module of Odoo
18's Overall Equipment
Effectiveness (OEE) reporting
assists manufacturers in
increasing the efficiency of
their equipment. It has cycle
time analysis, quality
monitoring, downtime
tracking, and real-time
dashboards. You can also
export data for compliance
and sharing using the
‘Dashboard,’ and
‘Spreadsheet’ options
available in the ‘Actions’
menu of the window.
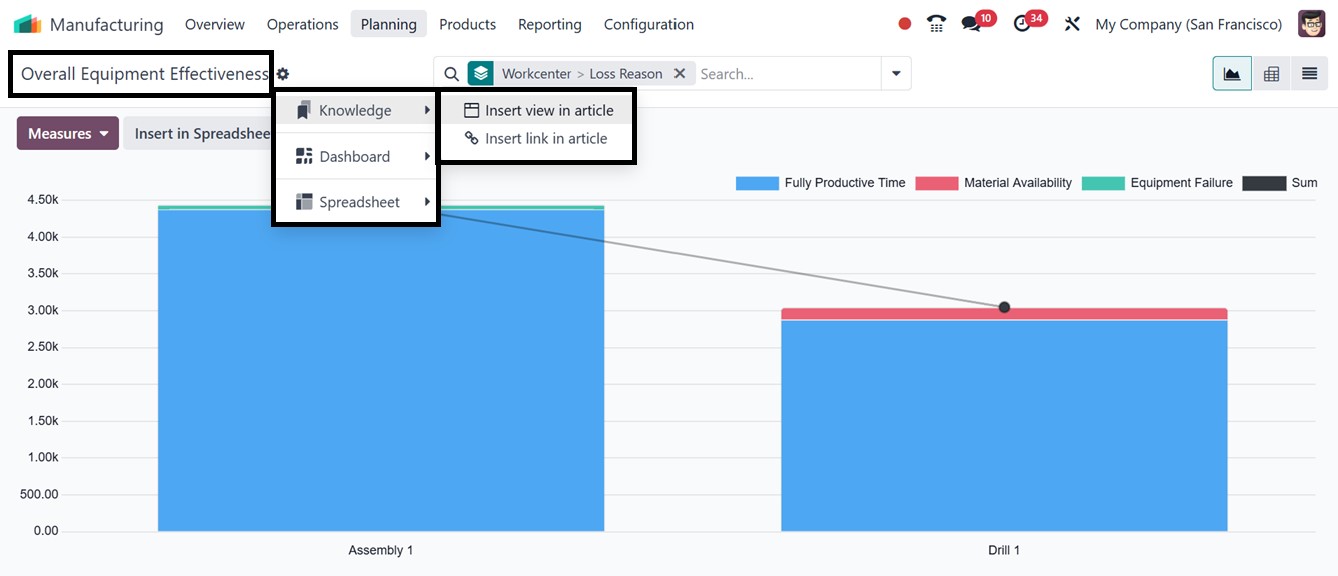
Then, examine time-based reports,
interact with maintenance
logs, and classify the causes
for losses using the
‘Measures’ options including;
Duration, Employee-cost and
Count. To refine the reports
to get specified reporting
you can use the ‘Filters’
option from the advanced
search bar area such as
Availability Losses,
Performance Losses, Quality
Losses, Fully Productive
Time, and Date. You can also
create customized filters
using the ‘Add Custom Filter’
button, as depicted in the
screenshot below.
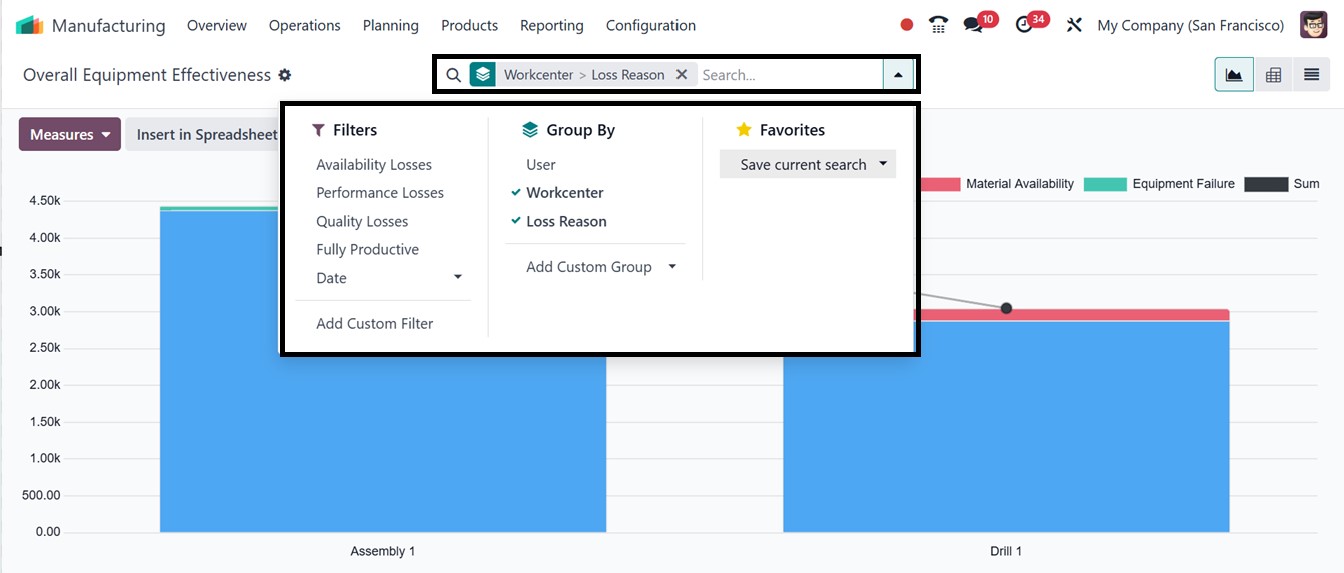
The ‘Group By’ filters can be
used to create certain data
groups according to User,
Workcenter and Loss Reason.
You can also customize a new
group by filter using the
‘Add Custom Group’ option.
Finally, the ‘Favorites’
option can be used to mark
important data or save recent
searches.
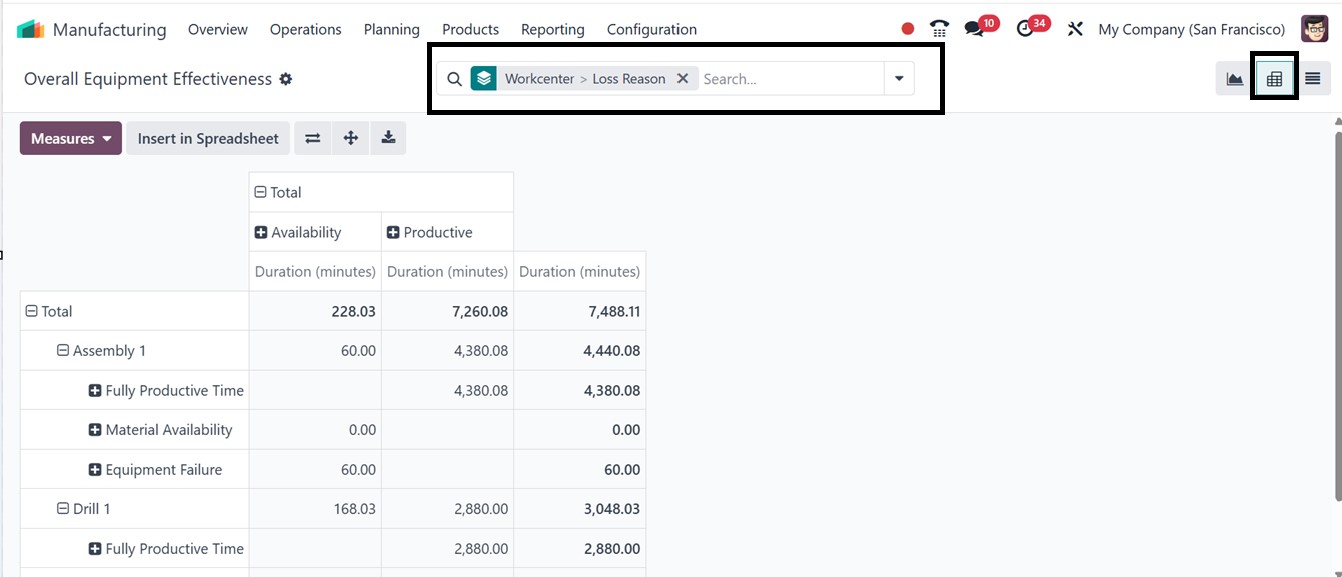
Like all reporting windows in
Odoo, you can switch the bar
chart to other graphical
views, as well as Pivot or
List views, using the icons
located at the top right
corner of the screen, based
on your analytical
requirements and
preferences.For instance, you
can see how the Pivot view
appears in the reporting
window, as shown in the
screenshot below.
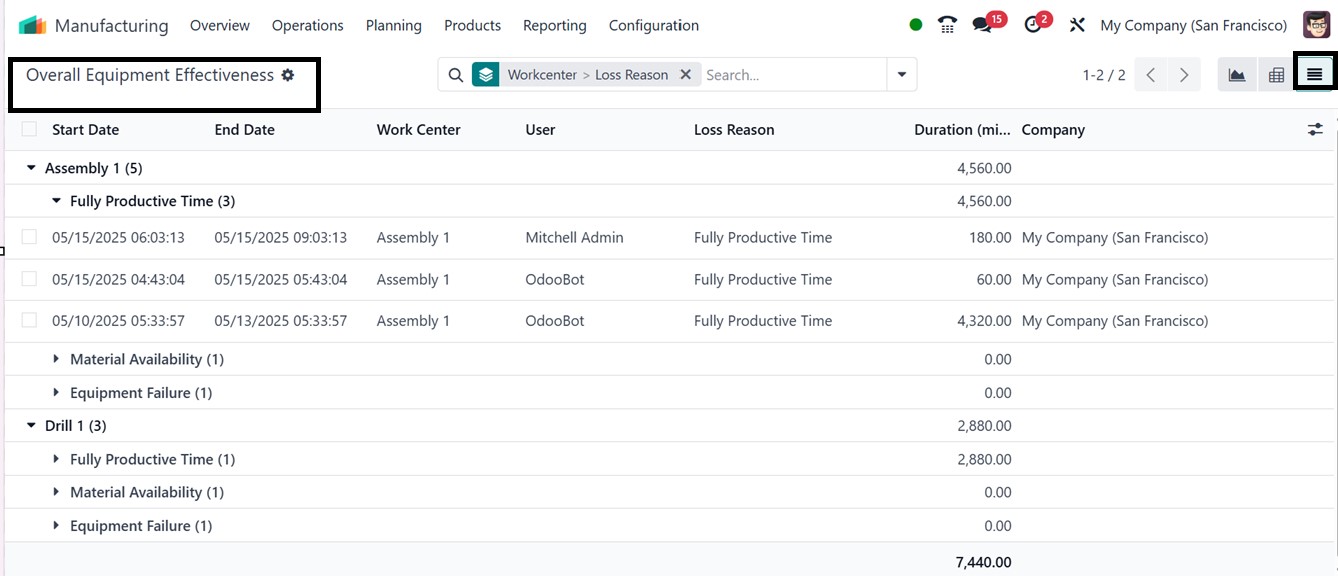
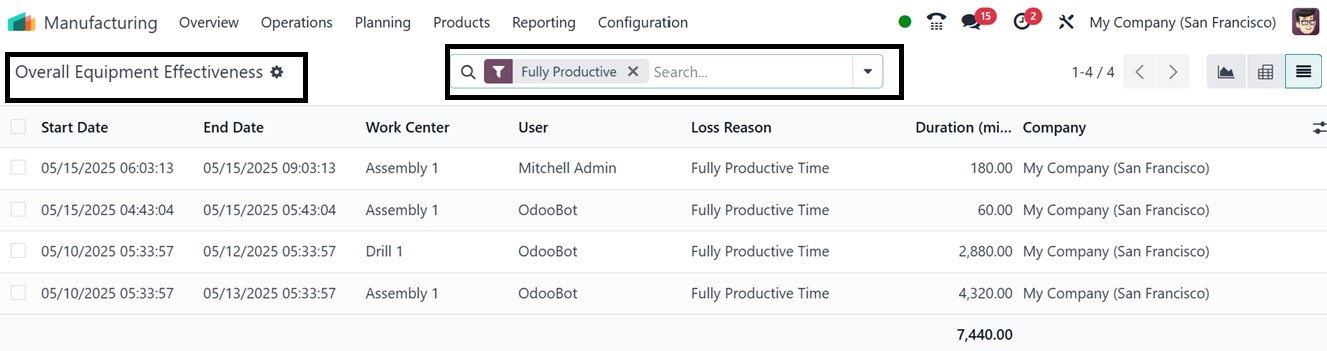
The list view shows critical
parameters like Start Date,
End Date, User, Duration in
Minutes and Loss Reason for
each work center or machine.
You can check the Fully
Productive Time, Material
Availability and Equipment
Availability of a work center
quickly from this dashboard
view. Also, you can sort and
filter out the required data
to identify trends using the
Filter, Group By and
Favorites filter options.
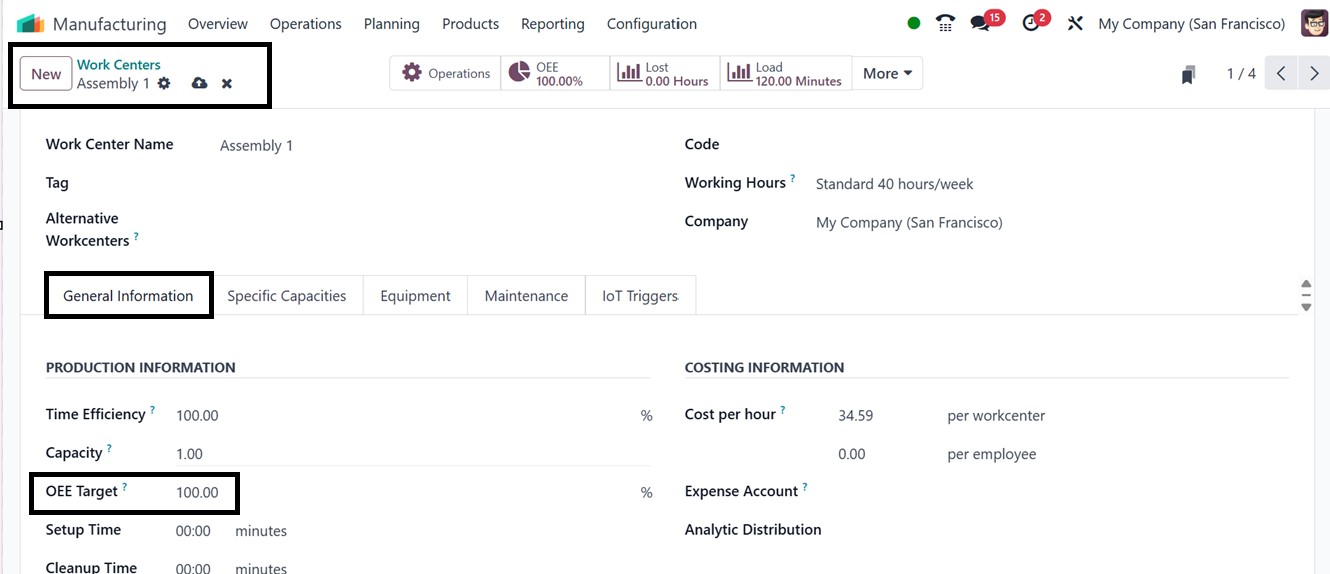
The OEE Target determines the
expected percentage of
totally productive time for a
work center and serves as a
benchmark for efficiency. You
can set your work center
efficiency OEE target to 100%
to monitor performance and
discover inefficiencies from
the ‘Work Centers’ option of
the ‘Configuration’ menu.
After choosing a work center,
input a value (up to 100.00)
in the ‘OEE Target’ field
under the ‘General
Information’ tab of the form
view, as illustrated in the
screenshot below.
In Odoo, the OEE is calculated as
a percentage from 0 to 100,
showing how much of the
planned time a work center
was fully productive. Values
below 100% indicate lost
efficiency due to issues like
reduced operation speed,
material shortages, or
equipment faults. In the
reporting window, use the
'Fully Productive' filter to
see which work centers
achieved or exceeded the
specified OEE target, as
illustrated in the screenshot
below.
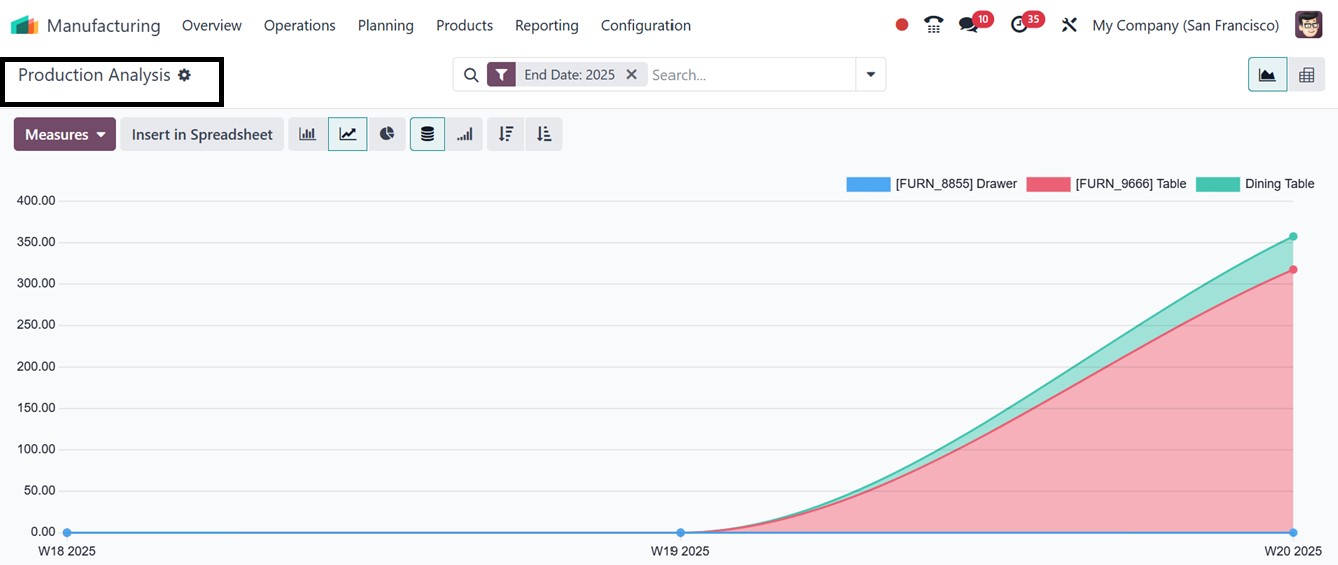
7.3 Production Analysis
In Odoo 18's Manufacturing
module, the "Production
Analysis" reporting window
provides comprehensive
insights into manufacturing
activities, assisting
companies in monitoring
production orders, assessing
productivity, and pinpointing
inefficiencies. It enables
users to assess lead times
and delays, track product
output, and analyze work
center performance in a
default graphical view. On
the X-axis, you can see the
production orders are
displayed, while the Y-axis
shows the corresponding
production costs per unit, as
illustrated in the screenshot
below.
Reports can be exported for
specific time periods using
the ‘Insert in Spreadsheet’
button, helping with trend
analysis and informed
decision-making.
Additionally, the ‘Action’
menu allows you to generate
reports or articles and add
views or data to dashboards
and spreadsheets using the
Knowledge, Dashboard, and
Spreadsheet options.
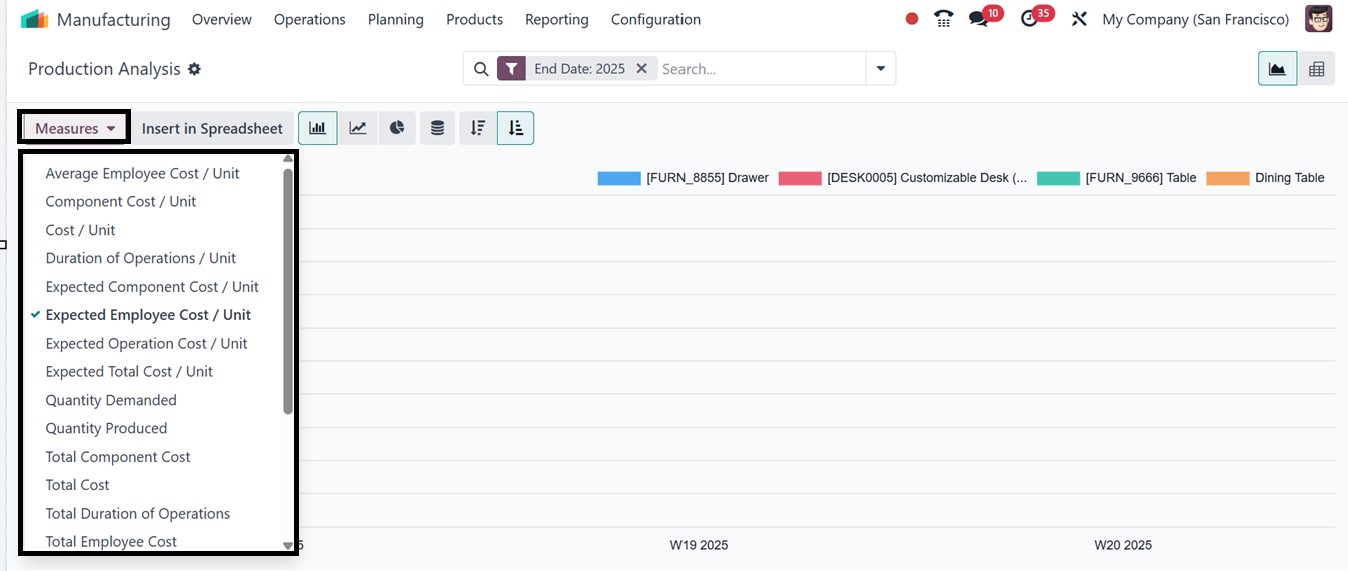
To change the y-axis perspectives
or analytical parameters, you
can utilize the ‘Measures’
button that contains various
options including, Component
Cost/Unit, Average Employee
Cost/Unit, Cost/Unit,
Duration of Operation,
Expected Component Cost/Unit,
Expected Employee Cost/Unit,
Expected Operation Cost/Unit
etc, as depicted in the
The icons in the upper right
corner of the reporting
window provide access to a
number of visualization
options including a detailed
Pivot view and different
graphical chart views (such
as bar, line, and pie charts)
for adaptable data analysis.
These tools will allow you to
examine data from various
angles based on your own
requirements.
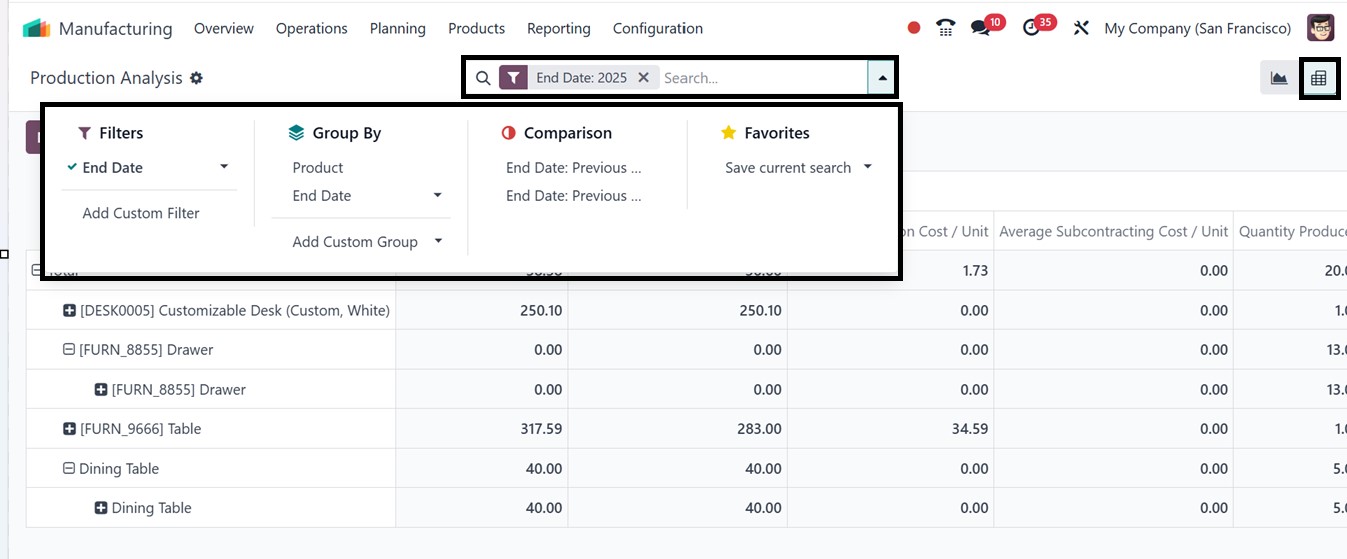
Then, you can utilize the Filters
and Group By options in the
search bar area to apply
filters and group data by
product, work center, date,
or other criteria in order to
further narrow the study.
This facilitates the process
of separating important data
and spotting trends or
inefficiencies. You can also
store frequently used search
criteria in the Favorites
area, giving instant access
to personalized views for
later usage. Additionally,
you can compare production
data from various time
periods using the Comparison
filter, which facilitates
trend research and
performance benchmarking. As
seen in the picture below,
these features are
particularly helpful while
working in the Pivot view.
Overall, the reporting menu of
the Manufacturing Module
facilitates cost analysis,
which enables companies to
use workforce, material, and
overhead costs to evaluate
manufacturing profitability.
In conclusion, the Odoo 18
Manufacturing module provides
robust tools to manage the
full production cycle,
improving efficiency through
features like order
management, by-product
tracking, inventory
automation, and quality
control.