6. Reporting
Users can control the payroll costs after assessing the reports. We
are able to evaluate the salary attachment report, work entry
analysis, and payroll. In a corporation, maintaining reports at the
end of a month or fiscal year is straightforward.
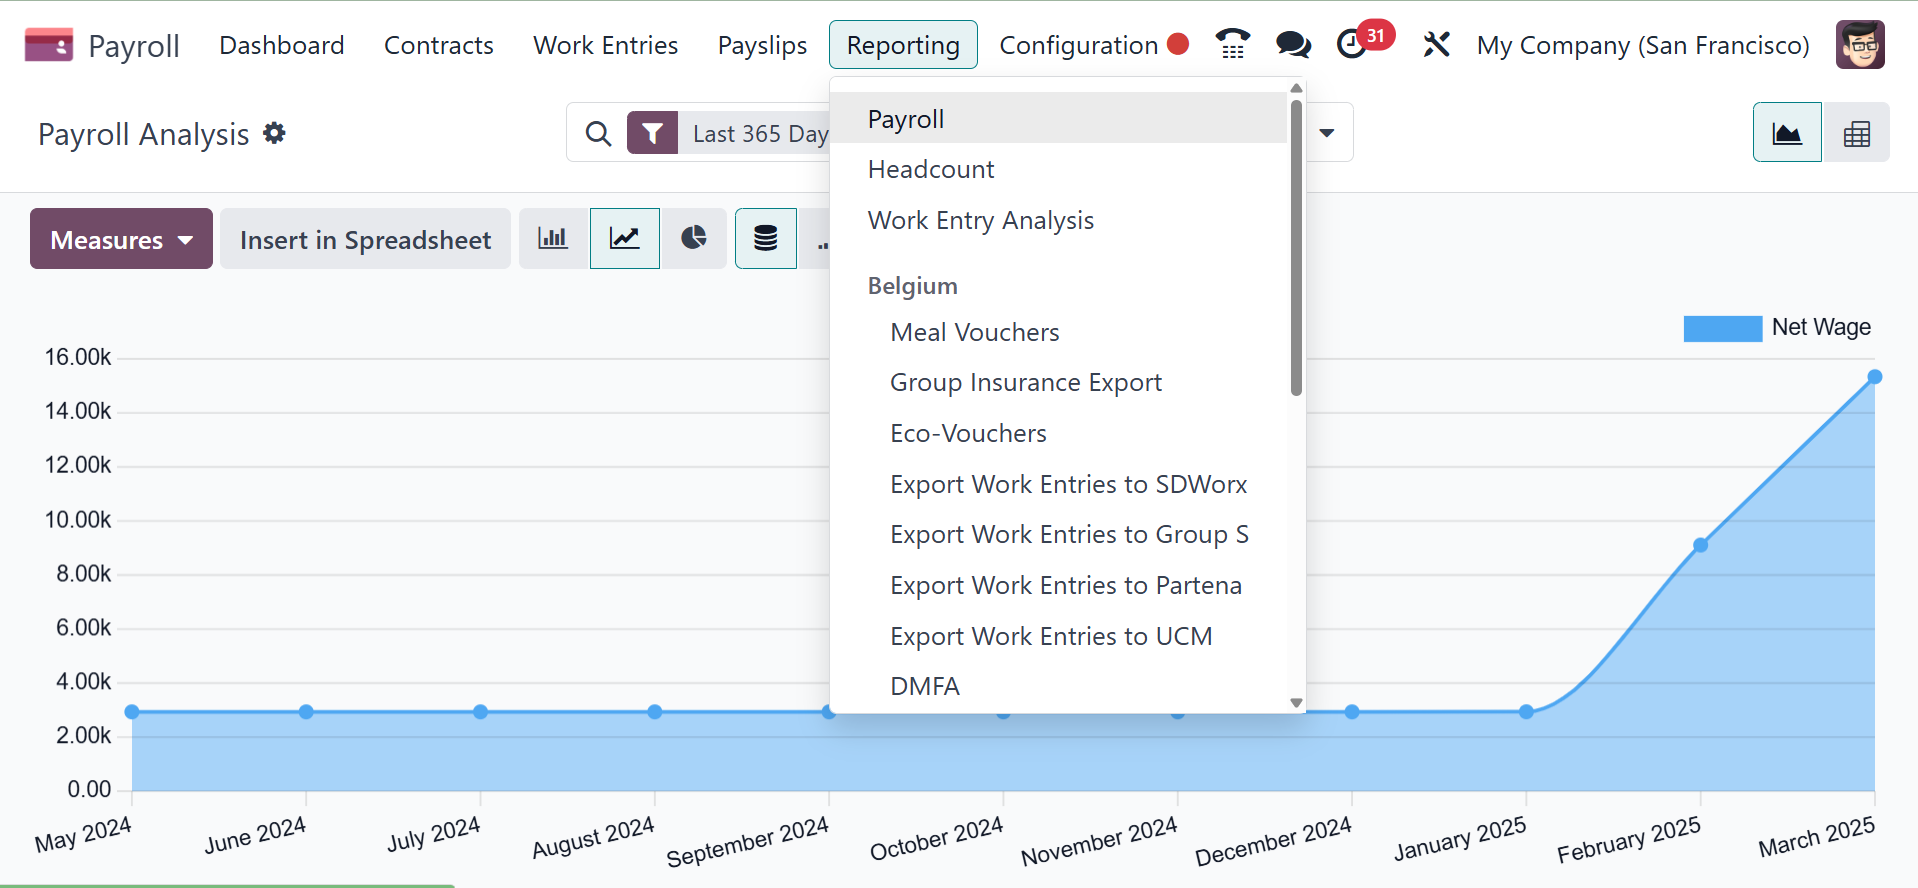
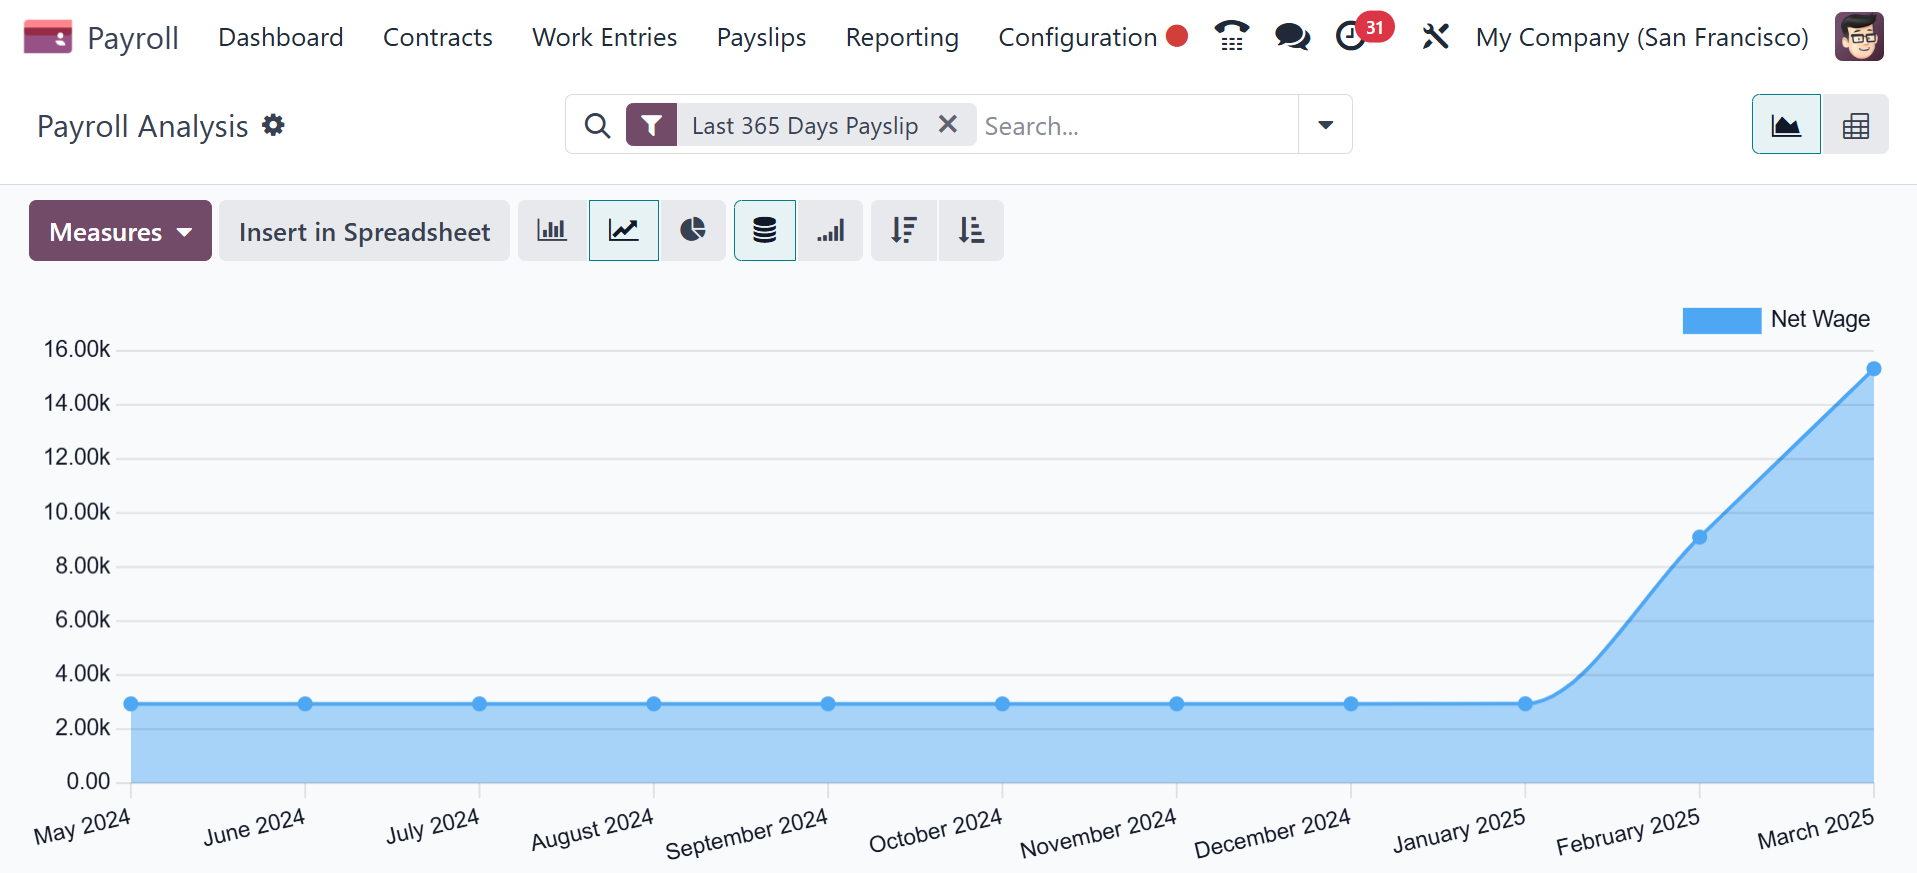
6.1 Payroll
We may see the corporate payroll data after choosing the Payroll menu
from the Reporting tab. The graph of the Payroll Analysis window
shows the Basic wage on the Y-axis and the Start Date on the X-axis.
By selecting the Measures icon, we may apply several values,
including Gross Wage, Work Days, Number of Hours, Days of Unpaid
Time Off, Work Hours, and more. Additionally, the graph can be found
in a number of different styles, such as pie charts, line charts,
graph charts, and more.
6.2 Headcount
A summary of a company's workforce over a certain time period may be
seen in the Headcount report under the Reporting menu.
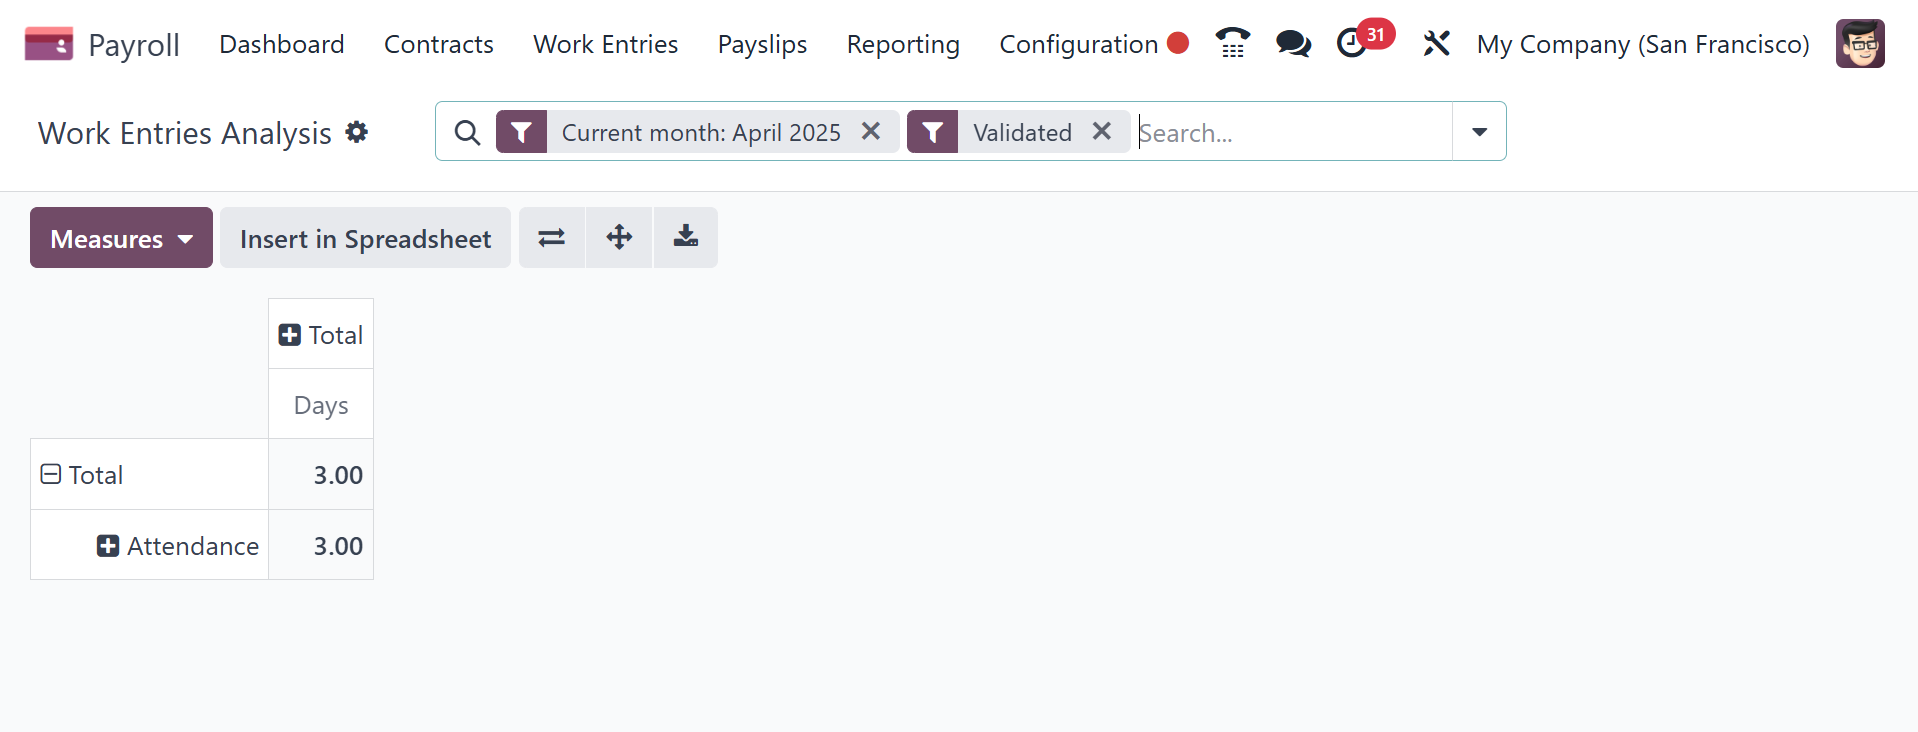
6.3 Work Entry Analysis
The user is presented with a tabular report after selecting the Work
Entry Analysis menu from the Reporting tab. The pivot table contains
job entry analysis by attendance, sick days, unpaid time off, and
other factors. It is easy to evaluate the task input in terms of
metrics, such as a day or count, by using the Measures button.
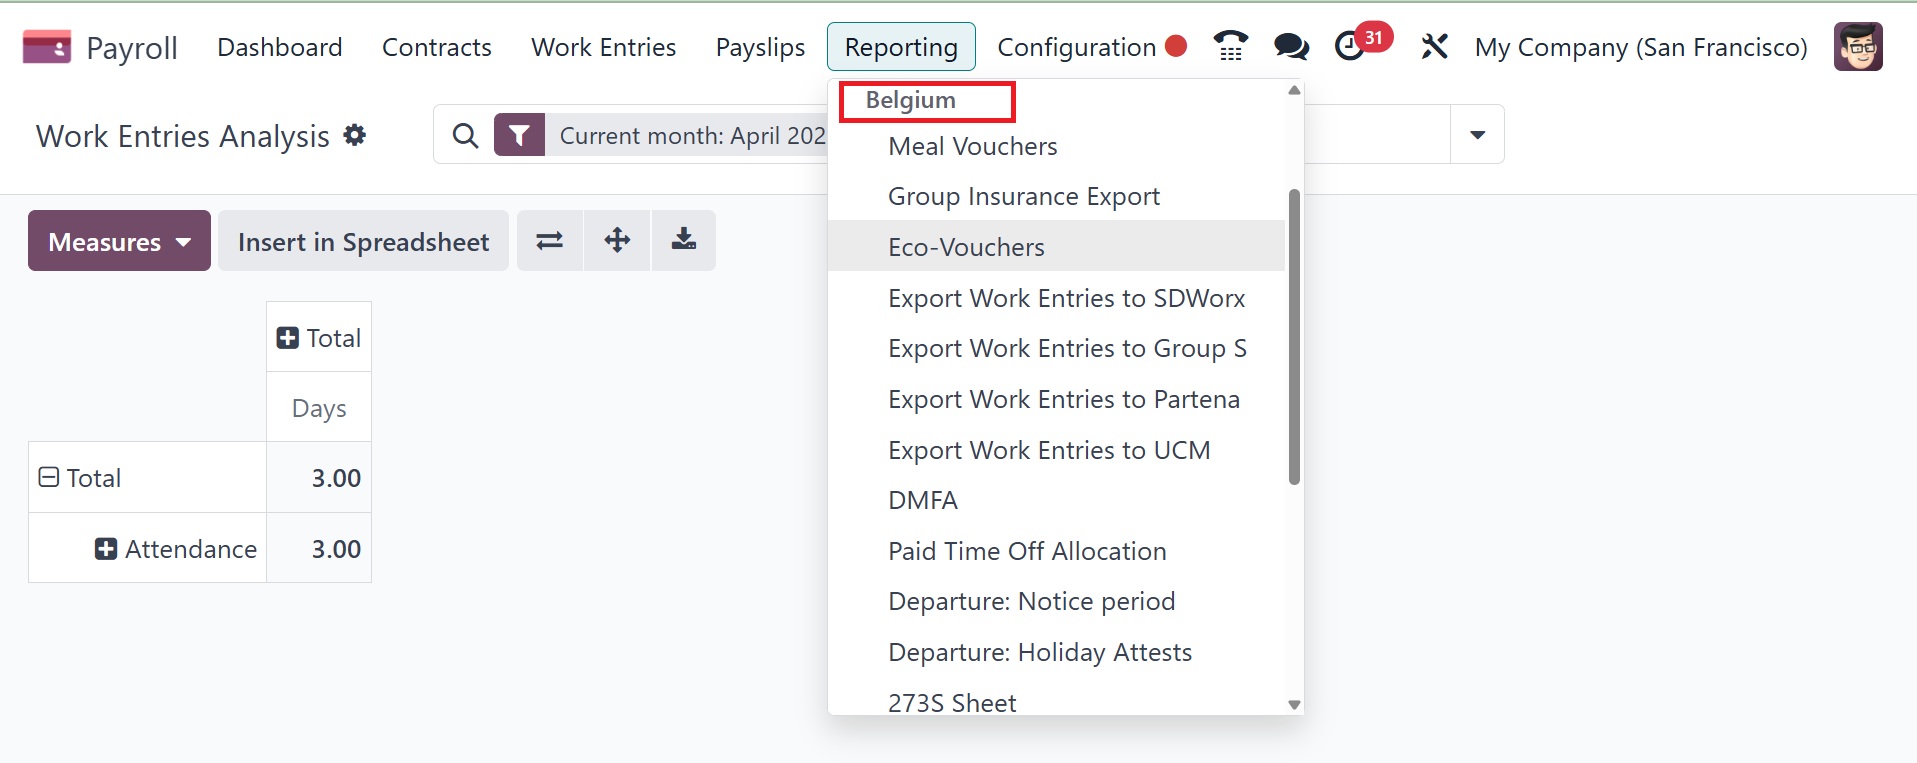
6.4 Belgium
Reports covering every facet of the Belgian localization, such as
meal vouchers, group insurance export, eco-vouchers, DMFA, paid time
off allocation, departure: Notice period, 273S Sheet, and many more,
are available in the "Belgium" area of the "Reporting" menu. The
reports that are produced utilizing the Belgian-specific tax and
accounting procedures are available for us to view.
Thus, Odoo 18's Payroll module is better equipped to tackle a
company's difficult salary management task.