4. Reporting
Depending on the logged actions, Odoo 18 provides a number of
reporting options for every module. The reporting feature of the
Odoo 18 Quality module shows reports for Quality Checks and Quality
Alerts.
4.1 Quality Check
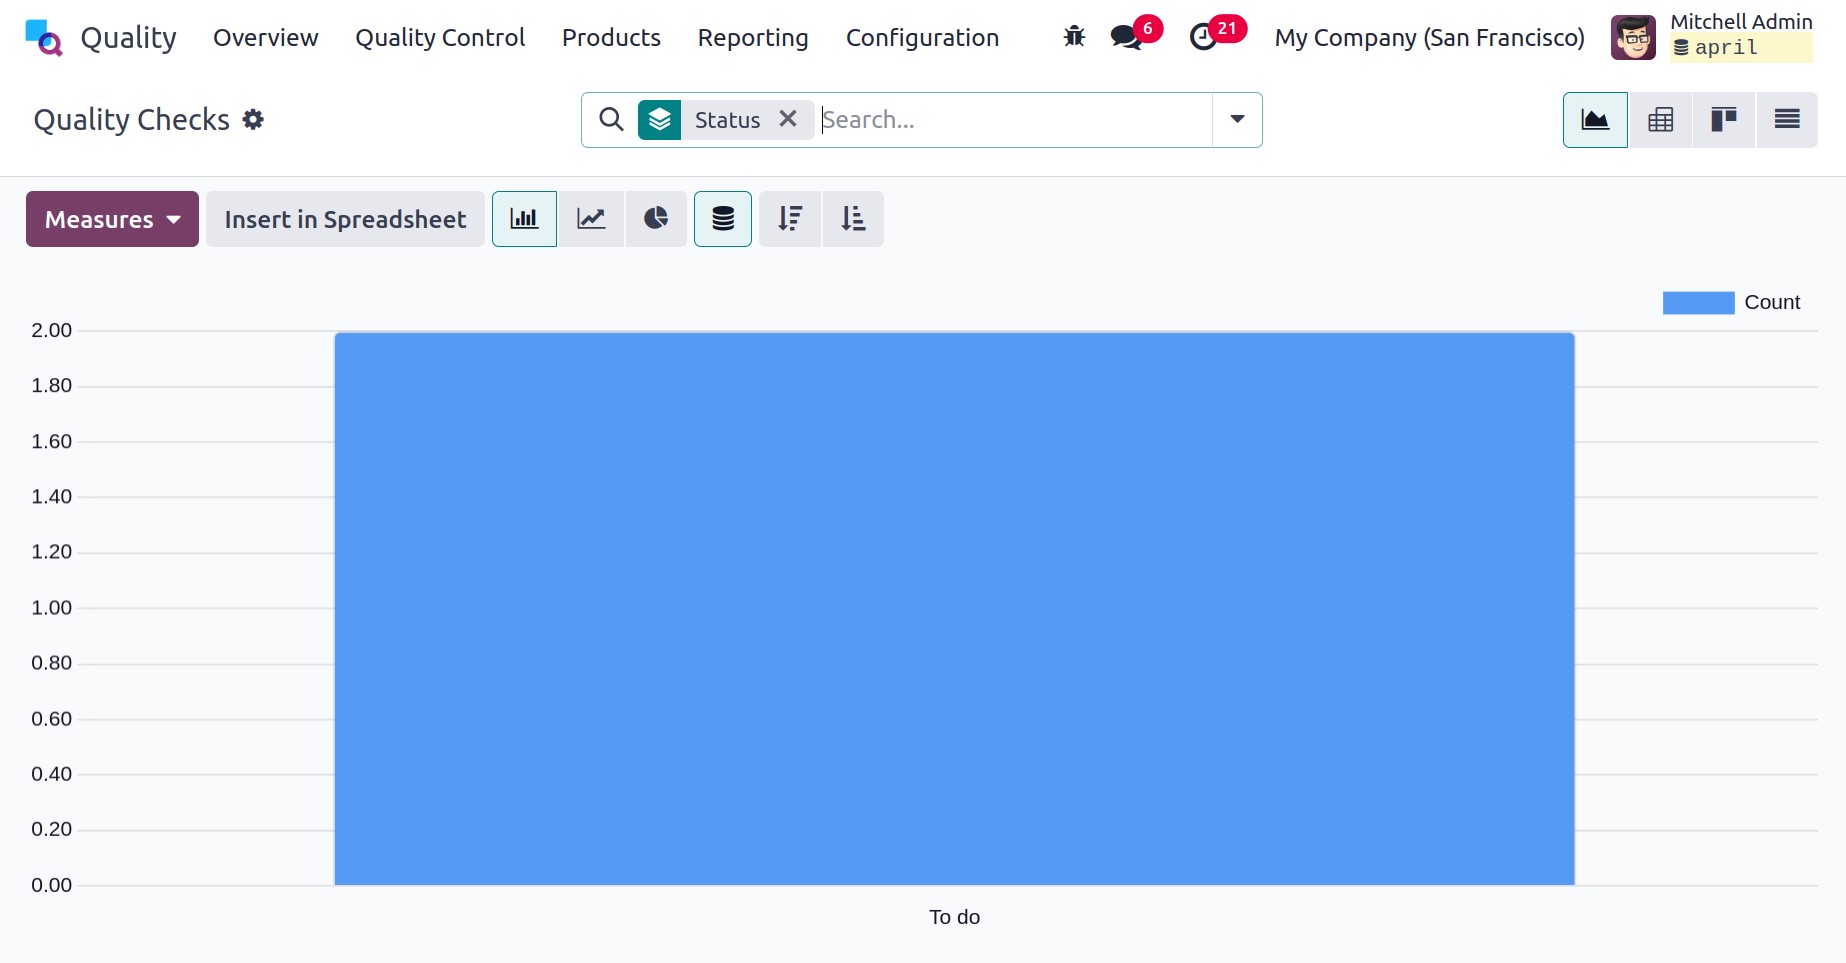
Choose Quality Checks in the Reporting menu to launch a new window
featuring a graphical display of the status of quality checks. The
graph view displays Status data on the X-axis and Count data on the
Y-axis. Customers can examine quality checks by plotting different
measurements over graphical displays. We can work with values such
as Done, Measure, Finished Product Sequence Number, and Quantity
Tested by selecting the Measures icon.
These quality checks are arranged here based on their state. Quality
tests can also be grouped by Add Custom Group, Control Point, Team,
Finished Lot/Serial, and other criteria. By choosing the Group menu,
you can include this data in the graph.
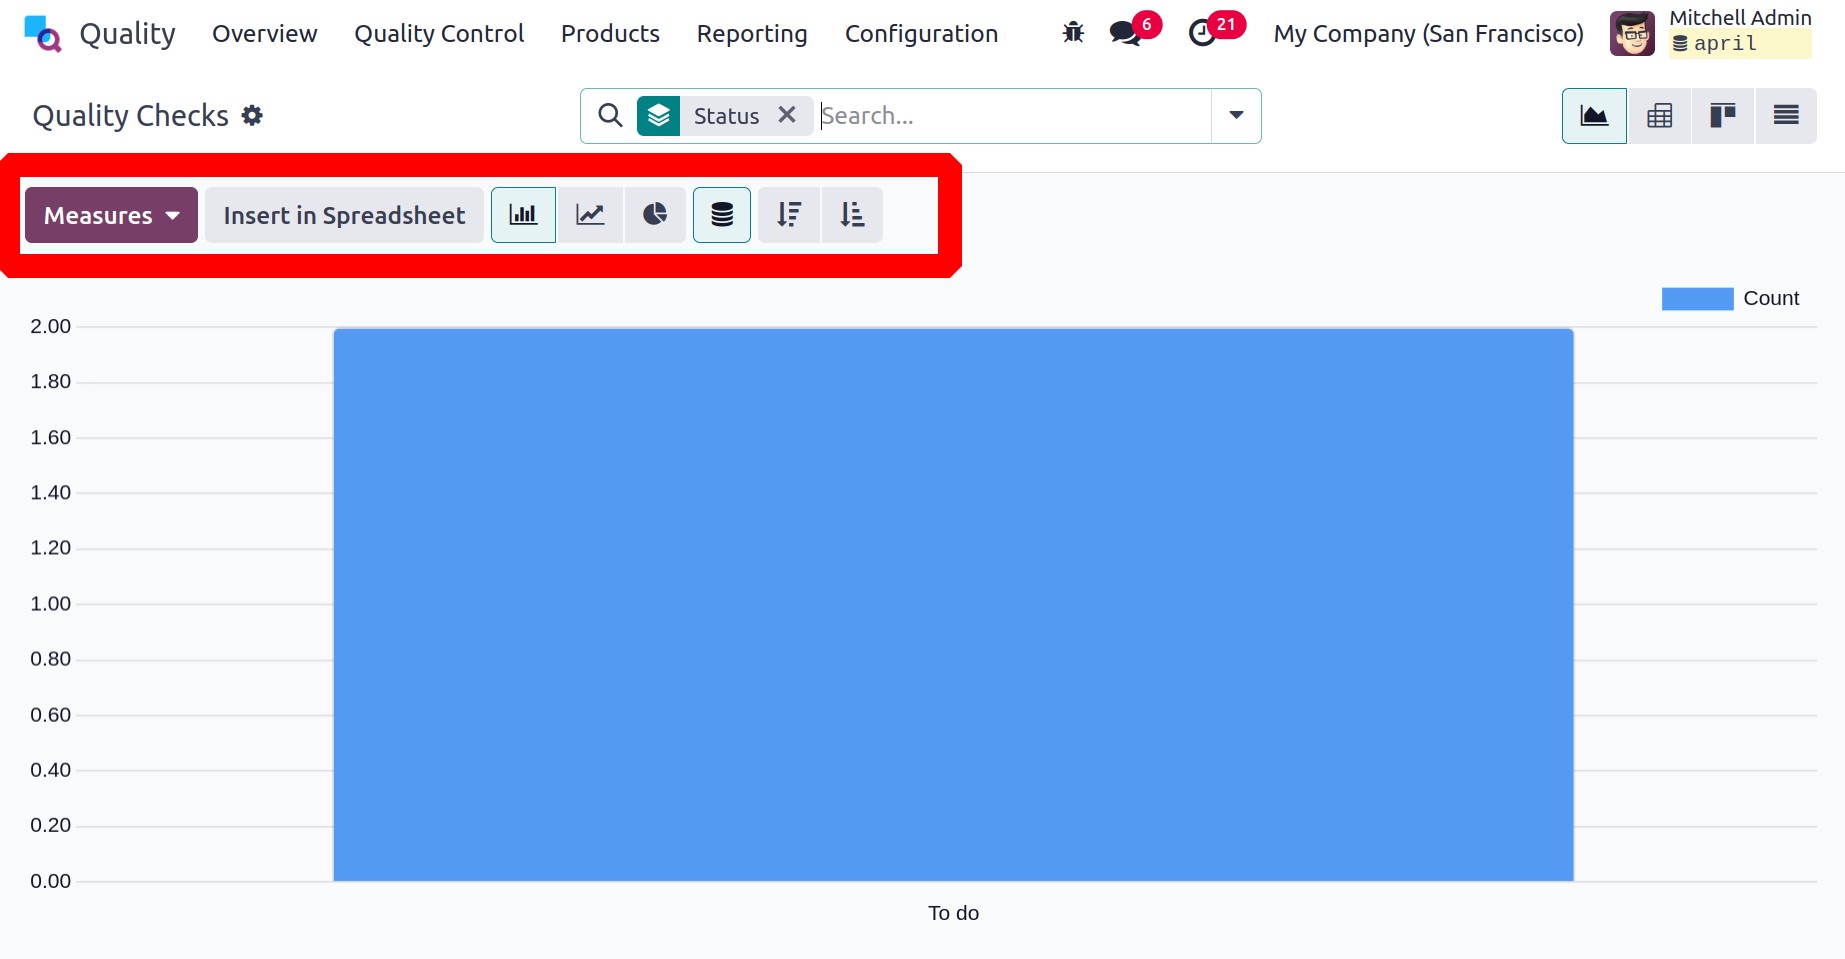
The graph is also provided in line, pie, and bar chart formats.
Choose the Quality Alerts option under the Reporting tab to evaluate
an alert. The quality alert report on the given page is based only
on the root cause. You can identify the problems and take corrective
action after reviewing the report.
4.2 Quality Alert
If you choose Quality Alerts from the Reporting tab, it opens a new window with a chart indicating the quality alert status. Users may also analyze quality checks by loading several measurements over graphical representations. The quality alerts are grouped here by status.
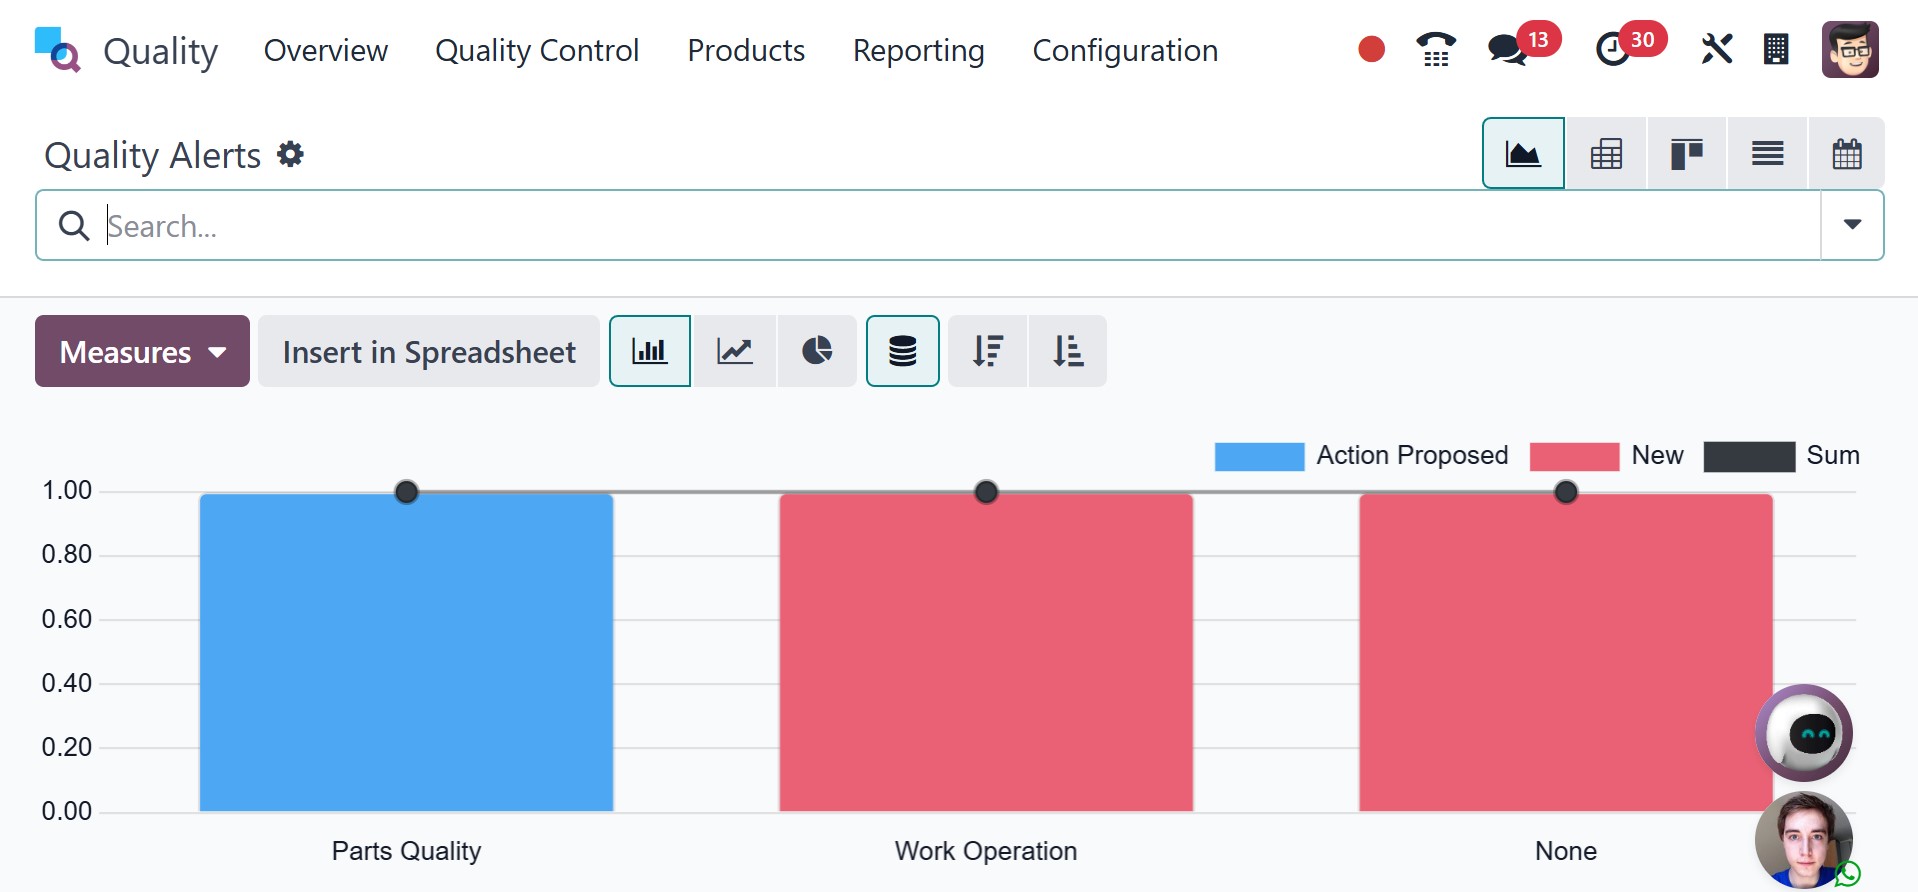
Additionally, quality checks can be added to custom groups and organized according to stages and root causes. By choosing the Group menu, you can include this data in the graph.