23. Sales Reporting
In Odoo 18, the Sales Reporting feature in the Sales module provides
businesses with an effective way to analyze sales performance over
specific timeframes, such as daily, weekly, monthly, or yearly. The
Reports tab offers in-depth insights into sales metrics, enabling
data-driven decision-making that enhances productivity and business
growth. By navigating to the Sales Analysis window, users can
generate detailed reports that help shape strategic planning.
23.1 Sales Analysis
Within the Sales Analysis view, users can leverage the Measures
option to select key sales data for analysis.
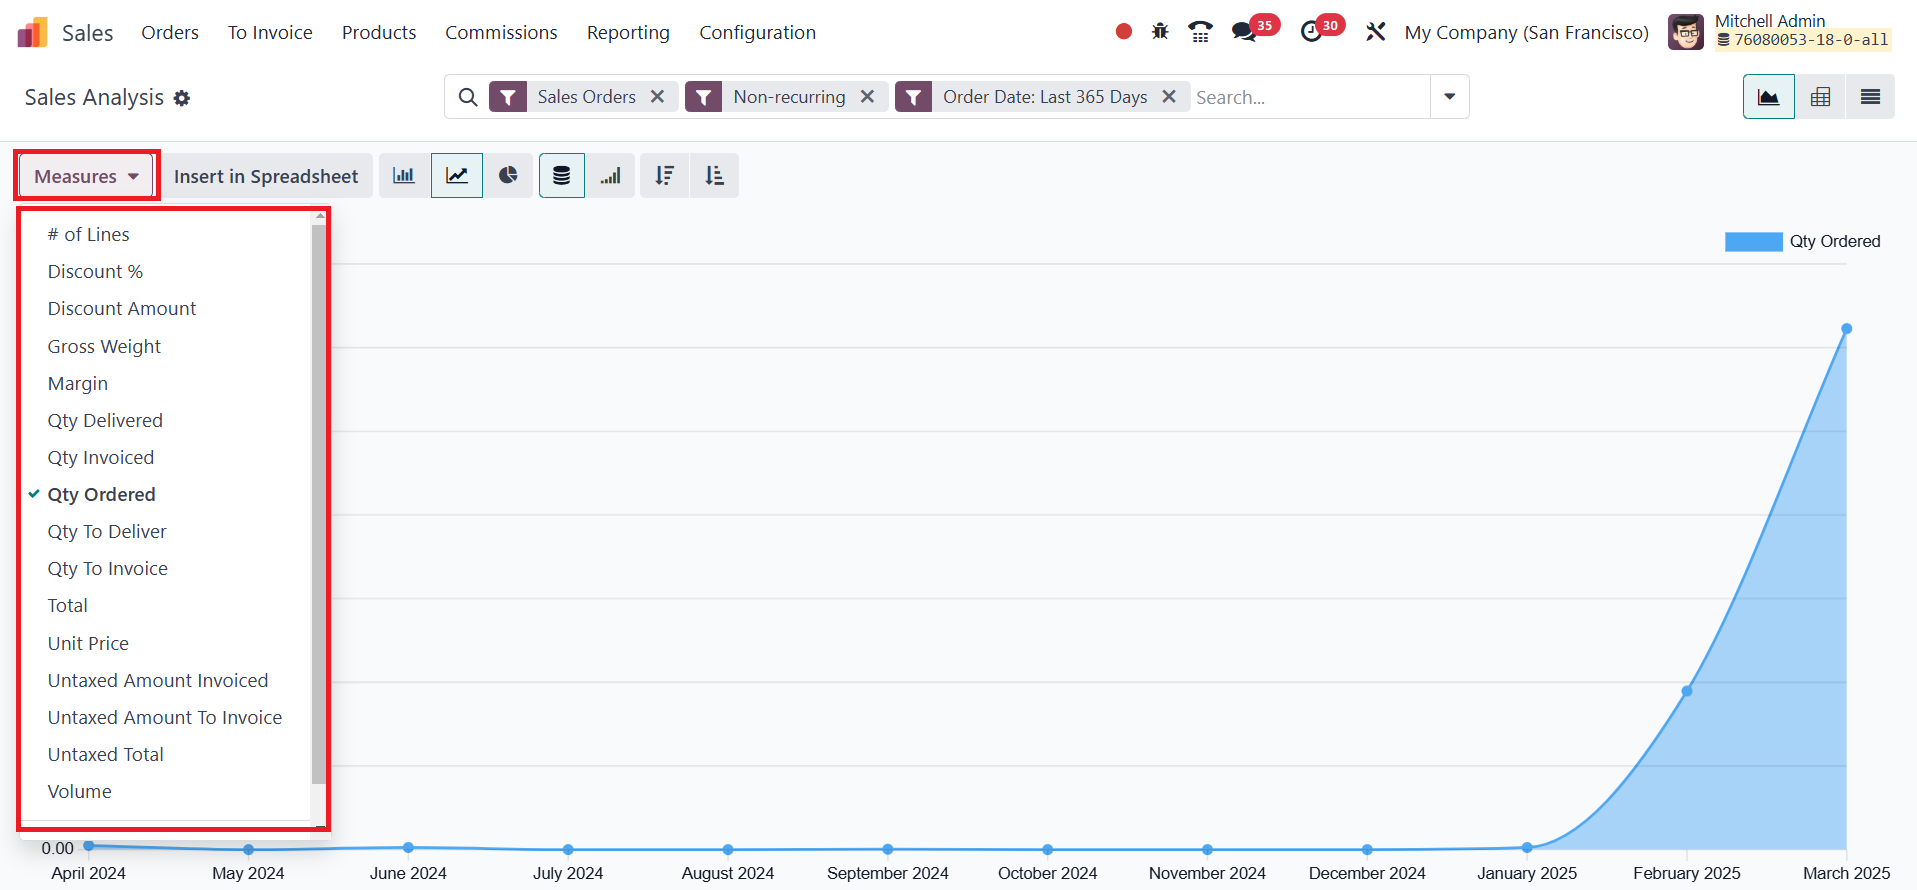
The view is highly customizable, allowing users to switch between
different formats using the icons at the top-right corner of the
window. Odoo offers both Graphical and Pivot views for data
representation.
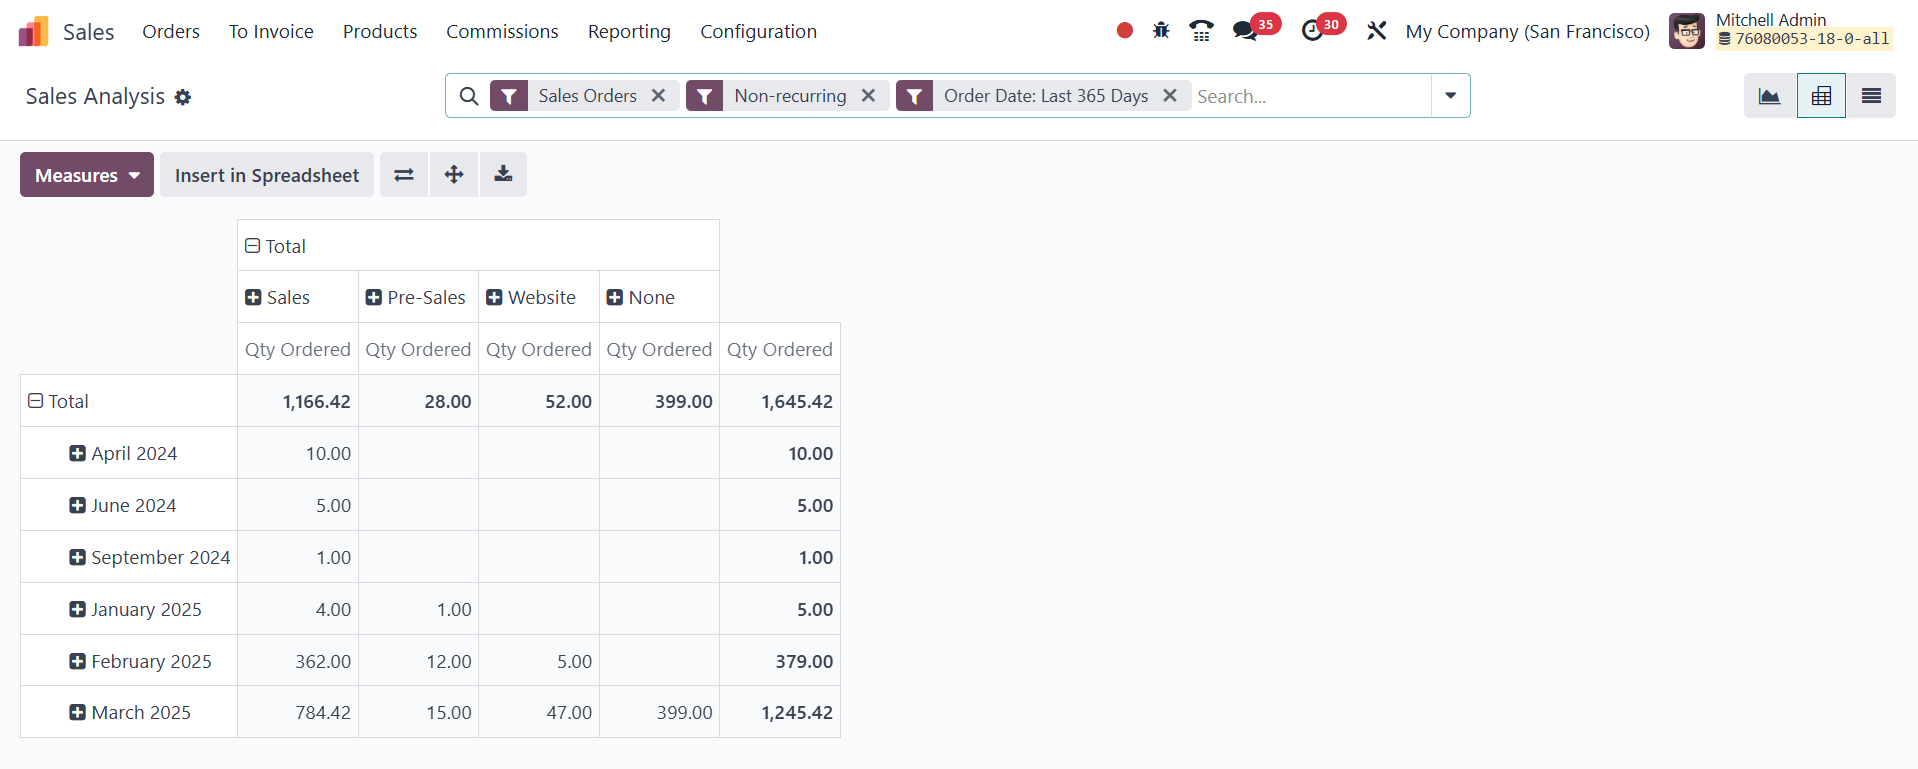
- The Pivot view provides a structured, tabular format that makes
it easier to analyze detailed sales data. It includes features
like Flip Axis for reorganizing data, Expand All for drilling
down into record details, and Download XLSX for exporting
reports into Excel.
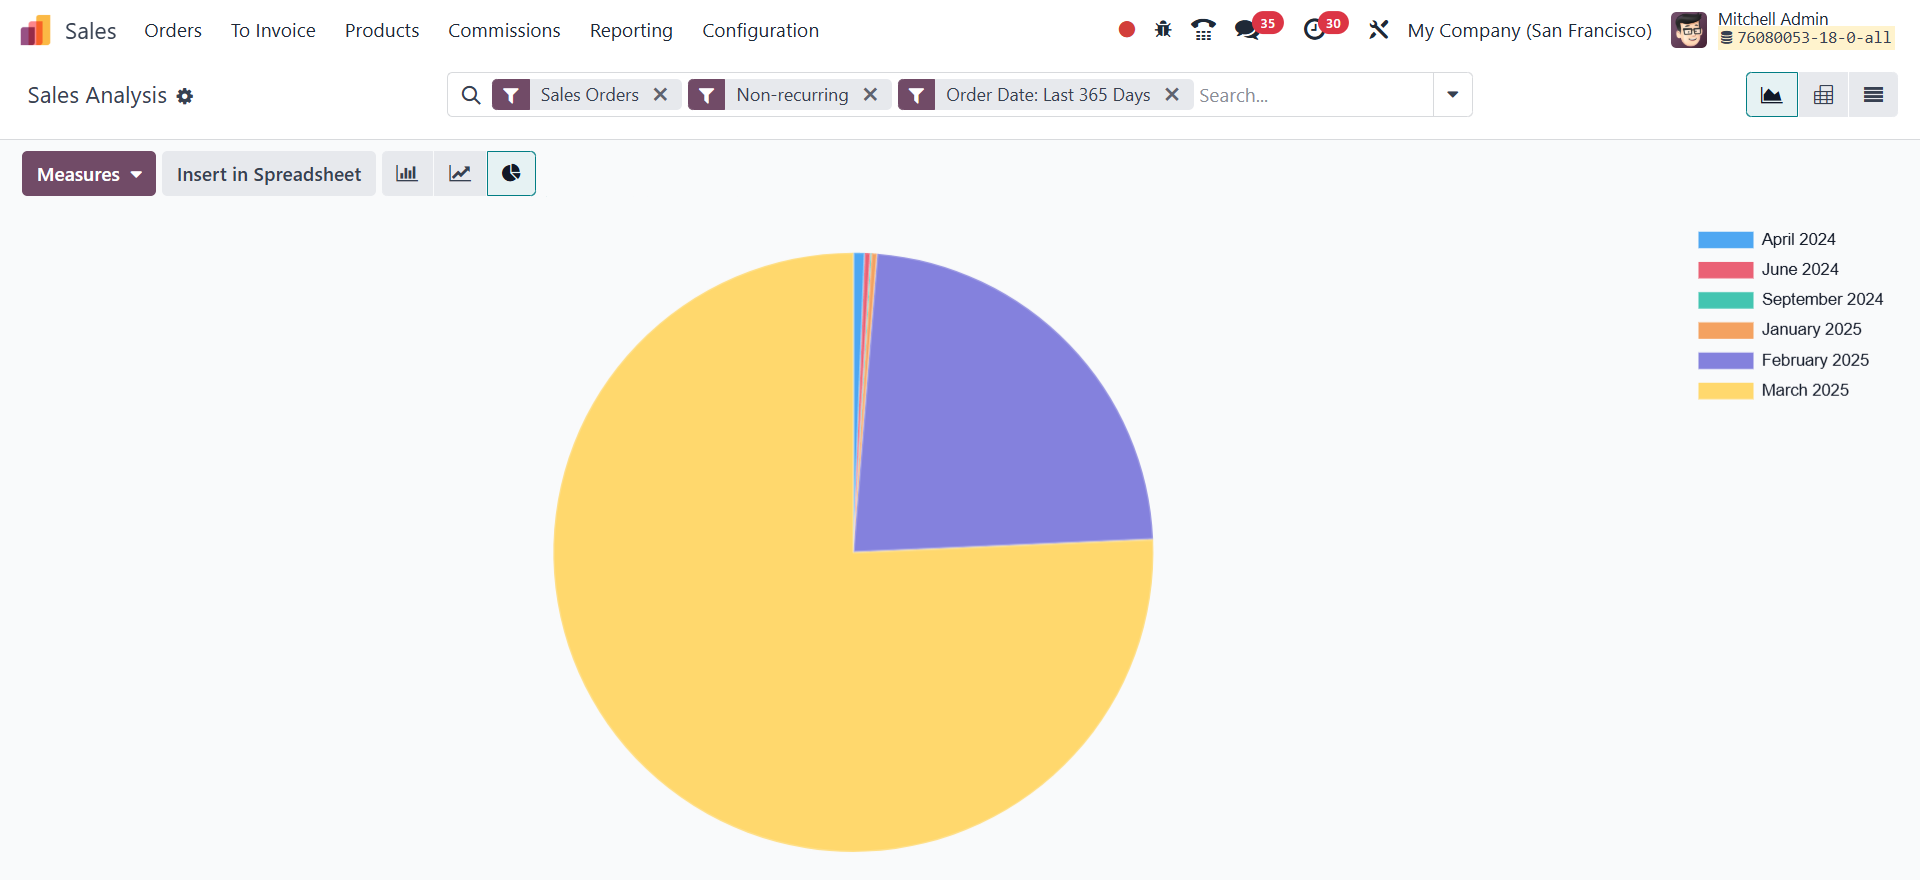
- The Graphical view presents data in Bar Charts, Line Charts, and
Pie Charts, offering a visual representation of sales trends and
patterns.
Additionally, Filters and Group By options allow users to refine
sales reports based on specific requirements, making trend analysis
and performance tracking more effective.

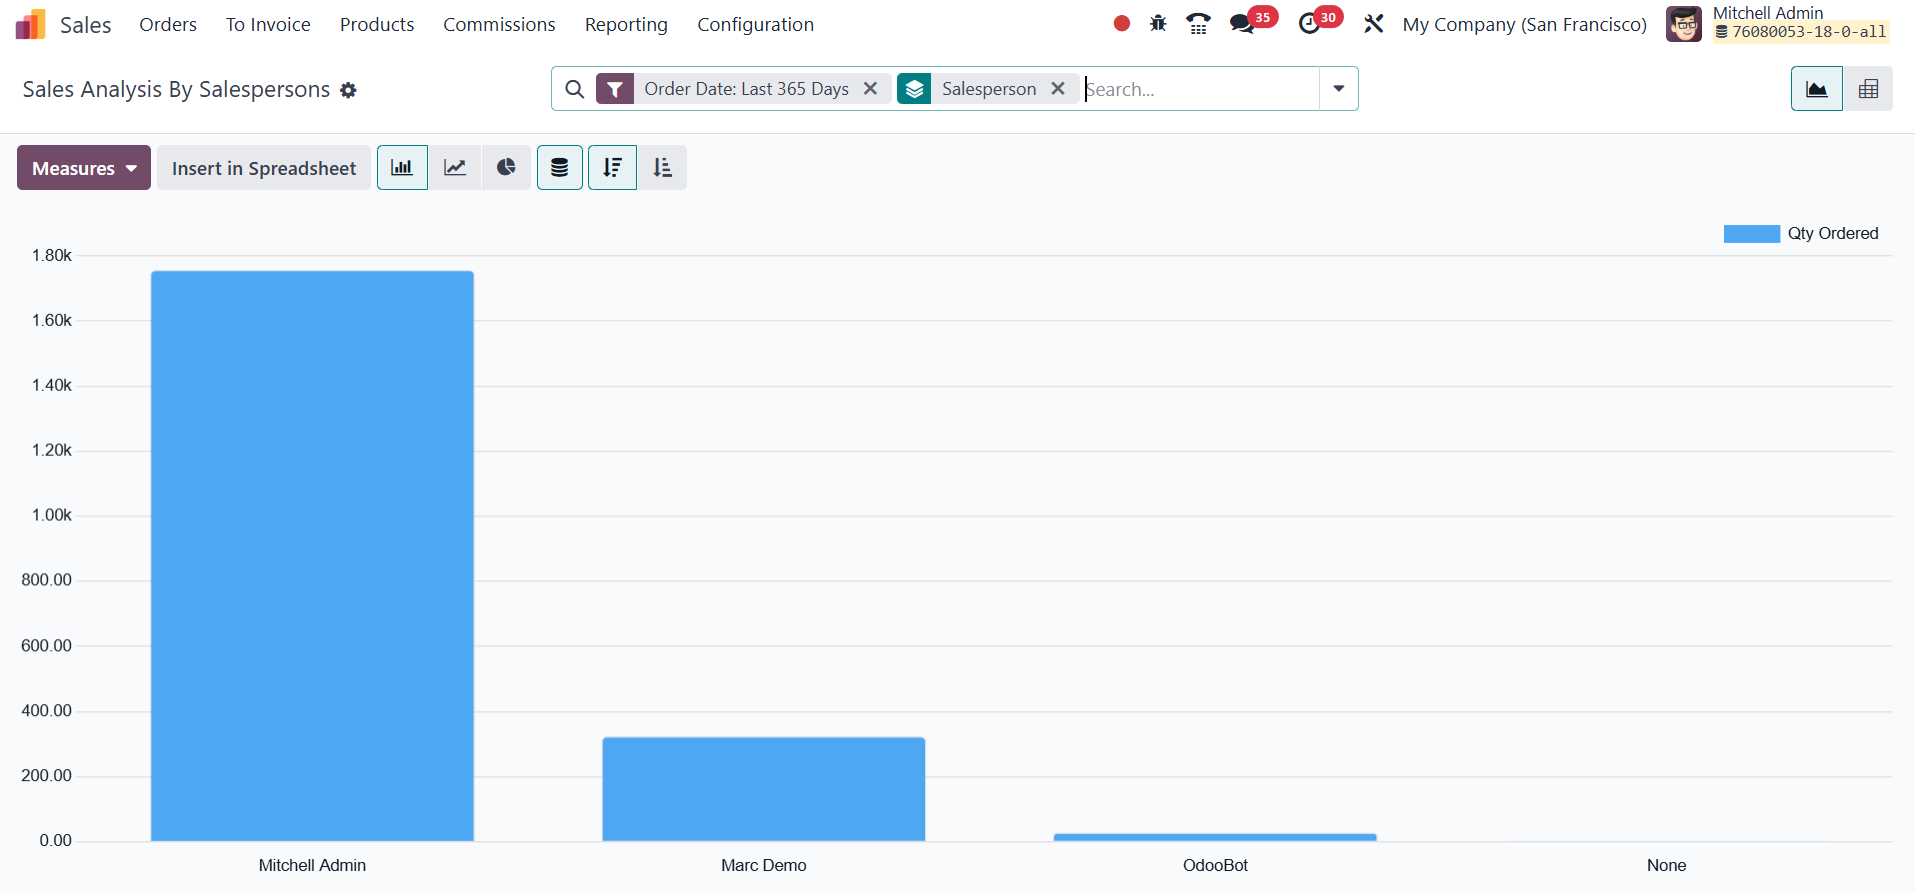
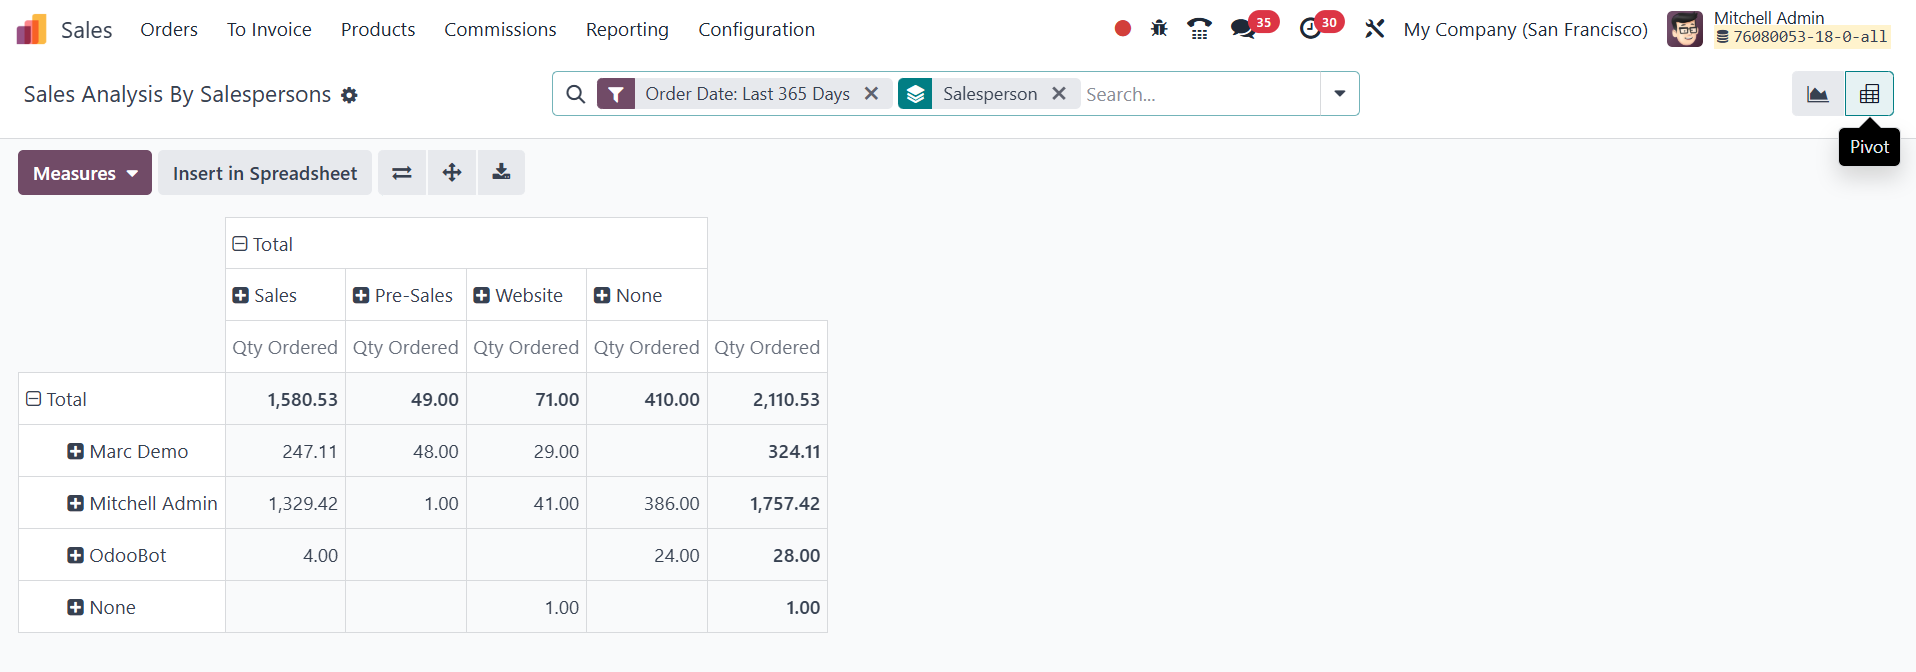
23.2 Sales Analysis by Salespersons
The Sales Analysis by Salespersons feature enables businesses to
evaluate individual sales representatives’ contributions to overall
revenue. This insight helps in monitoring sales performance, setting
targets, and making informed managerial decisions.
To access this report, users navigate to the Reporting tab and select
Sales Analysis By Salespersons. The Group By option allows data
segmentation by multiple features, and additional filters like date
range or specific orders help refine the report further.
-
The Graphical view includes:
Bar Chart – Compares sales figures across different
salespersons.
Line Chart – Displays sales performance trends over
time.
Pie Chart – Highlights the proportion of sales
contributed by each salesperson.
- The Pivot view presents a detailed breakdown of total sales,
revenue, and order quantities per salesperson. This report can
also be exported via the Download XLSX option for further
analysis.
23.3 Sales Analysis by Products
The Product Reporting feature provides insights into the sales
performance of different products, helping businesses optimize
inventory, pricing strategies, and overall sales operations. By
accessing the Reporting tab, users can generate detailed reports on
product sales, revenue, and trends.
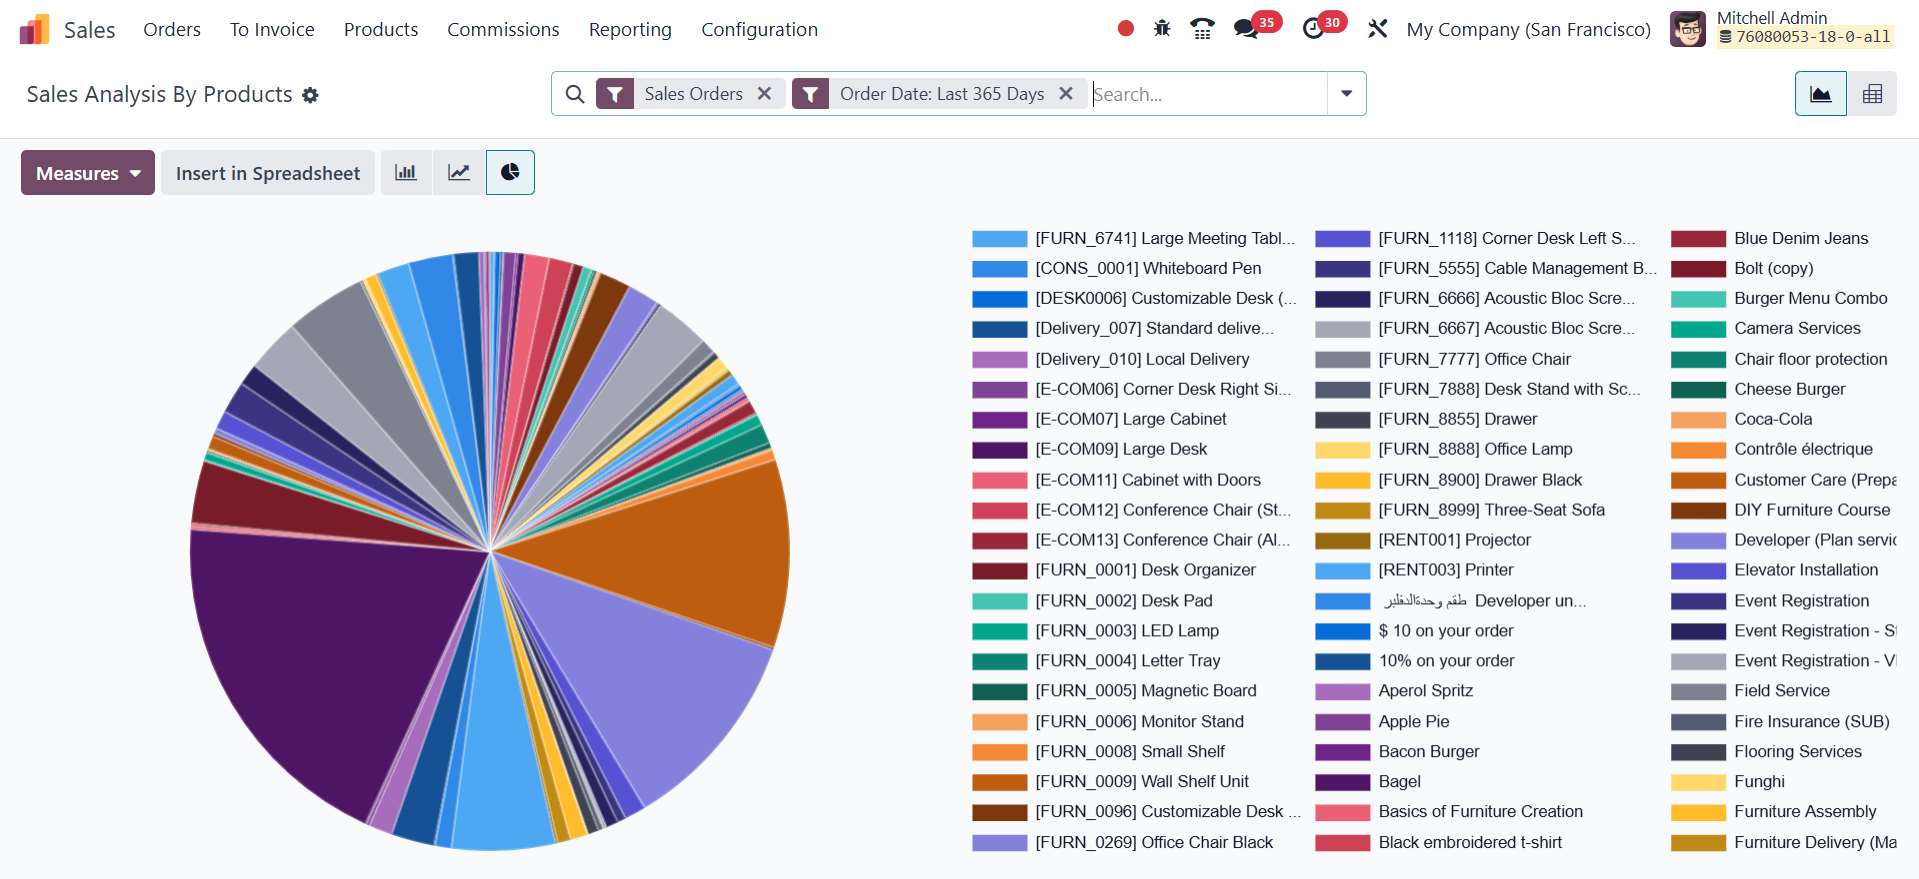
Filters and grouping options enable businesses to refine their
reports based on product categories, specific products, or time
periods. These reports can be visualized in graphical formats (bar,
line, or pie charts) or detailed pivot tables, ensuring data is
presented in a way that supports decision-making. Analyzing
high-performing and underperforming products helps businesses adjust
their inventory and marketing strategies accordingly.
23.4 Sales Analysis by Customers
The Sales Analysis by Customers feature allows businesses to evaluate
customer-specific sales performance, providing insights into
purchasing behavior, revenue contribution, and customer value.
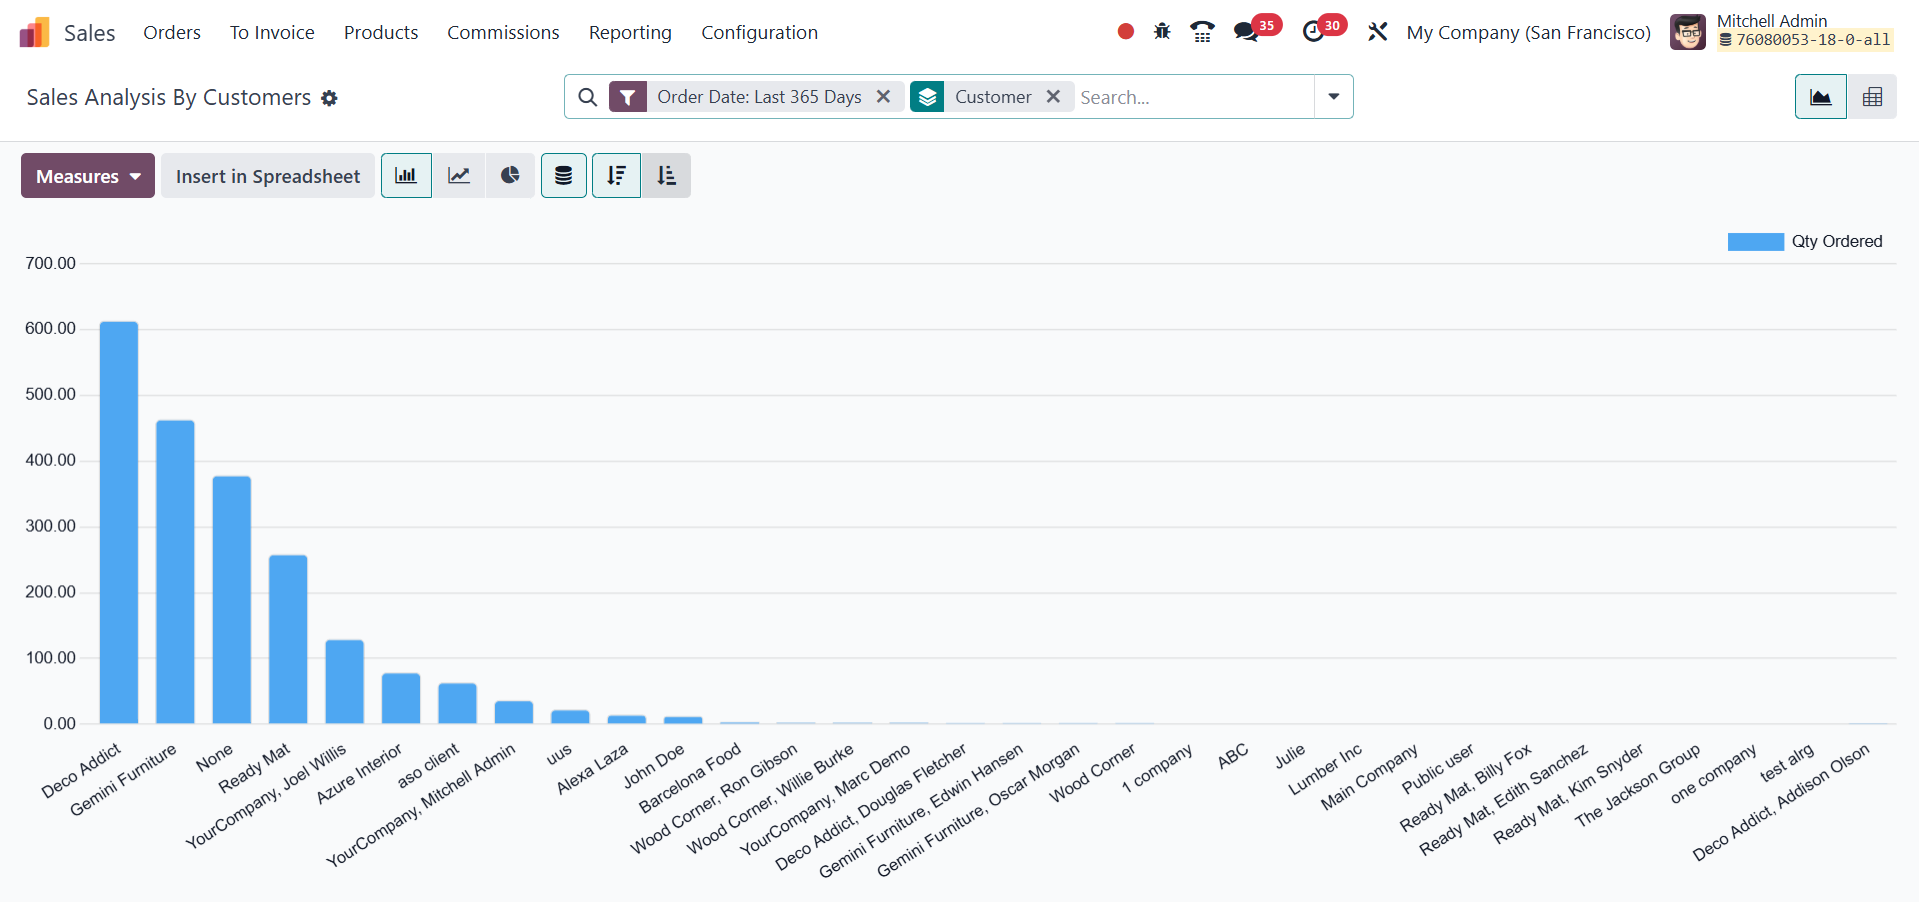
By accessing the Reporting tab and filtering sales data by customer,
businesses can assess key accounts and identify sales trends.
Reports can be further customized using filters and group-by
options.
- Graphical view: Offers bar charts, line charts, and pie charts
to visualize customer-based sales performance.
- Pivot view: Displays tabular sales data with key metrics like
total sales, quantity sold, and revenue.
Customer-specific sales analysis helps businesses identify loyal
customers, assess profitability, and design personalized marketing
strategies to boost retention. It also highlights underperforming
customer segments, allowing businesses to adjust their sales
approach for improved outcomes.
23.5 Commissions
In Odoo 18 Sales, Commissions Reporting provides valuable insights
into the performance of sales teams and individual salespersons by
offering clear and organized data on earned commissions. These
reports help businesses analyze the effectiveness of commission
plans, monitor target achievements, and evaluate the return on
incentive strategies.
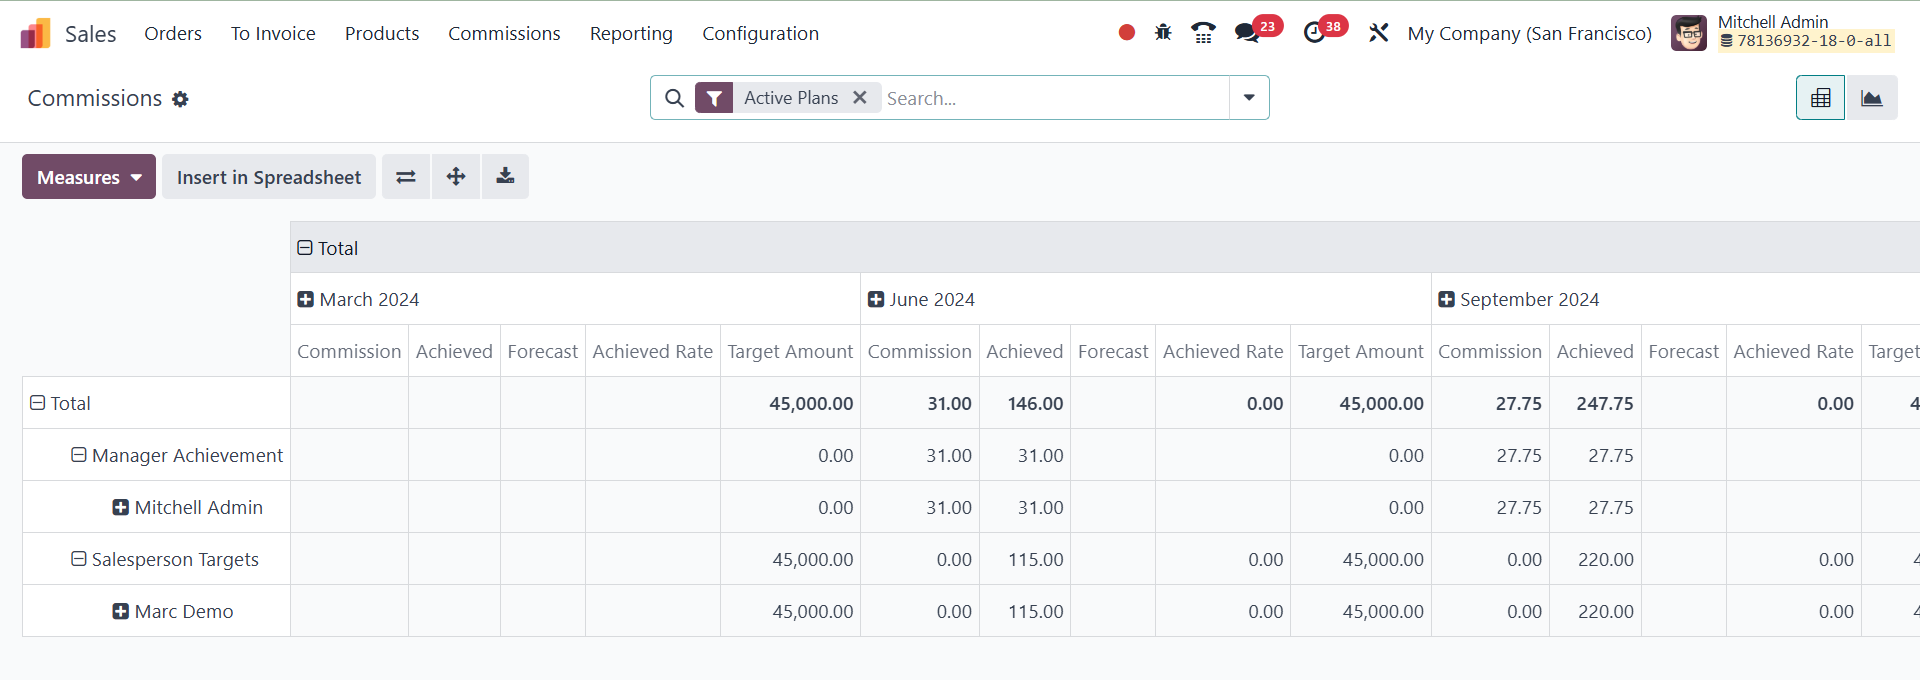
Users can access commission-related data through various views such
as pivot, and graph, allowing for flexible analysis based on
parameters like commission plan, salesperson, date range, target
percentage, and achievement rate. The pivot view, in particular,
enables users to group and filter data dynamically to generate
customized summaries, while the graph view offers a visual
representation of commission trends over time. These reporting tools
empower managers to make informed decisions, refine commission
structures, and drive better performance across the sales
department.
Overall, the Sales Reporting tools in Odoo 18 provide businesses with
comprehensive, data-driven insights that help optimize sales
strategies, improve performance tracking, and drive growth.