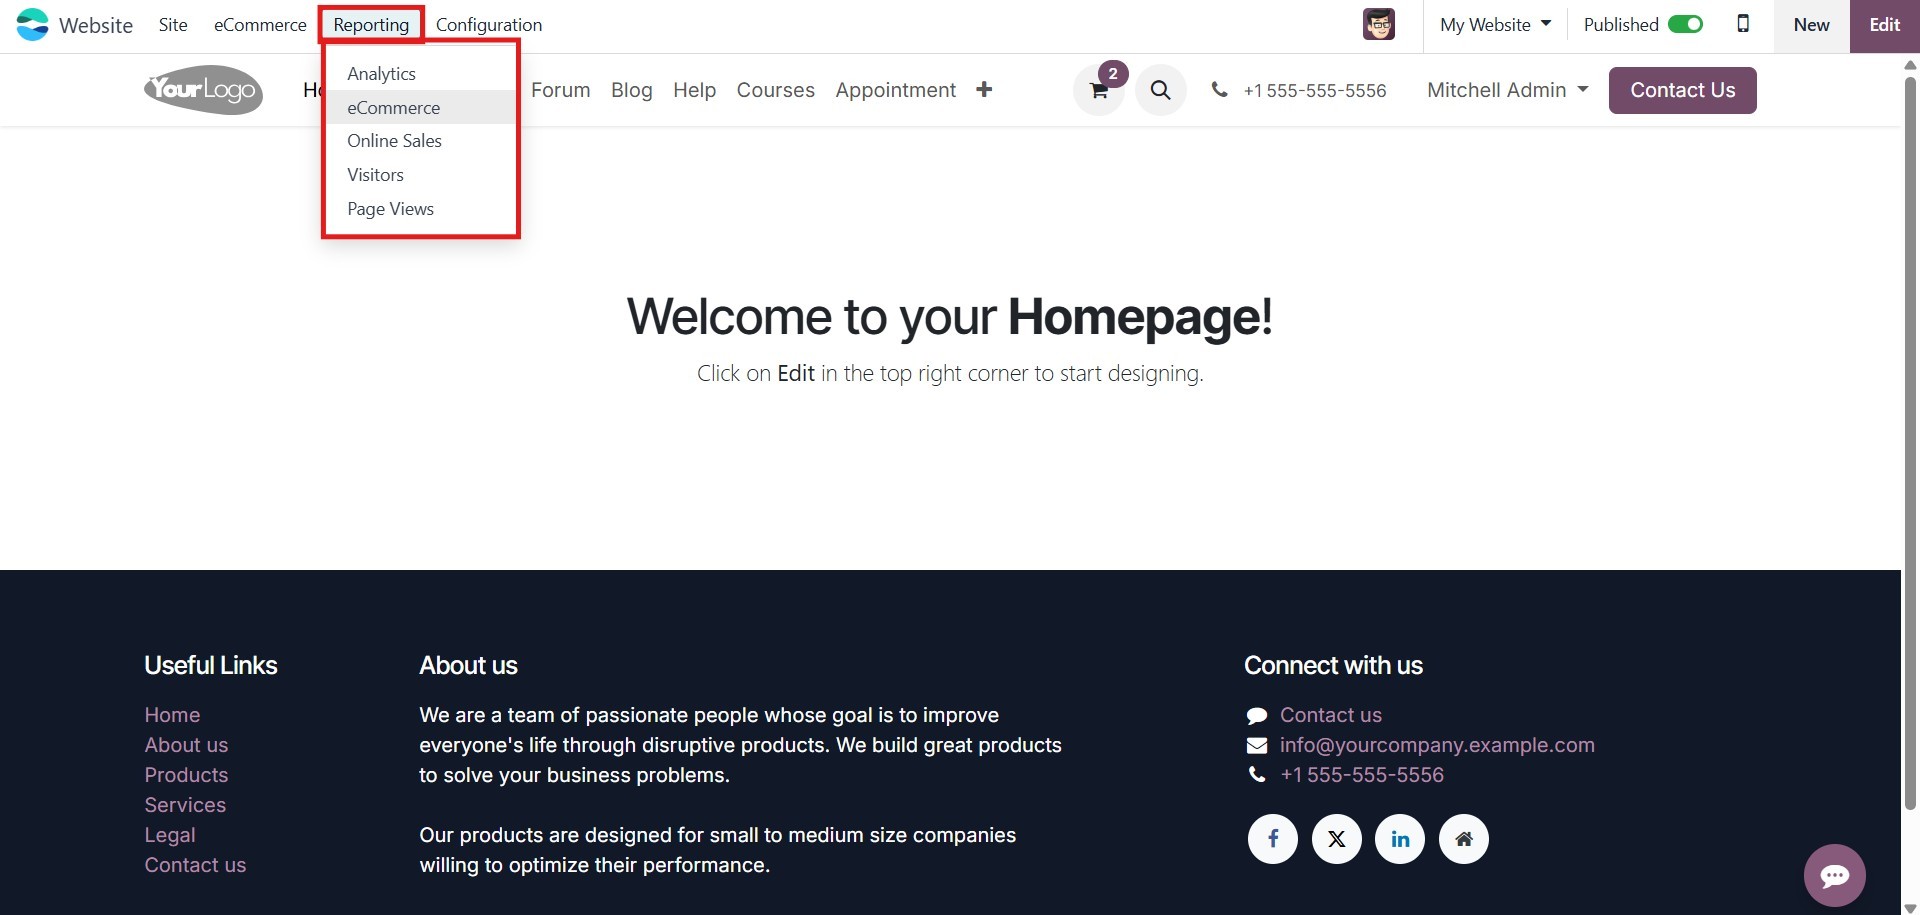
7. Reporting
In the Reports section of the Website module, you can analyze your
online sales data. By navigating to the Reports tab, you can access
insights on Analytics, eCommerce, Online Sales, Visitors, and Page
Views, helping you track and optimize website performance.
7.1 Analytics
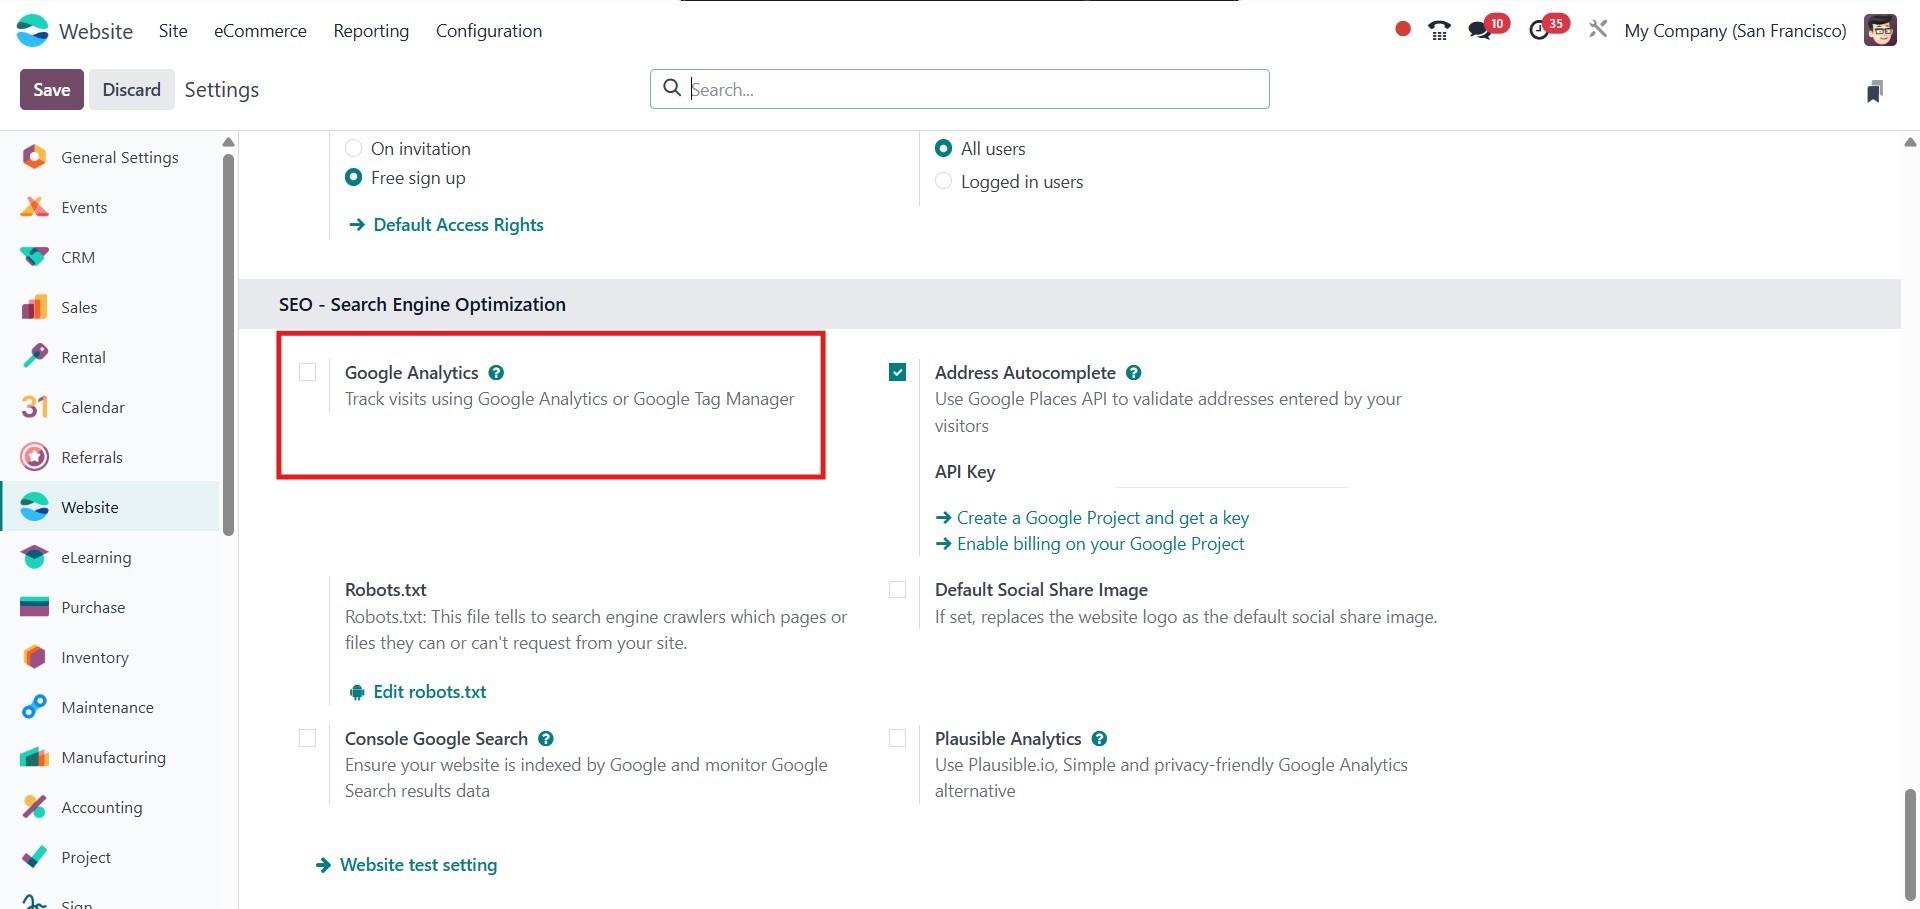
The Google Analytics feature, supported by the Website and eCommerce
modules in Odoo 18, is a powerful tool for tracking and analyzing
website traffic. This integration allows you to monitor visitor
count, session duration, and other key metrics to gain valuable
insights into user behavior.
You must first register for a Google Analytics account and get the
required login information in order to use this function. It's easy
to integrate Google Analytics with the Odoo Website module; just
turn it on in the Settings menu to get going.
This feature enables you to track, view, and analyze website visitor
data directly from the module's Reporting tab. All relevant insights
gathered from the business’s Google Analytics integration will be
displayed in the Analytical Report window, providing a comprehensive
overview of visitor activity.
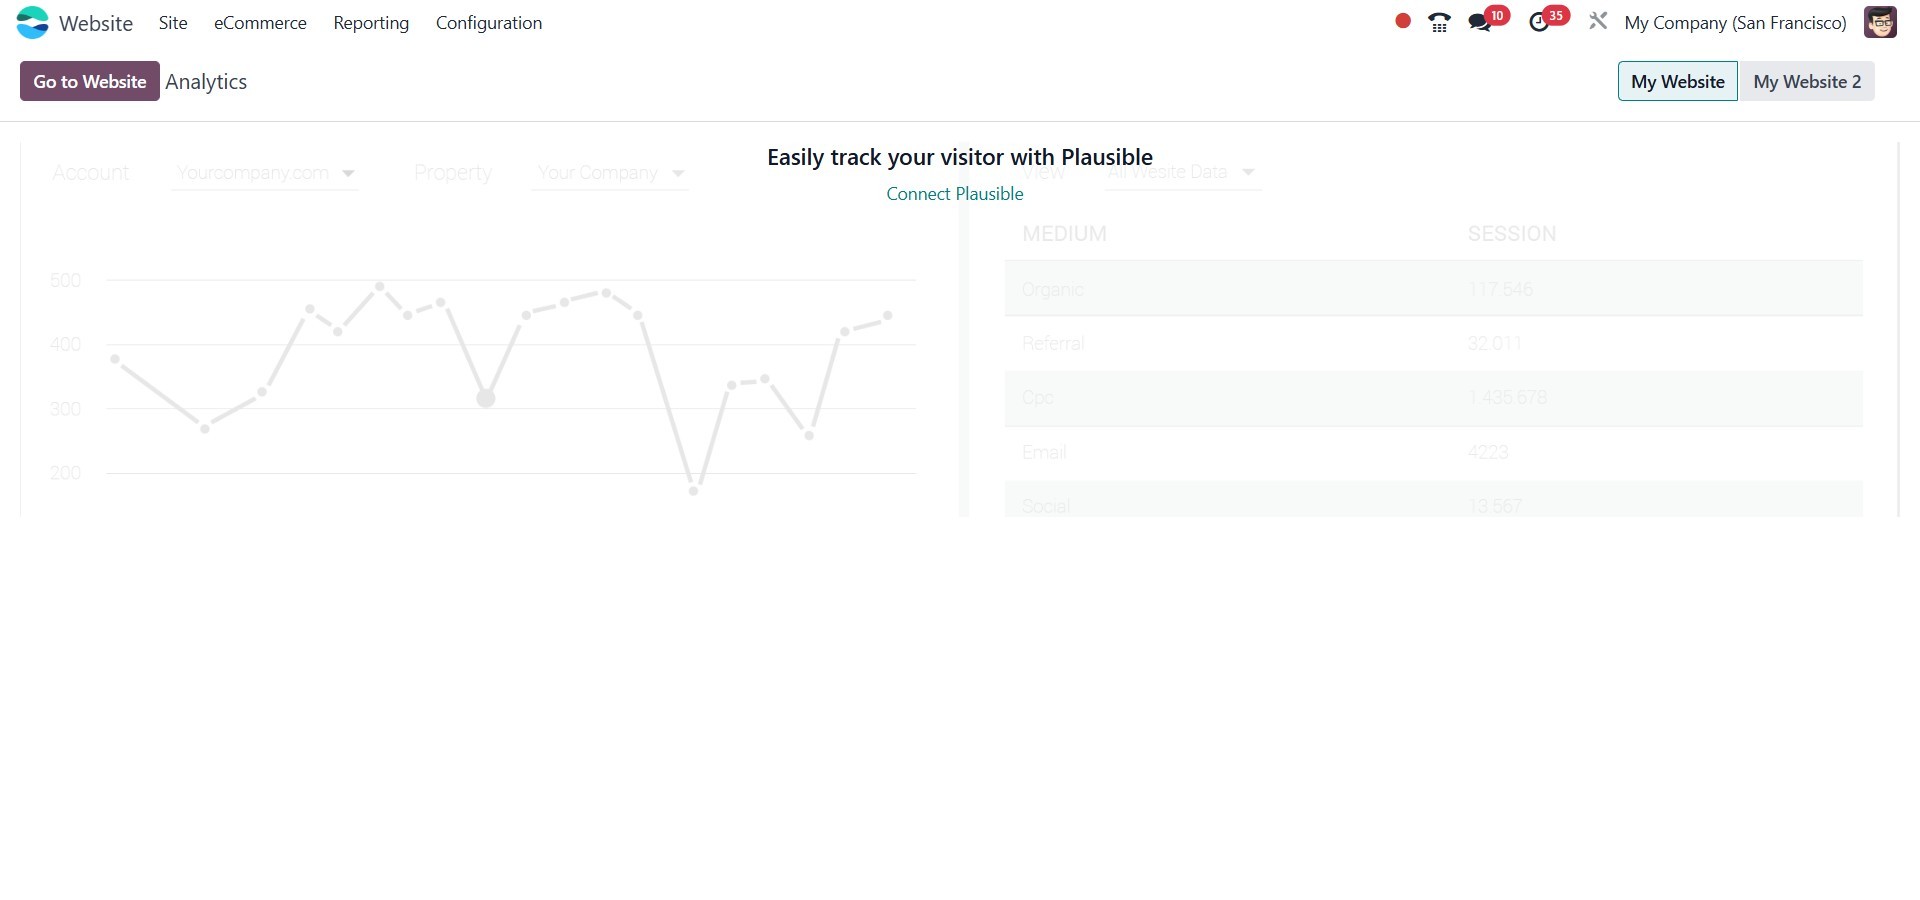
You also have the option to integrate Google Analytics from this
section. As shown in the image above, click the Connect to Plausible
button to proceed.
All website activity data, including annual, monthly, and weekly
reports, will be efficiently displayed in the Google Analytics
Report window.
7.2 eCommerce
The eCommerce Dashboard window will open when you choose the Report
option in the Website module. This dashboard provides an overview of
your web store’s activities and performance, as shown below.
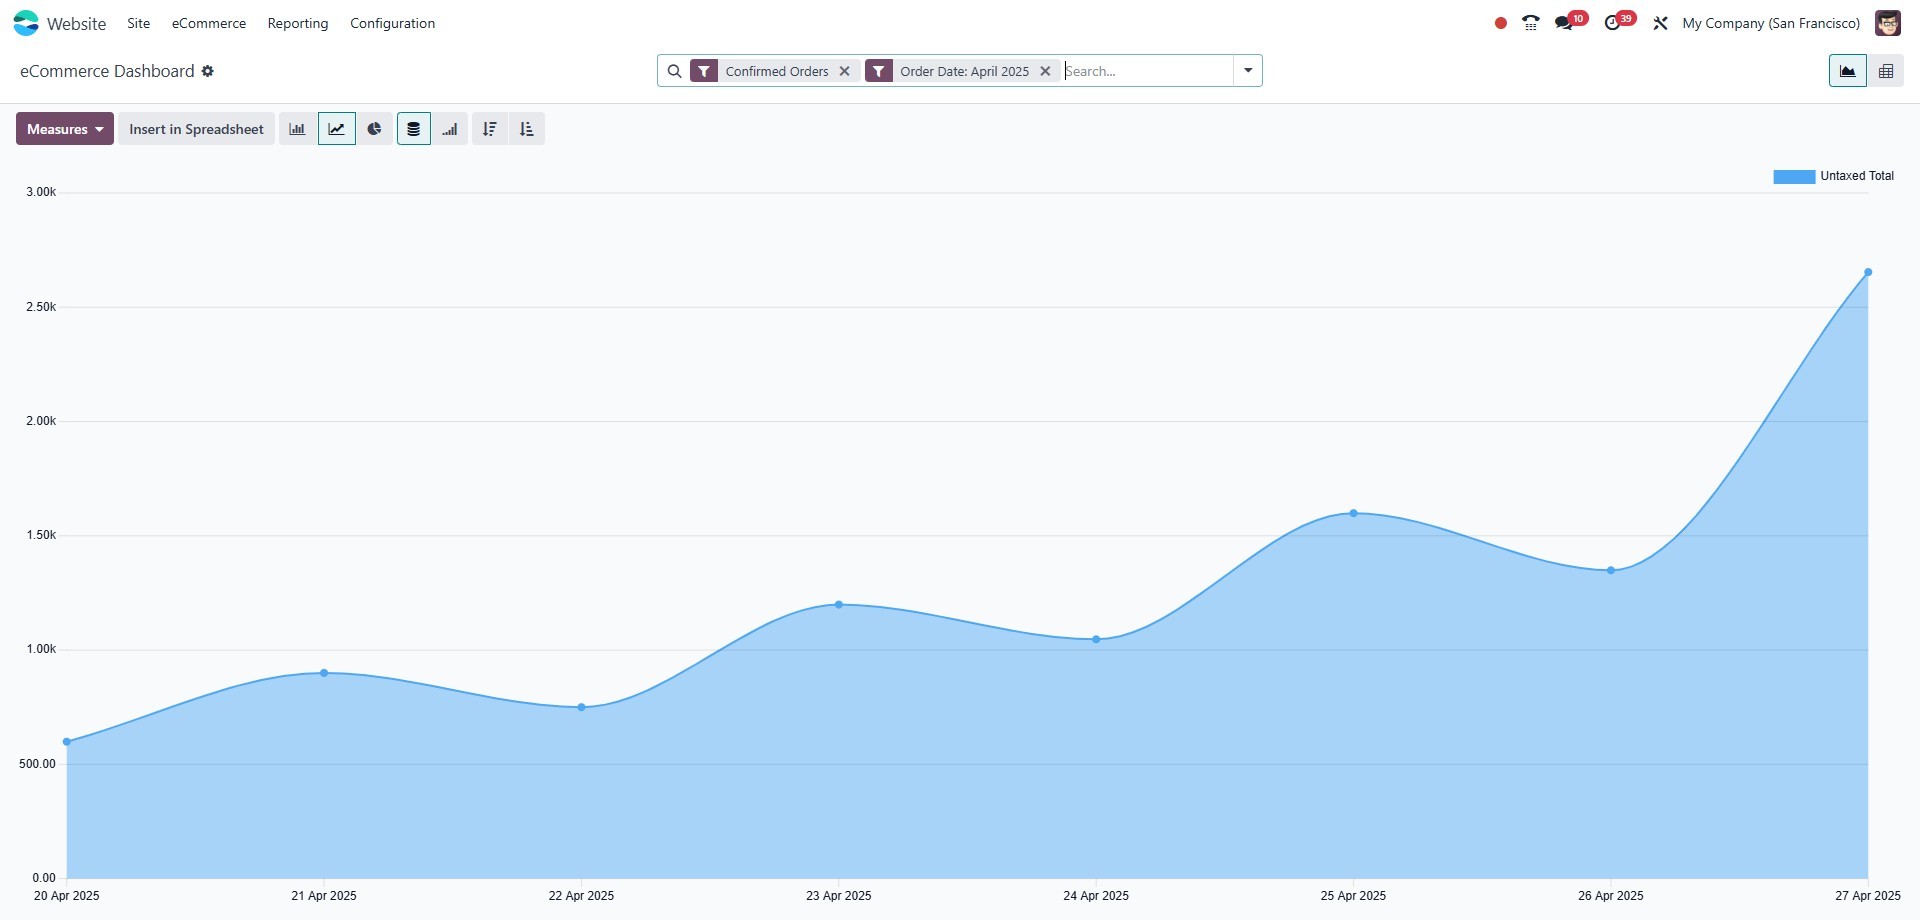
Through the use of numerous charts, graphs, pivot tables, and
aggregated data, this dashboard view offers thorough insight into
the performance of your e-commerce store. It serves as a powerful
reporting tool, enabling the visualization of both quantitative and
qualitative insights related to the promotion and sale of products
and services through your online platform.
Compared to traditional descriptive reports, graphical
representations such as charts and graphs make data interpretation
easier. This dashboard allows you to track sales growth and access
all reports related to your e-commerce business. Additionally, you
can generate sales reports on a daily, weekly, monthly, or annual
basis, providing a clear overview of your website’s sales
activities.
7.3 Visitors
In the Website module, the Visitors option can be found under the
Reporting section. This menu provides comprehensive data on all
website visitors, ensuring no information is missed.
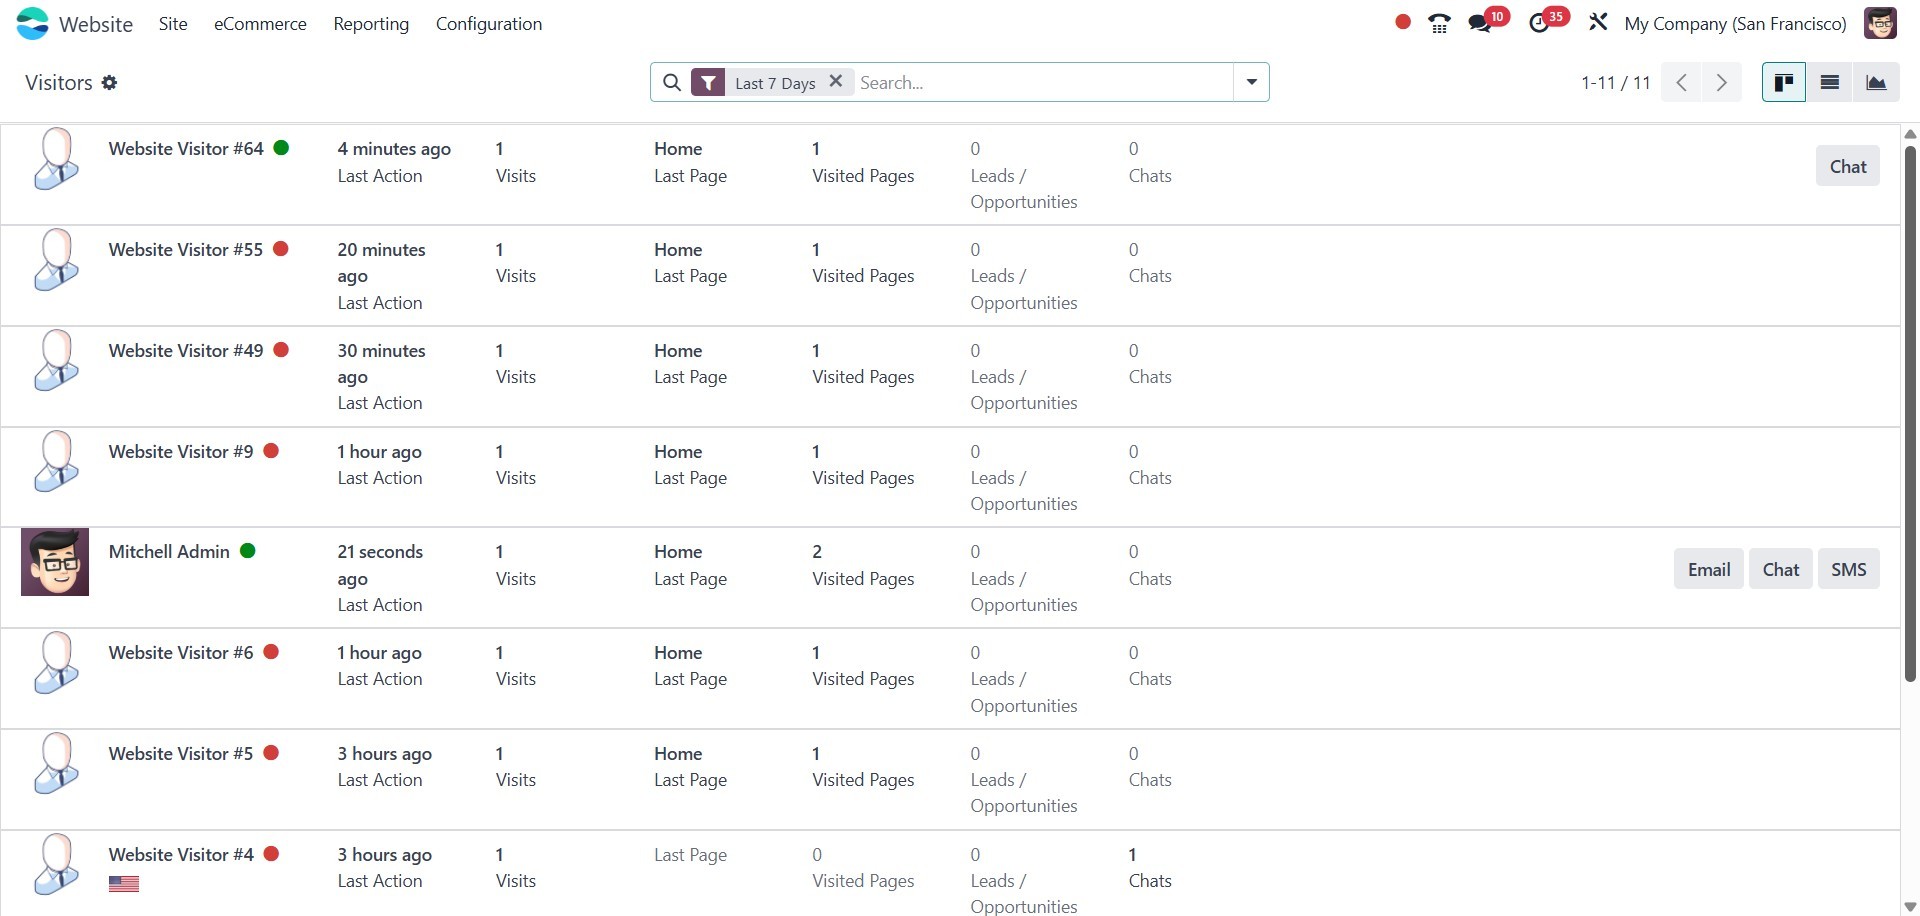
If the visitor's contact information is already stored in your
system, their name will appear in the Visitors pane. Otherwise, they
will be identified as a website visitor. This window provides a
clear overview of key details, including the number of visits, the
last page viewed, the leads or opportunities generated by the
visitor, and the option to initiate a chat.
Additionally, if the visitor's contact details are available, the
platform enables communication via Email and SMS. To send a message,
simply click the SMS, Email, or Chat button next to the visitor's
information.
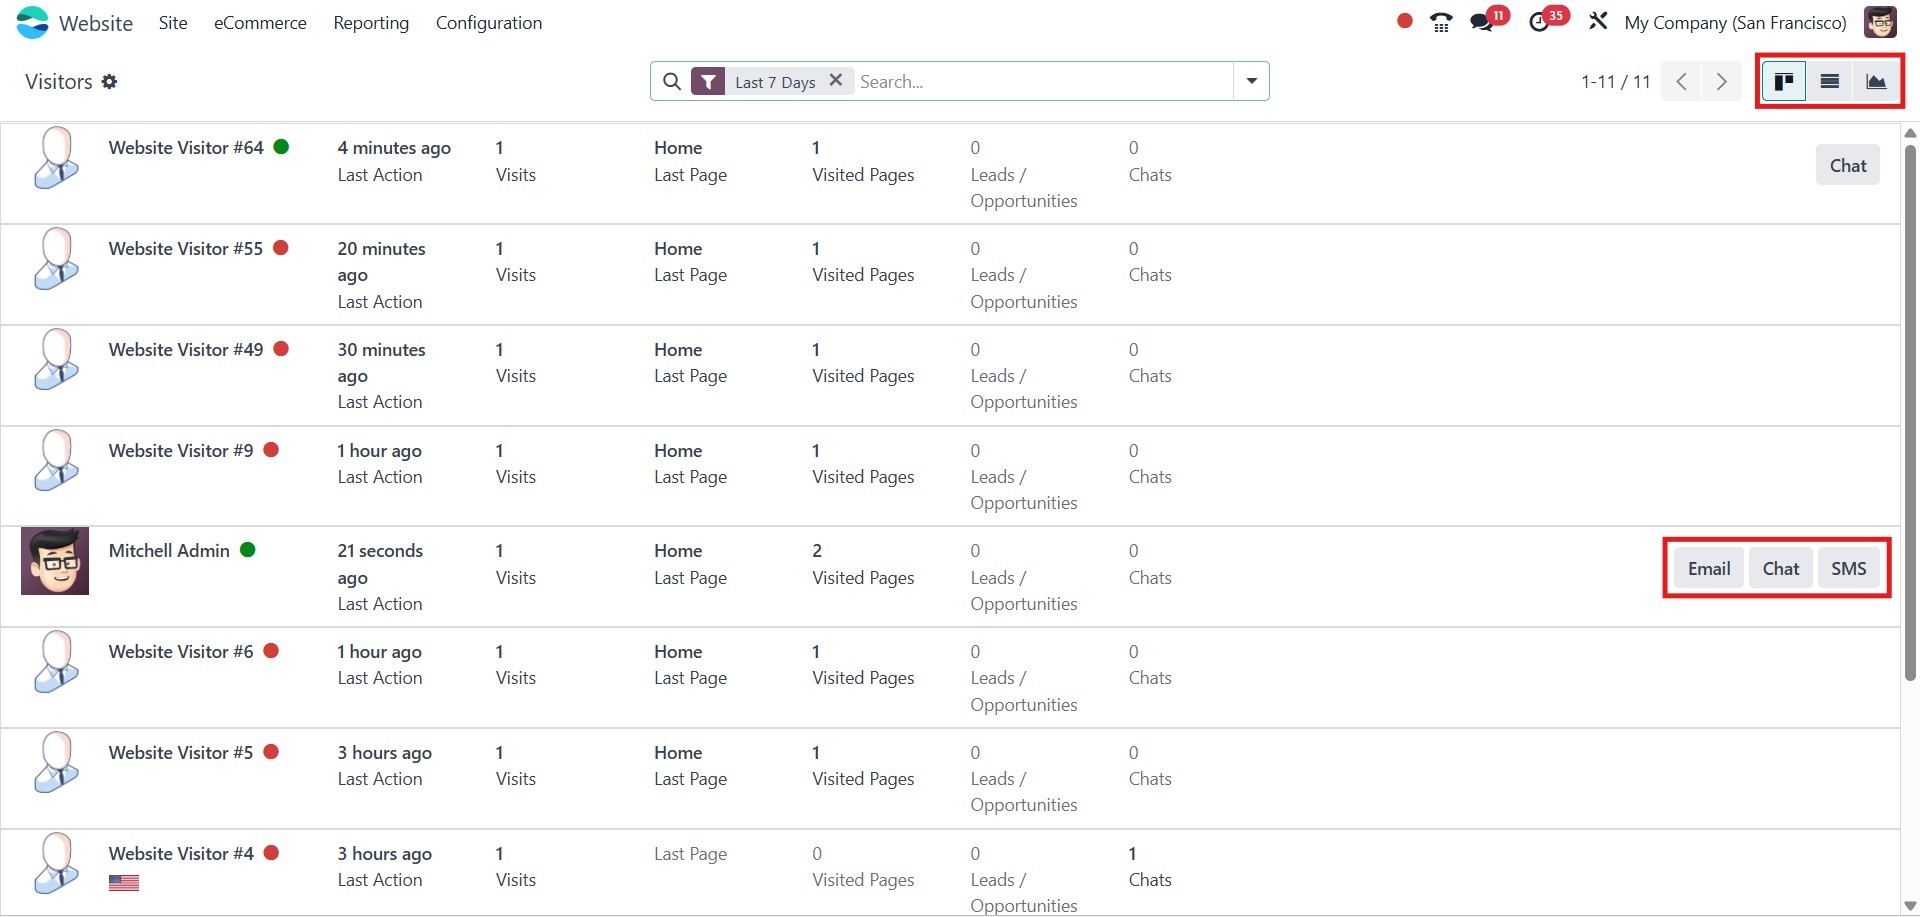
The system allows you to view details in List and Graph views in
addition to the Kanban view. The menu icons for changing views are
situated in the window's upper left corner, as seen in the
screenshot above.
You also have access to various configurable and default filters, as
well as categorization options, under the Filters and Group By
menus. The default filters are Last 7 Days, Unregistered, Leads,
Contacts, Connected, Available, In Conversation, Push Notification
On/Off, and Archived.
Under the Group By tab, standard categorization options such as
Country, Time Zone, Language, Visits, Website, First Connection, and
Last Connection are available.
Now, let’s explore the Page Views menu while navigating through the
Visitors menu under the Reports tab.
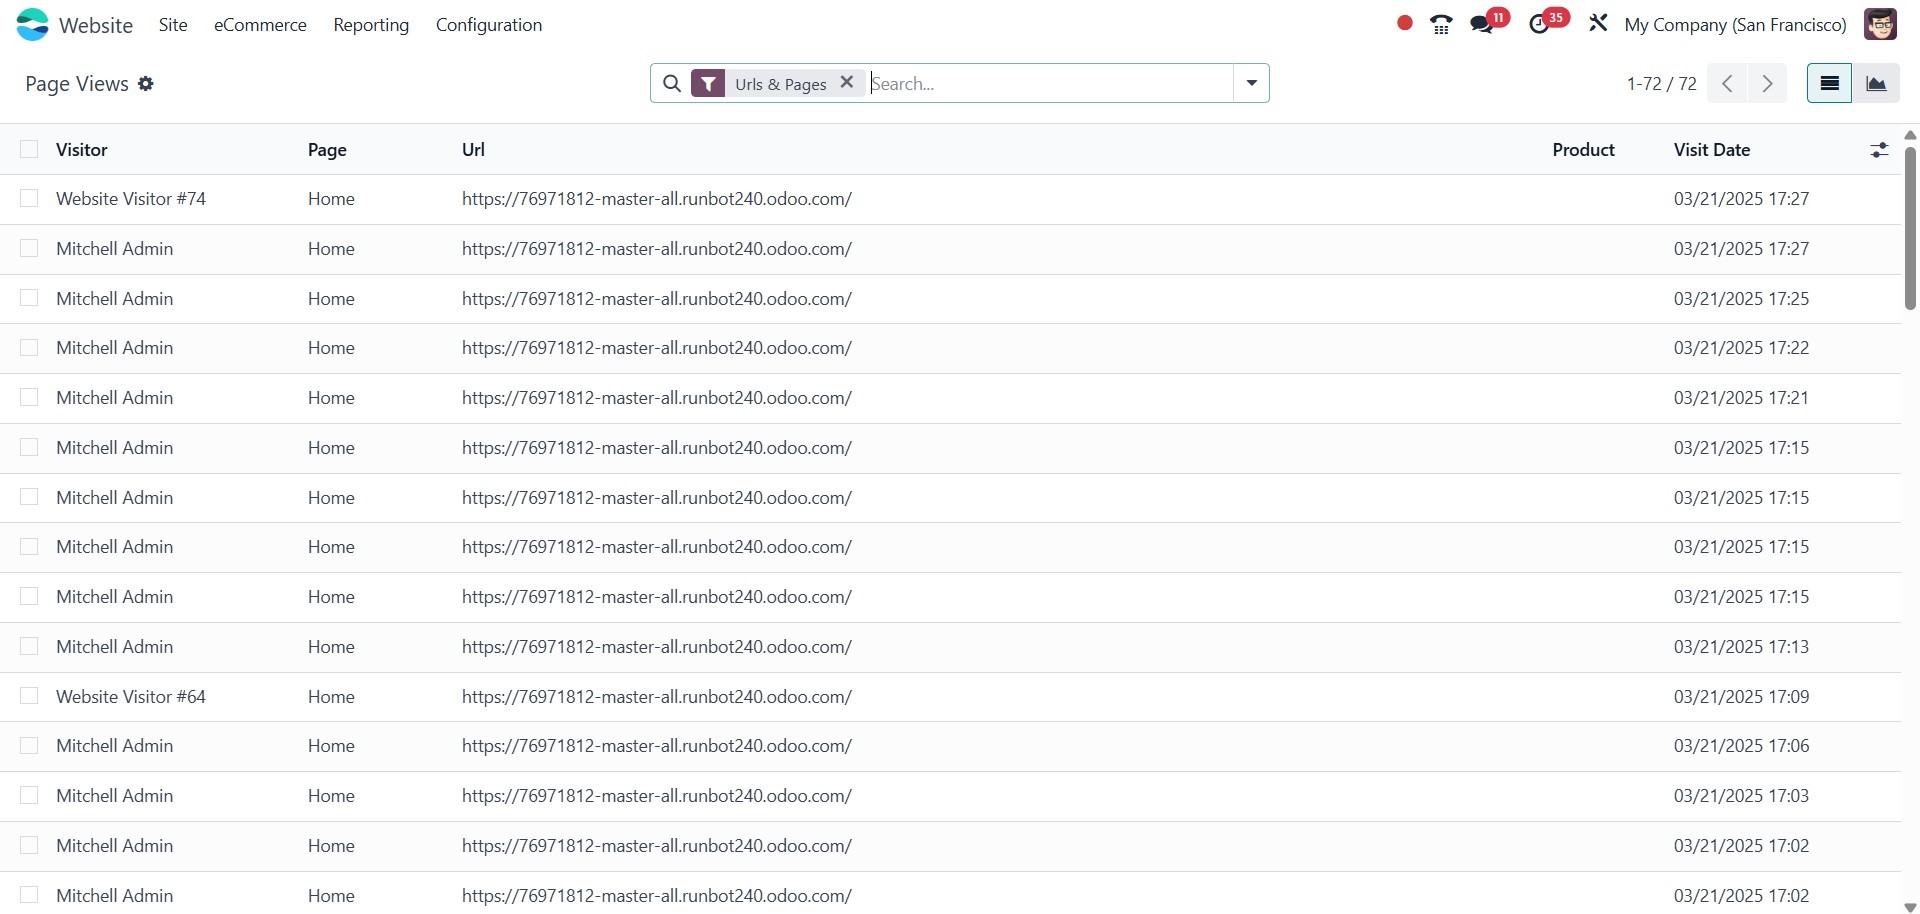
Page Views
The Page Views option in the Reporting tab lets you track all of your
website's page views. This window provides information about the
visitor, the page, the URL, and the visit date. The data can be seen
in either list or graph format. The following image depicts the List
view of the Page Views window.
You can also apply various filters and grouping options to sort and
categorize data based on multiple criteria. The default filters
available include Pages, URL & Pages, and Products. Additionally,
you can organize the data using different categories, such as
Visitor, Page, URL, Product, and Visit Date, to streamline data
management.