Management-Based Reporting
One of the most important aspects of running a business is managing its finances, and managers are constantly looking for ways to improve and streamline the process. As a management tool, the reporting and report generating tools will be used to assess the state of your company's accounting processes. Additionally, by looking at the accounting-based data, you may quickly ascertain how the company's financial operations are performing due to the reports' real-time nature.
In addition to generating reports for operations and company management, Odoo is an advanced management solution that provides a range of reporting possibilities. There is a money management module that provides a variety of reporting and operating features. Financial operations and accounting management components, including invoice analysis, analytical reports, unrealised currency gains or losses, depreciation schedules, deferred expense, deferred revenue, disallowed expenses, loan analysis, budget reports, and product margins, are all included in Odoo's accounting management module. In the sections that follow, we will discuss each of these report production components in further detail.
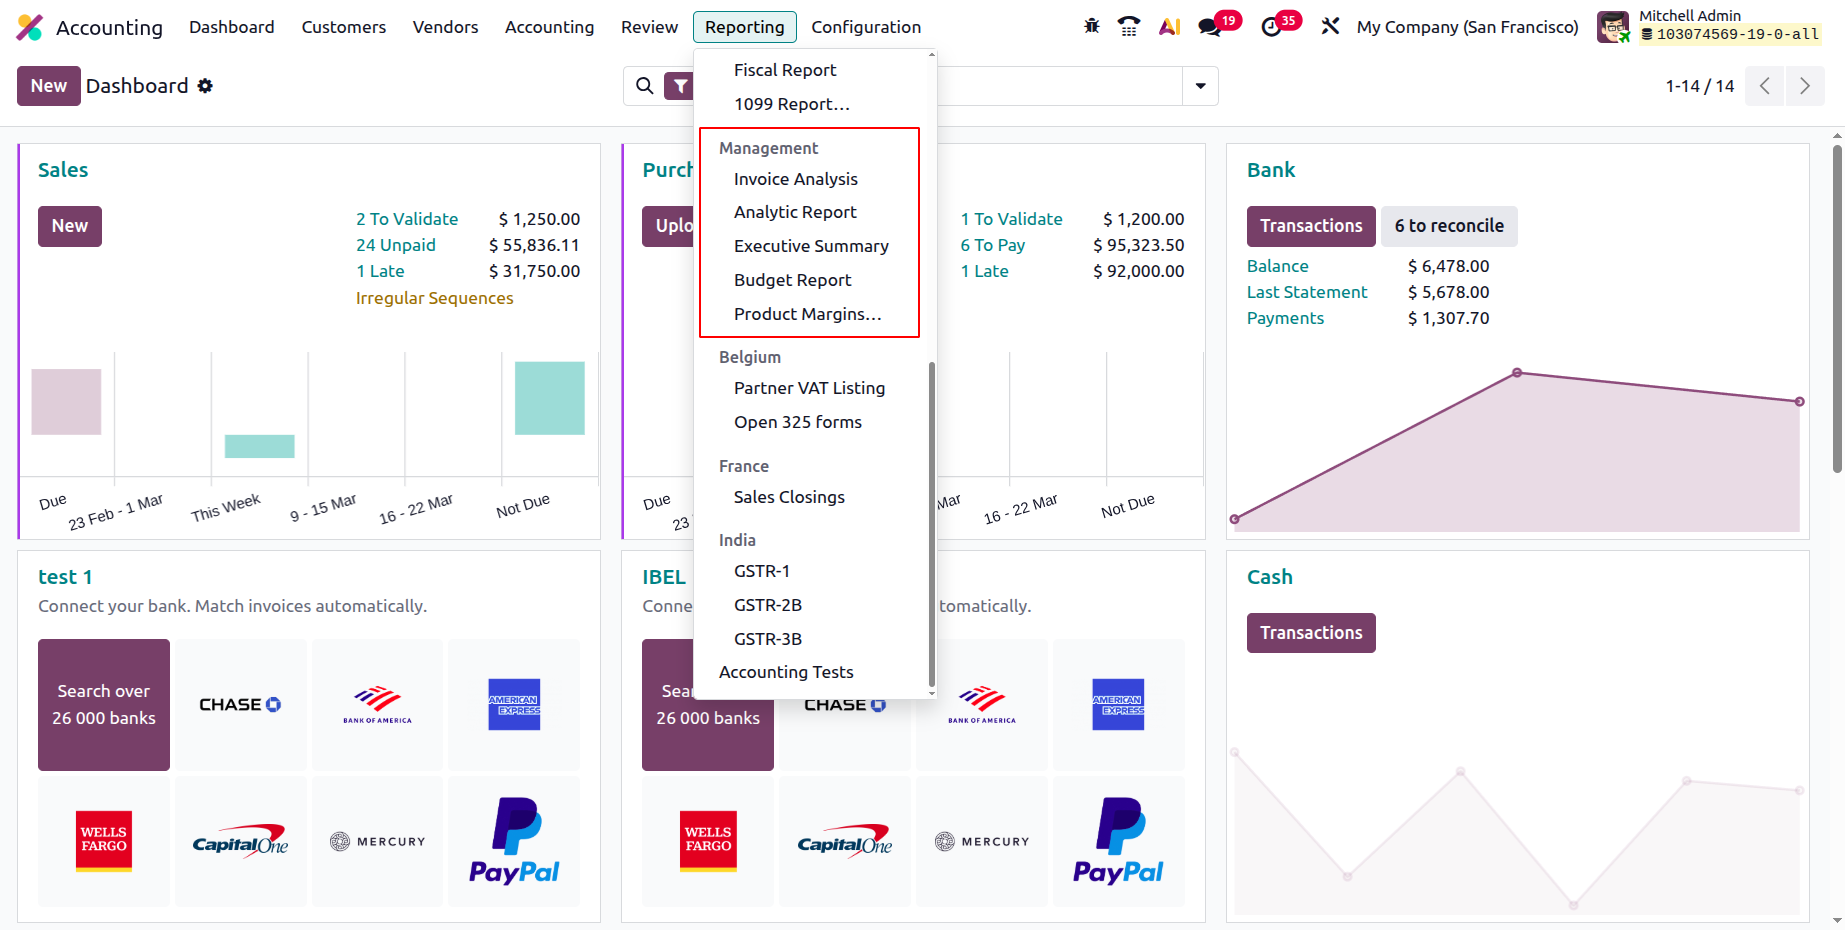
Invoice Analysis
The Invoice Analysis report is the most widely used accounting management report available in the Odoo Accounting module. This report will look at both finished invoices and those that are currently in the creation stage of operation. Invoice analysis reports will contain all invoices pertaining to customer-based activities in the sale of products and services. View invoice analysis reports using pie, bar, line, and other chart types. You can examine the invoice analysis report in a way that best suits your needs by utilising its filtering and grouping features.
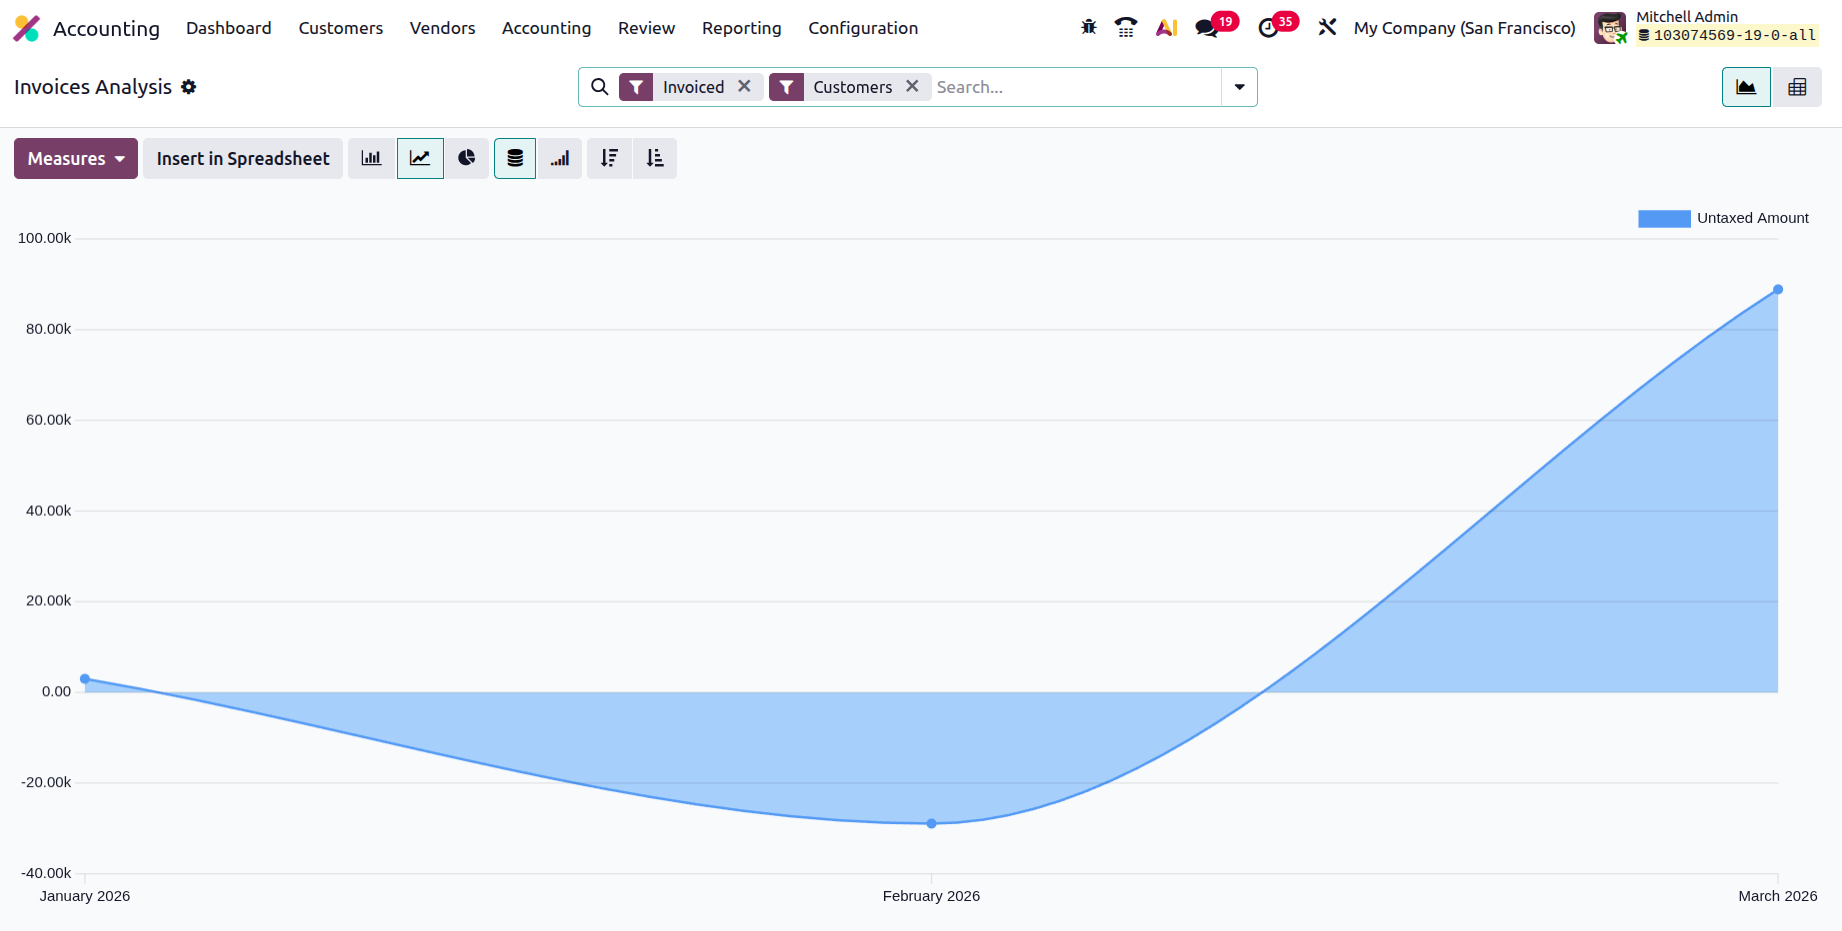
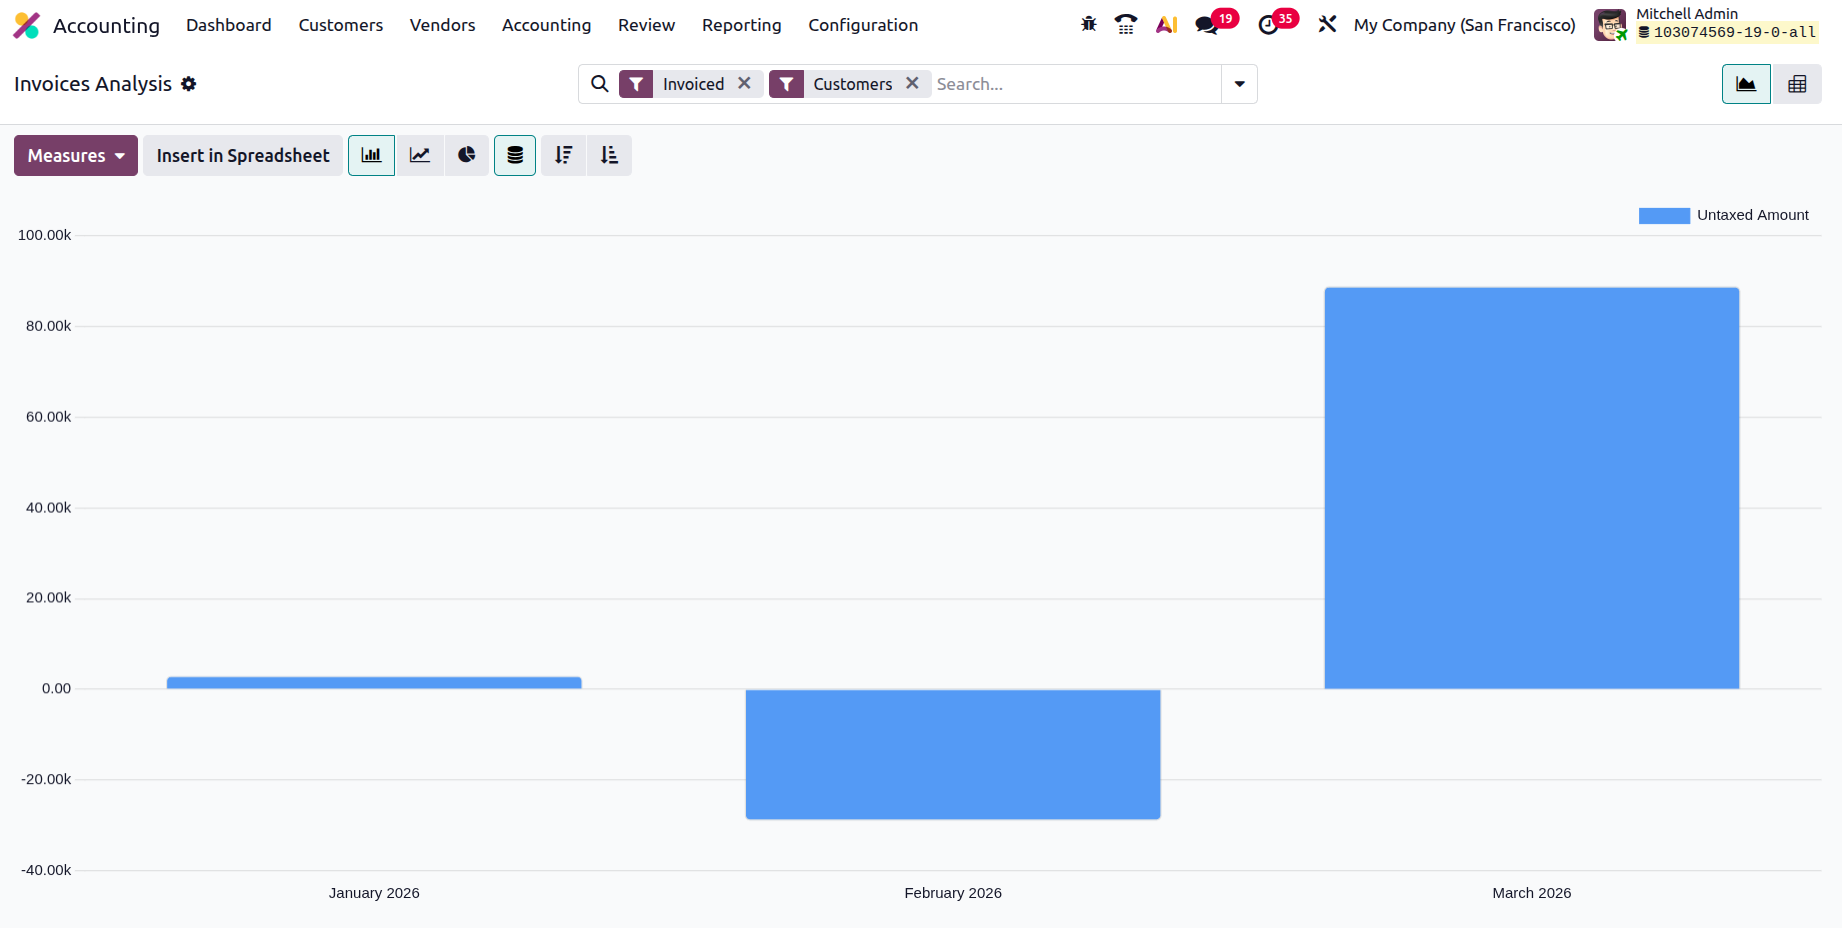
The invoice analysis report bar graphs, which are color-coordinated as necessary, are shown in the screenshot that follows. Organising the relevant data about the generated bills is made easier by filtering and grouping by options.
You can also create reports in a different method using the Kanban view, which is an alternative to the graph view. You can expand and depreciate the reporting capabilities with respect to the defined entries, in addition to filtering the report in a Kanban fashion that lets you show only the important + and - elements. Additionally, you can generate the report utilising both the default and bespoke parameters by using the Filtering and Group by options. The measures that were utilised to construct the Invoice Analysis reporting components can also be established using the Measures configuration options. This will assist you in defining the metrics that serve as the foundation for the measurements.
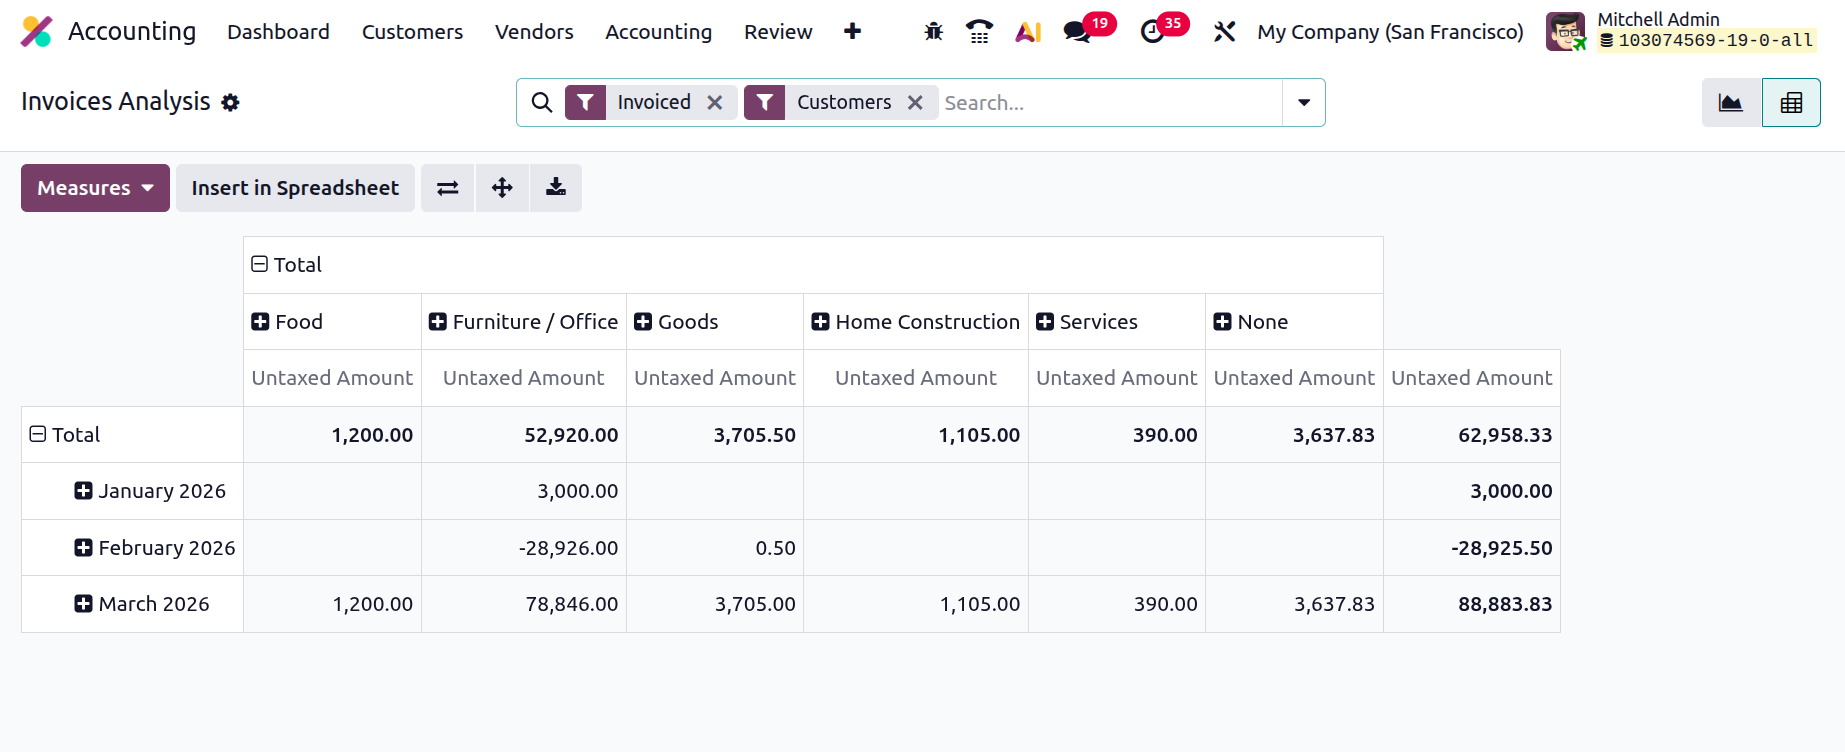
For the purpose of accounting management options for the company's operations, the Invoice Analysis reporting is an exception tool that has been designed with reference to both created and actively used invoices. Let's move on to the following section, which explains a menu for creating analytical reports, now that we have a better understanding of Odoo Accounting's invoice analysis reporting menu.
Analytic Report
The analytical reporting tool on the Odoo platform allows you to set analytical functions related to the organization's accounting components. The report also includes a quantitative summary of all the recognised components of the business's accounting. The accessible Odoo Analysis Report pane is shown in the screenshot. All of Odoo's accounting features are shown here, together with reference information for the financial operations, the partners engaged, and the remaining balance, as can be seen in the screenshot that follows.
Additionally, you may filter each of the defined analytical accounts using an analytical accounting filter and arrange the entries based on the fiscal and operational periods using an organizer by tool. The different settings pertaining to the analytical entries that must be filtered can also be changed using an advanced filtration tool.
You can observe all financial actions associated with the financial elements once you choose each entry in the analytical report, as shown in the image below. Here, we've chosen the Costs & Revenues menu option. The menu will specify the Date, Description, Analytical Account, and Amount of the operations.
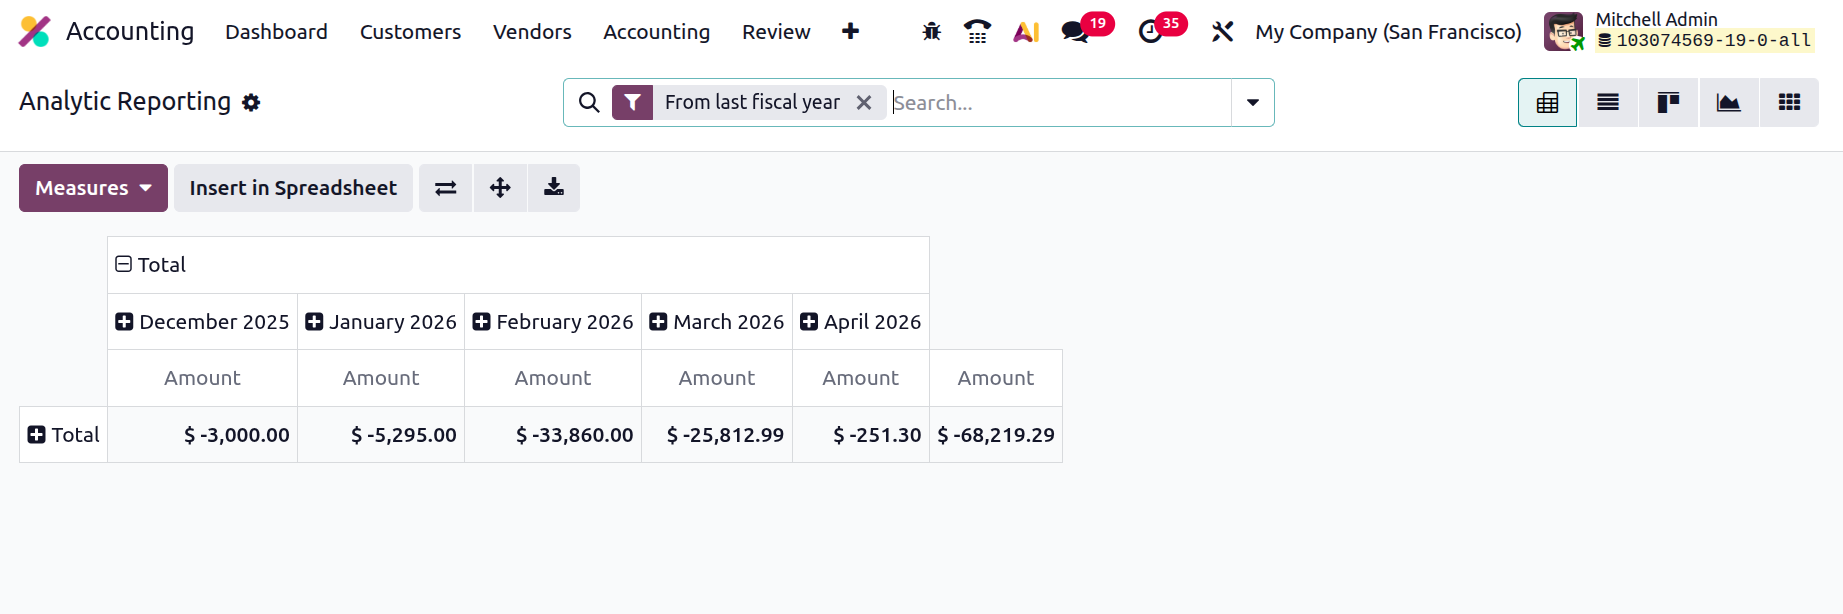
To assist in locating the relevant entry, several grouping and filtering methods are offered. By selecting the available Create option, you may also add new entries. By choosing the defined entry, an entry can also be changed.
You can read an entry's description, analytical account, assigned tags, reference details, partner name, and entry date by selecting it. The unit of measurement, the amount and quantity allocated to each product, and the degree of detail will all be described. Terms used in accounting, such as Journal Item and Financial Account, will be explained. By selecting the edit option, you may make any necessary modifications to the data that has been defined here. Because it gives you additional information about each action, the analytical report tool is an essential tool for managing the company's finances. Let's proceed to the part that discusses the reporting requirements for unrealised currency gains and losses in Odoo Accounting now that we understand how the analytical report operates.
Executive Summary
The Executive Summary of a company's accounting provides a thorough summary of the business's financial activities for the whole fiscal period. It also gives investors and executives a comprehensive picture of every detail of the company's financial activities. The Executive Summary will include a detailed description of the company's financial management and operational strategies.
The Odoo platform's Executive Summary reporting option is accessible through the Reporting page of the Odoo Accounting module, which shows a report on the business's operations as seen in the image below. This article will cover a wide range of aspects of the business, such as cash operations, profitability, balance sheet, profitability data, and much more. Furthermore, the structure and content of the Executive Summary can be divided into two categories: performance and position. The gross profit margin, which is the sum of all direct expenses incurred during a direct sale, will be used for performance-based components. The company's fixed overheads, which include rent, energy, other utility bills, taxes, and a number of other expenses related to a particular transaction, are added to the gross profit margin to determine the net profit margin. Additionally, the ratio of net profit to the quantity of assets utilised to generate the profit is known as return on investment.
The position-based language of the executive summary will also contain information on the company's financial resources, the status of the sale, and the firm overall. The average debtor days are the number of days it takes for your clients to make payments. The average number of days required to credit the outstanding balance for vendor invoices is provided by the Average Creditor Days. Another forecasting tool that shows how much money will enter and exit the accounts is the short-term cash prediction. Furthermore, the current assets to liabilities ratio contrasts current assets with liabilities that could be settled in less than a year. Each of these divisions' financial operations components and the capital spent in them will also be discussed.
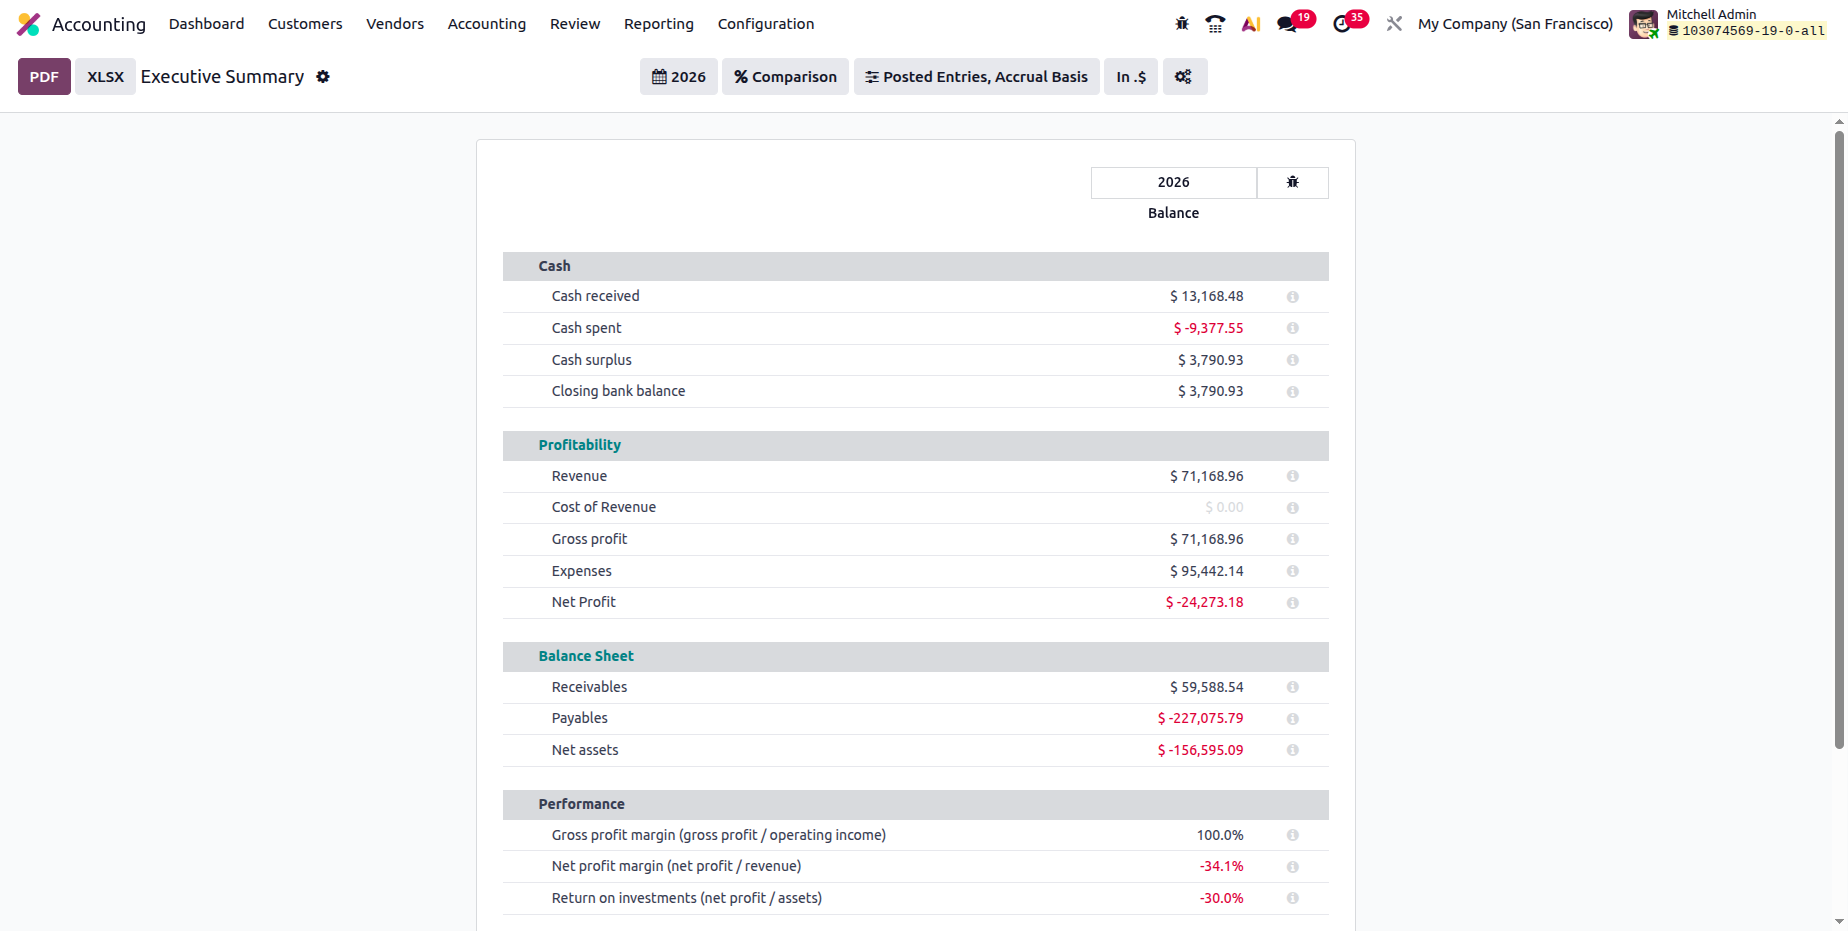
Filtering and grouping tools are offered to assist in organising the defined Executive Summary items. It will be possible to group entries based on uploaded entries and operating fiscal seasons. Additionally, as shown in the image below, you can compare the Executive Summary statistics of the company's financial performance from one fiscal period to another using the Comparison choices. The Previous Period and the Same Period Last Year are two of the basic comparison options. Additionally, the Custom Comparison options might be developed depending on the situation.
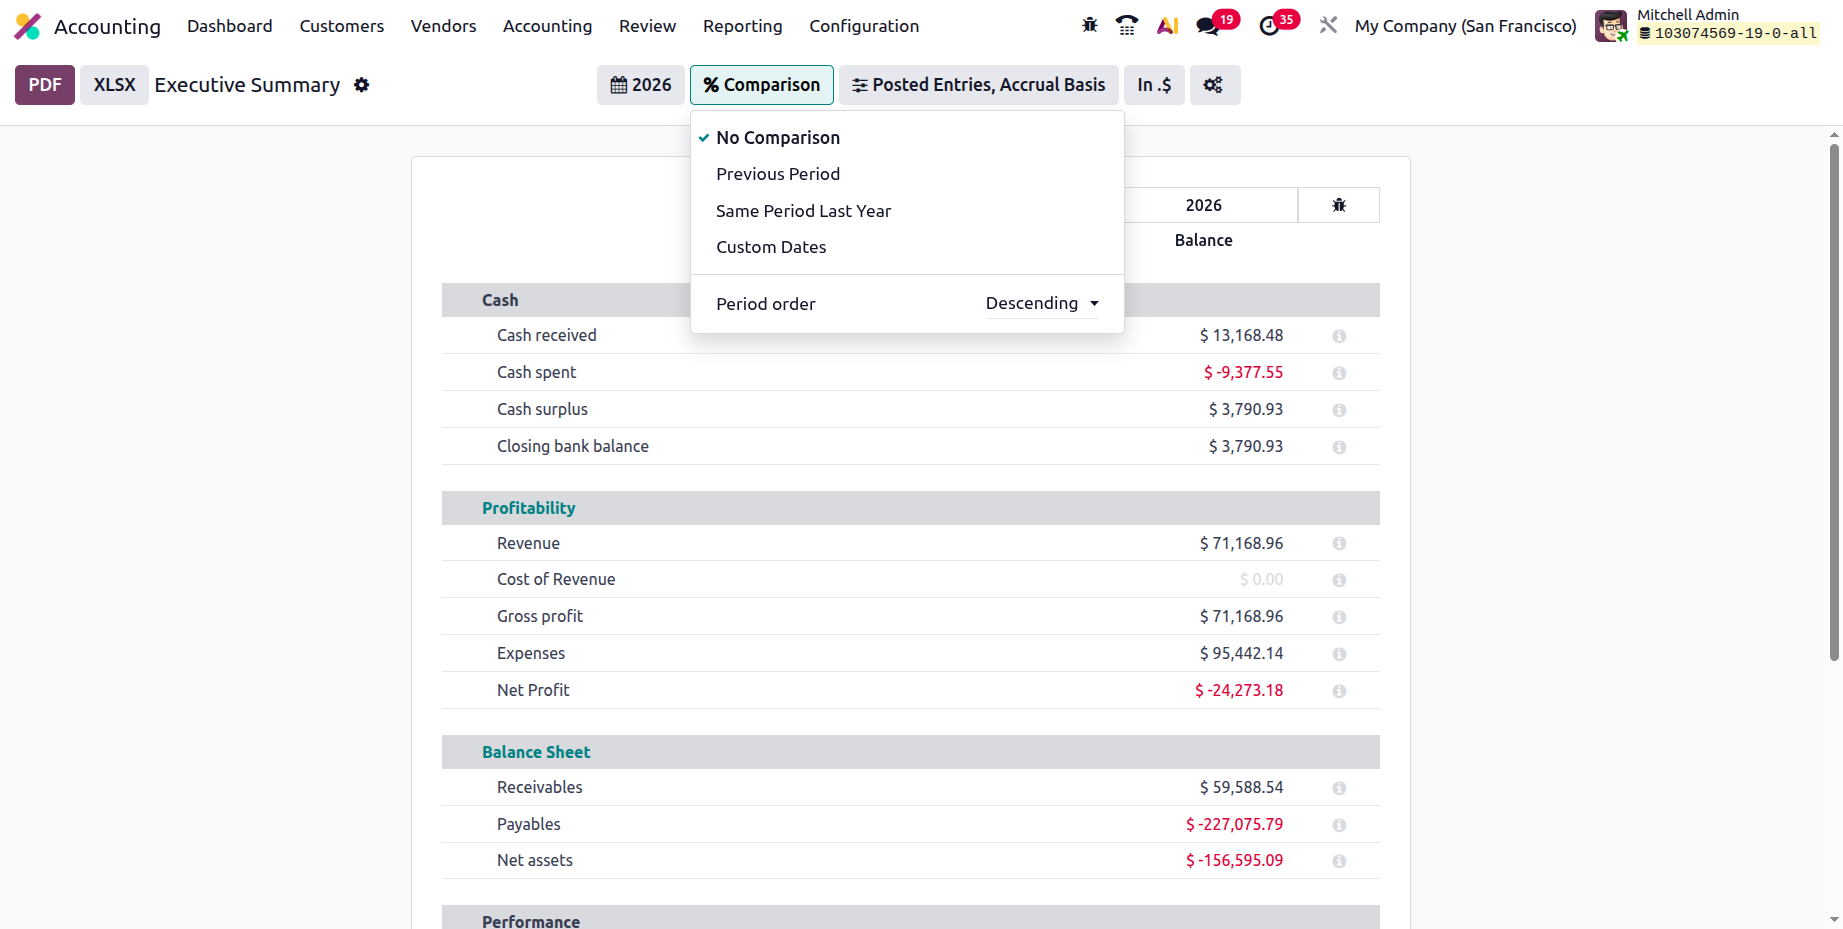
The Executive Summary can be utilised as study material to comprehend the company's past and current operations and offers a thorough overview of its financial operations. Managers will be able to make the best choices thanks to this. Let's move on to the next section, which will cover the tax reports, after talking about the Odoo platform's Executive Summary reporting option.
Budget Report
The main source of data used to plan a company's financial operations for a specific fiscal term or period is its budget. The fiscal department of a corporation will develop one budget in addition to multiple others, depending on the operational and functional needs of the business. The comprehensive Budget Analysis reporting menu located in the Accounting module of the Odoo platform allows you to modify the reporting elements of the different budgets. The Budget Analysis Report, available via the Accounting module's reporting page, provides a comprehensive picture of the business's budgetary operations.
All Odoo platform menus have filtering and grouping features that allow the Budget Analysis report entries to be configured according to demands.
These grouping and filtering possibilities are typical, and the noble tools can create more. These specific ones can be stored as favourites and subsequently used as filters in the Depreciation Schedule reporting tools. All budgeted operations from previous fiscal quarters and those underway will be detailed in the report. These sections can easily be expanded to include the various budgetary components.
The financial position and analytical account will be established along with the Start Date, End Date, Planned Amount, Practical Amount, Theoretical Amount, and Achievement Percentage.
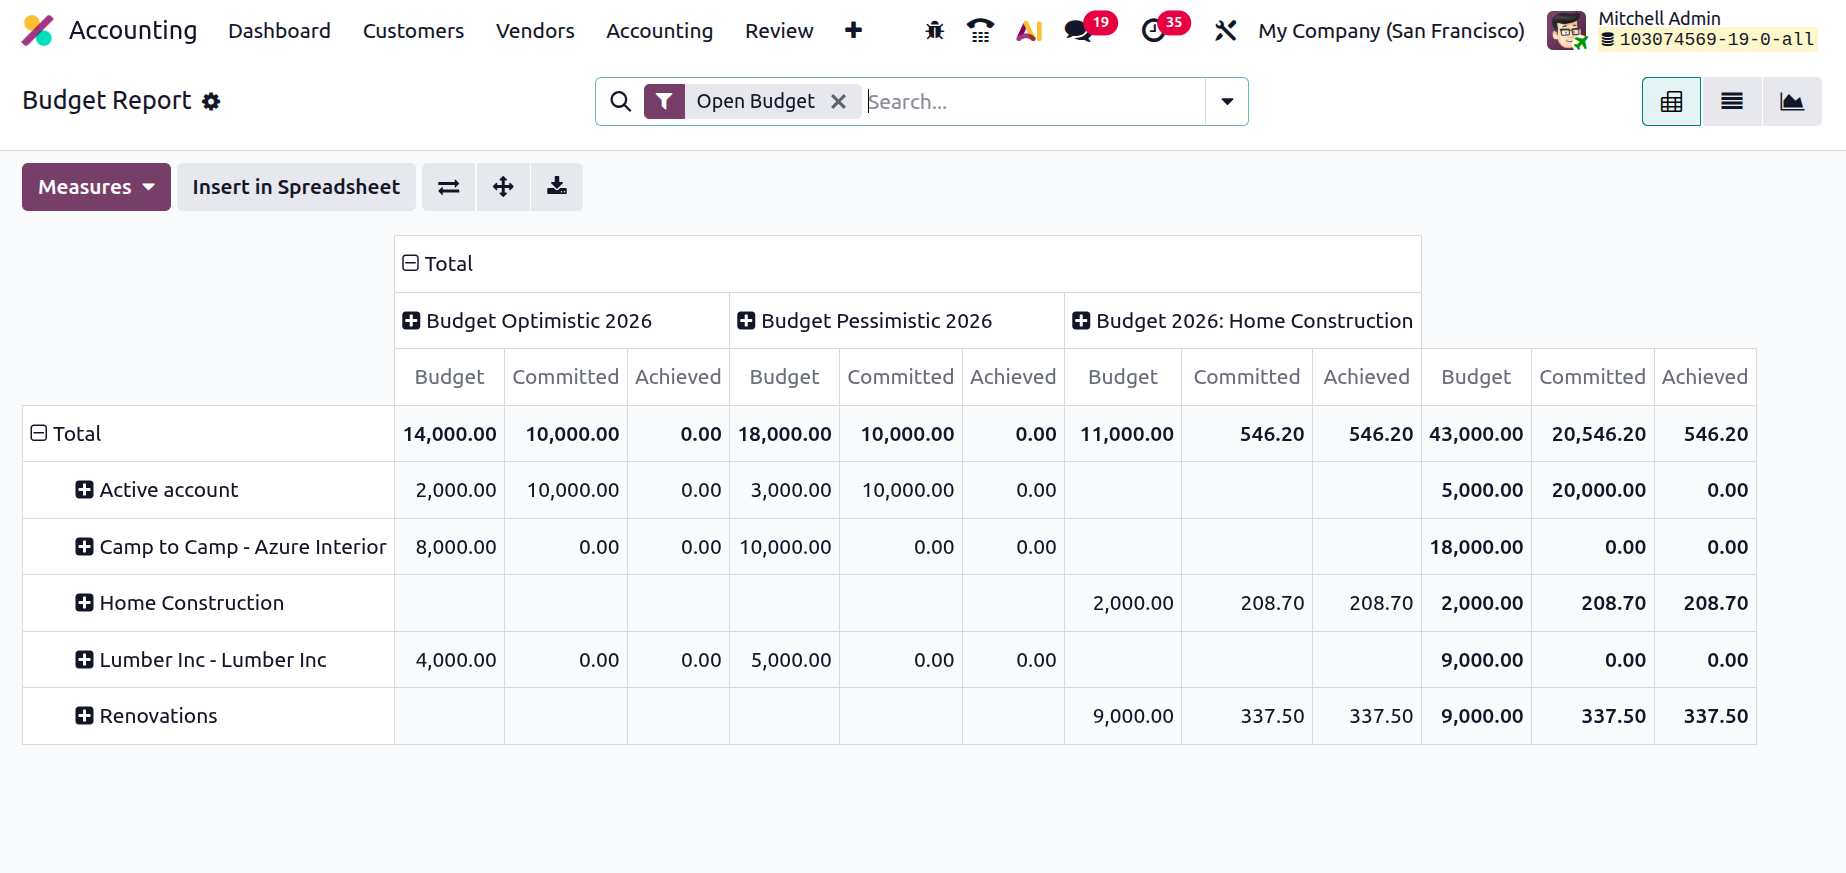
The budget analysis report can be seen in List, Pivot, or Chart views by selecting it from the menu on the right. The Budget Analysis report's list view was displayed in the earlier images. The Pivot View of the Budget Analysis report is displayed in the screenshot above. You can define the measures for the elements that have been generated for the various attributes of the entries that need to be sorted out using the pivot view. Using the + and - signals, you can add the default Measures that are defined in both report axes. You can use this feature to generate and disseminate reports depending on the operational components of the budget.
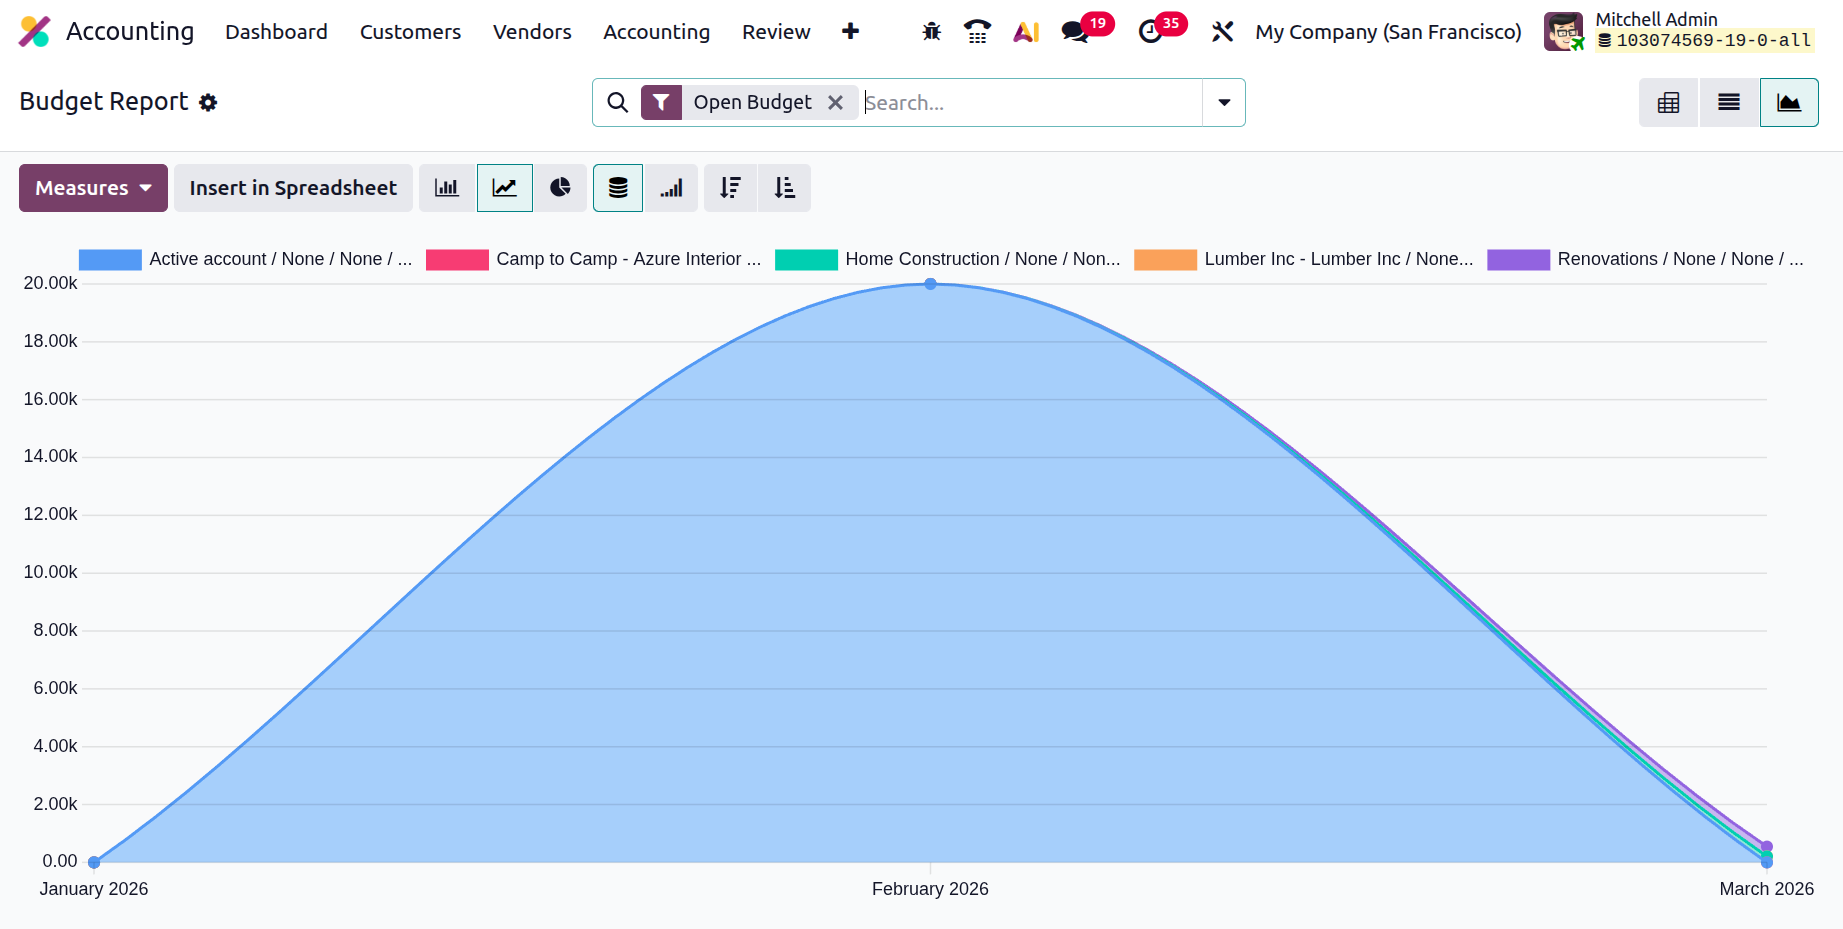
The budget analysis reports will provide you a comprehensive understanding of how your company's budget is operating in addition to the graph view. Additionally, you will be able to isolate the essential entries of each report that has been defined according to your demands by using the group by and simple and accurate filtering options that are provided. You can now understand the various elements of budget management reporting thanks to Odoo's special Budget Analysis reporting management solution. Now let's move on to the section that explains Project Margins reporting in Odoo Accounting.
Product Margins
The amount of money you make when you sell something you manufactured or purchased is known as the product margin. Product margins and their analysis can provide precise information about the products that companies will manufacture, depending on product sales. The product margin can be described mathematically as follows:
Product margin is calculated by dividing the selling price by the cost of the product.
If the selling price exceeds the cost price, the product is profitable for the business and the margin percentage is positive. On the other hand, the business loses money and all sales activity results in a negative margin if the selling price is less than the cost price. The Odoo platform has incorporated a unique reporting feature in the Odoo accounting module because it recognises the significance of the production margin in business operations. Product margin reporting offers a brief overview of a company's product margin performance and can be accessed through the Reporting menu in Odoo's accounting module.
Once you select the Product Margins option, the pop-up box seen in the image below will show up. The General Information data, including the From and To options that need more explanation, must be put up here. From the provided drop-down menu, you may choose Invoice State.
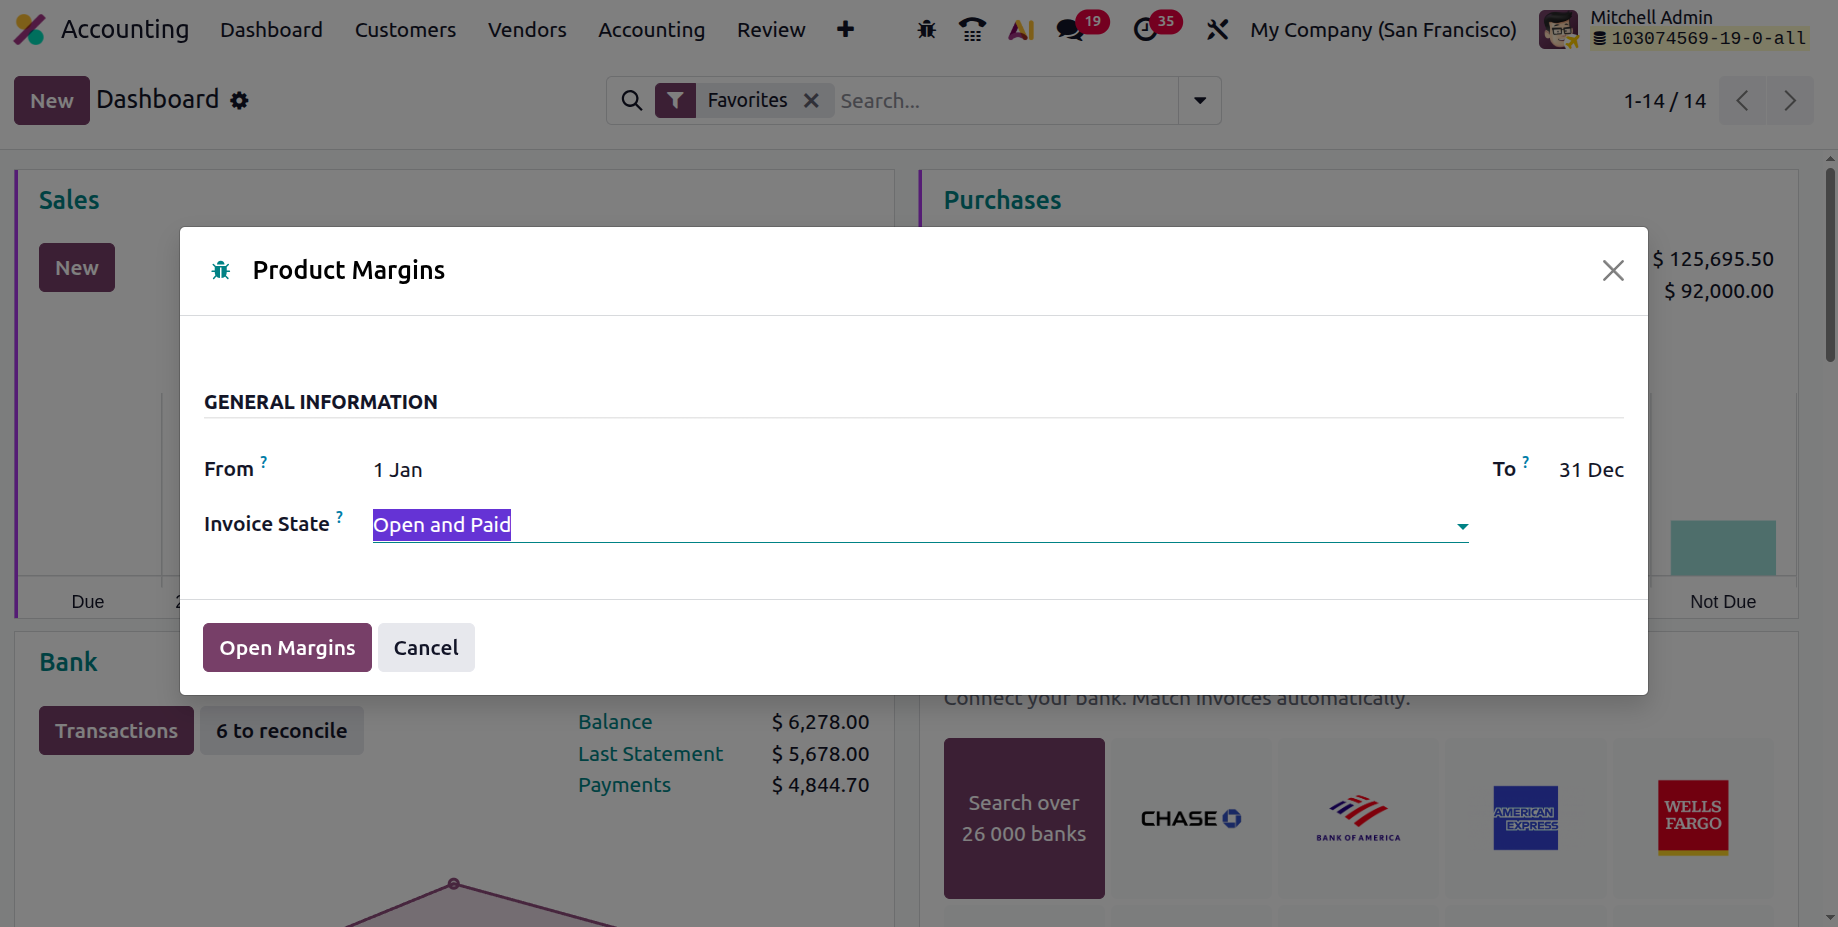
To view the Product Margins report aspect and the configurations aspect after the operations aspects have been configured, use the Open Margins option. The budget analysis and the selected options will determine how the product margin reporting is presented. Product names, turnover, sales gap, average sales unit price, invoiced sales amount, total cost, purchased amount, total margin, projected margin, total margin rate percentage, and forecasted margin percentage are all shown on this page. Internal reference data is also available.
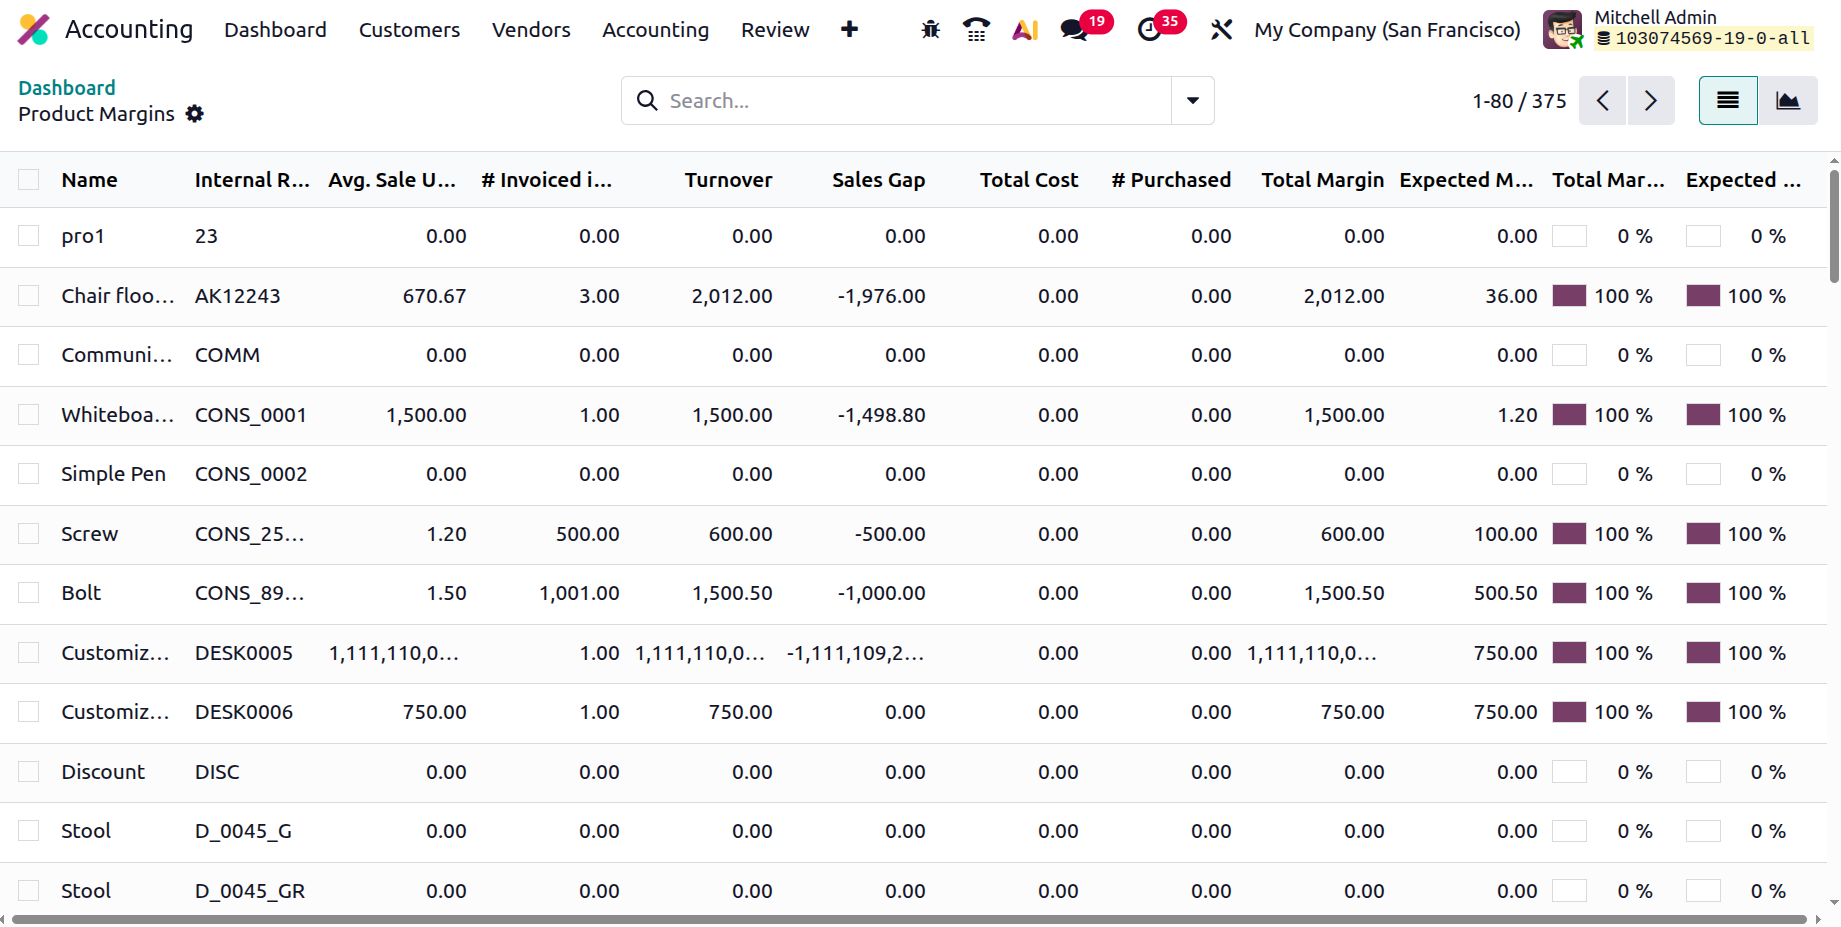
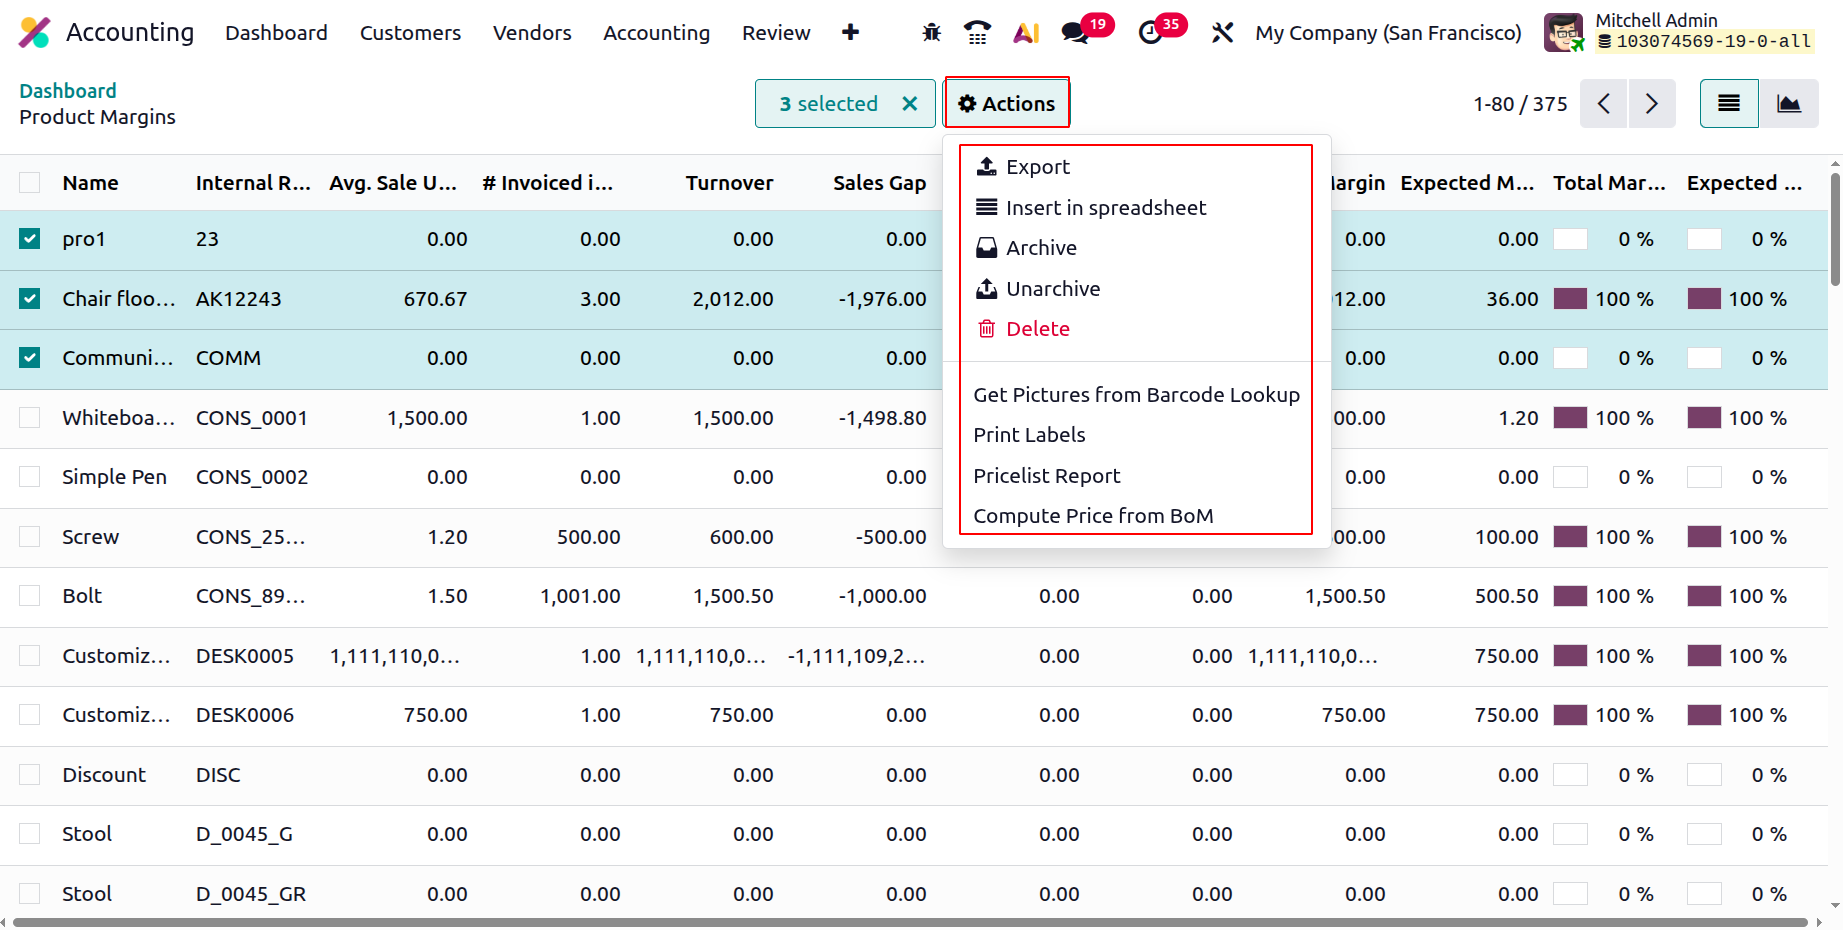
Additionally, the Filtering and Group by tools, available in all other Odoo platform menus, can be used to organise the Product Margins report inputs according to demands. These are the typical possibilities for grouping and filtering; additional can be made using the noble tools. You can save the Product Margins reporting components that are especially tailored to your requirements as favourites for future filtering. Additionally, as shown in the figure below, you can use the available Tick box option to choose from a variety of defined products. The Export, Archive, Unarchive, Delete, and Generate Pictures from Barcode Lookup, Print Labels, Pricelist Report and Compute rice from BoM options will be displayed when the Action option appears.
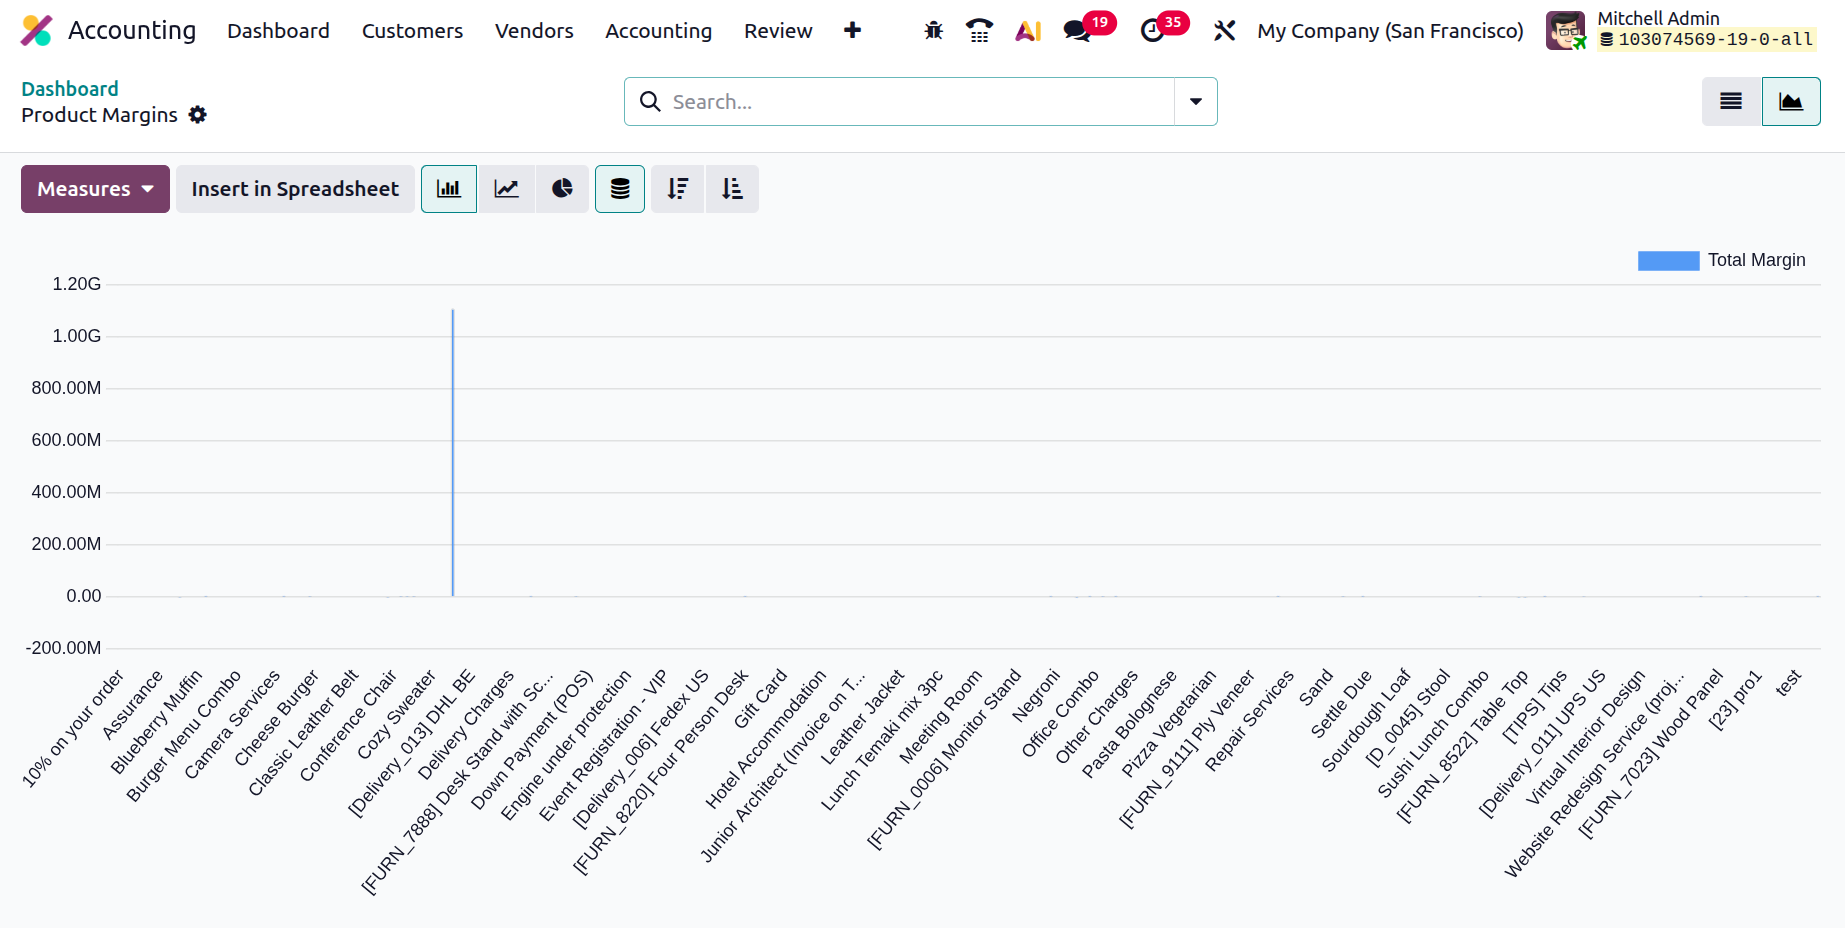
Graph View, which offers a more statistical perspective of the Product Margins, also displays the Product Margins reporting menu. The Bar Chart View of the Product Margins reporting is displayed in the screenshot below. Depending on your needs, you may also decide whether to display it as a pie chart or a line chart. Basic and custom filtering techniques are available, along with pre-established grouping choices. By choosing from the designated default measures, the measurements can be defined as needed.
The screenshot below shows the Product Margins reporting line chart, where the various qualities of the defined entries are represented by lines.
We've already covered the Odoo Accounting module's management-based reporting features.
The reporting features of the Odoo Accounting module are the exclusive subject of this chapter, which offers a thorough explanation of their operation. Statement reports, partner reports, audit reports, and management-based reports were some of the reporting methods we talked about.
The next chapter will focus on configuring Odoo's general settings, which are crucial for accounting procedures.