In Odoo 19, a bar chart (also known as a bar graph) is a visual representation of categorical data, where values are displayed using rectangular bars whose height or length corresponds to the data magnitude.
To create a bar chart using the Studio module, open Studio in Odoo 19 and choose the model for which you want to design the bar chart.
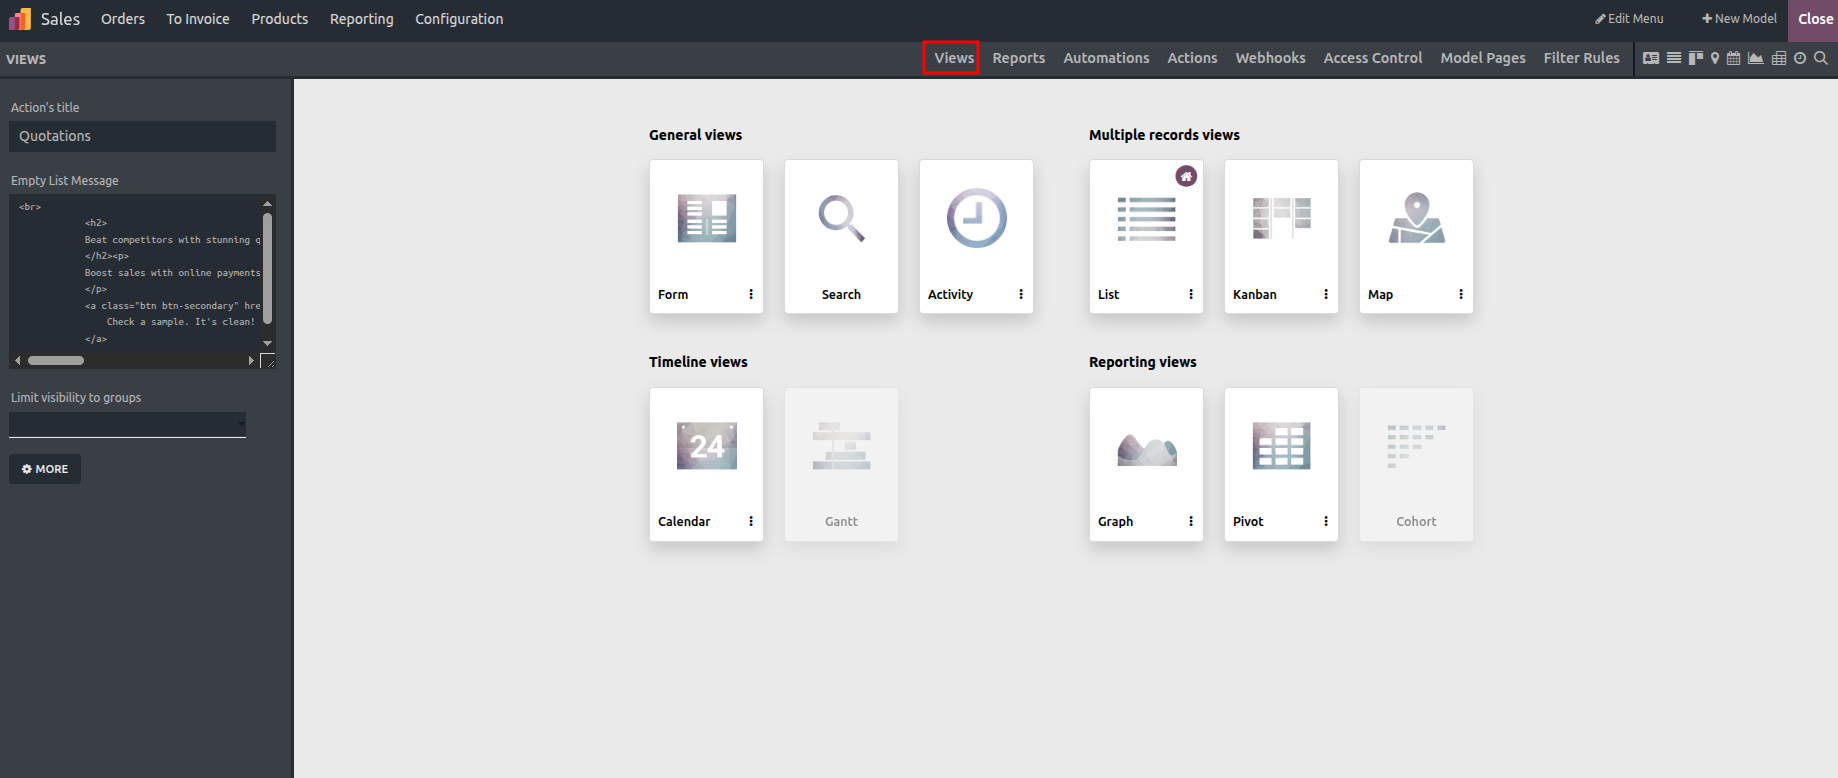
Select "Graph View" from the list of available views.
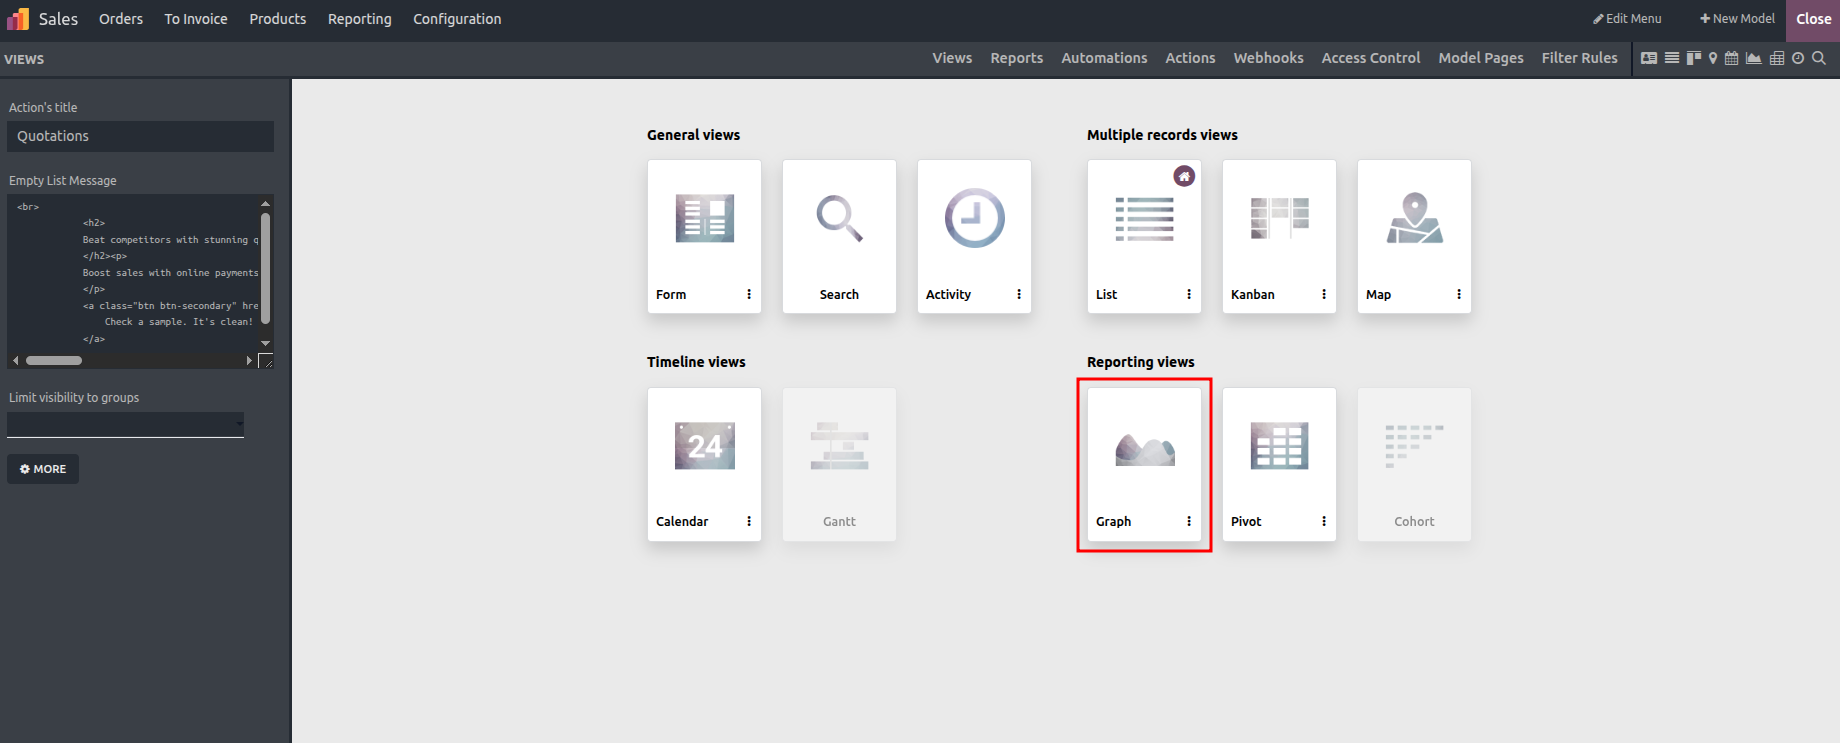
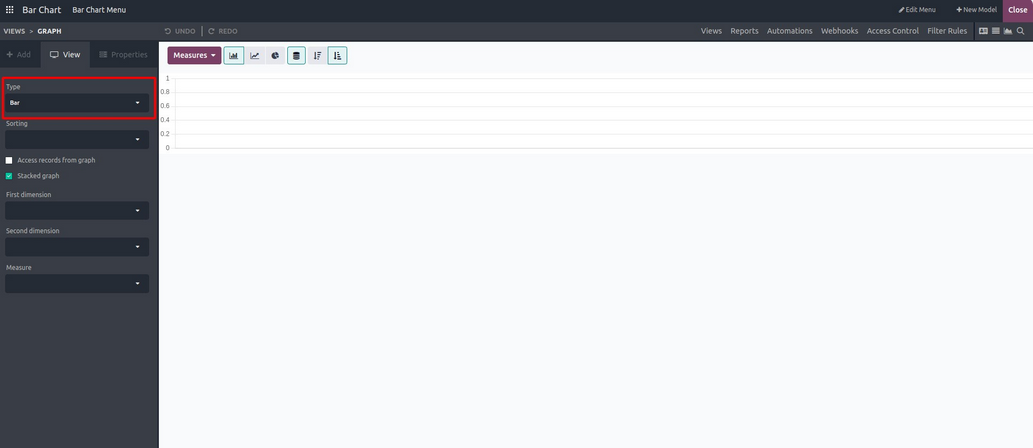
Select "Bar" as the type of chart.
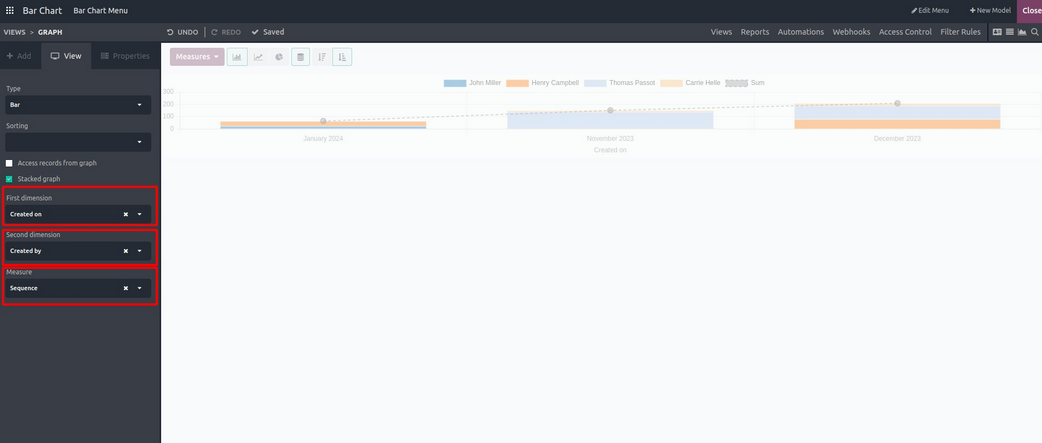
Choose the first and second dimensions along with the measurement field. These selections depend on the chosen model.
- First Dimension: This defines the X-axis of the chart and is used to group or categorize the data based on a specific attribute.
- Second Dimension: This represents the Y-axis of the chart and indicates the numerical values being analyzed.
- Measure: The measure specifies the actual value or quantity displayed on the chart, which is plotted along the Y-axis.
Allow Access to Records from the Graph
Users can define custom access rules to control and limit which records are visible in the graph view. These rules help ensure that only authorized data is displayed based on user permissions.
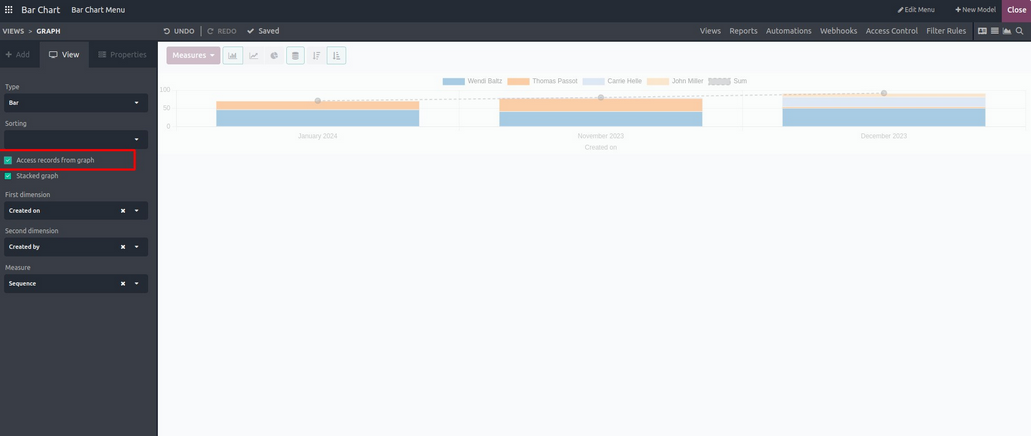
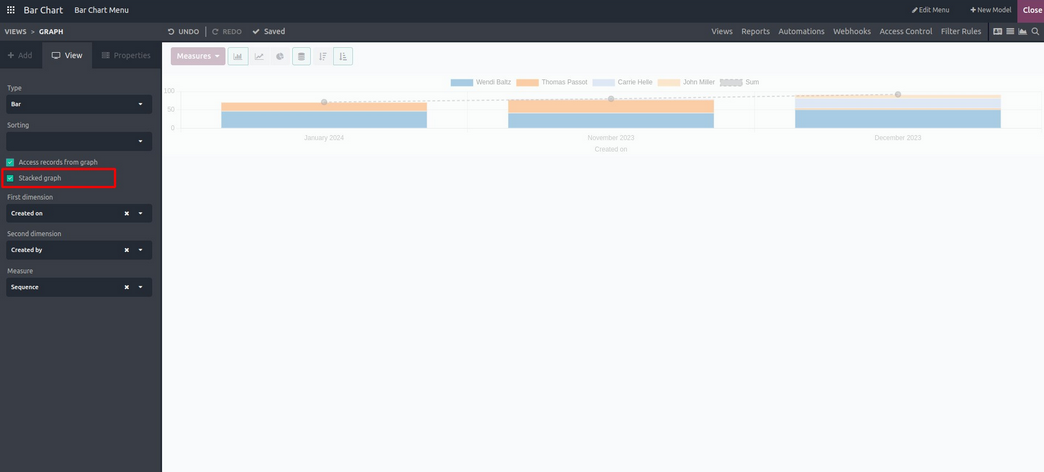
Enable Stacked Graph
This option allows the creation of a bar chart where the bars are stacked vertically instead of being displayed next to each other.
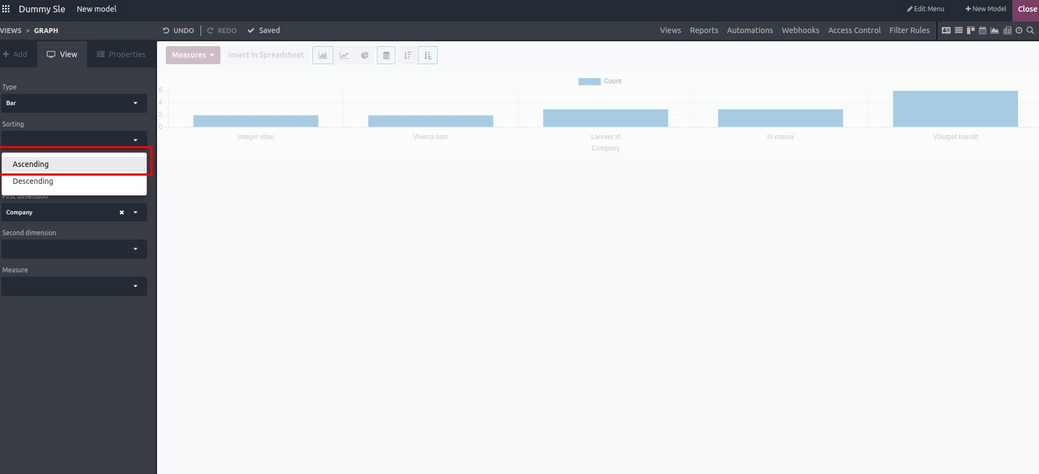
You can sort the Bar Chart in either ascending or descending order.
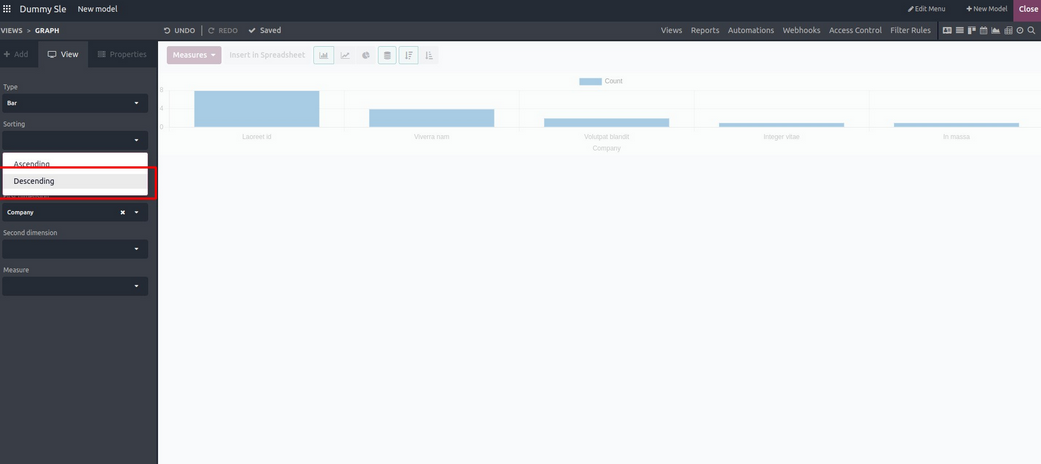
This is the view in descending order.
The bar chart feature in Odoo's Studio module lets users present categorical or discrete data clearly and intuitively, making it easier to identify trends, patterns, and comparisons. Whether analyzing sales, monitoring inventory, or tracking project progress, Odoo's Studio bar charts offer a versatile and effective way to visualize data and gain valuable insights.