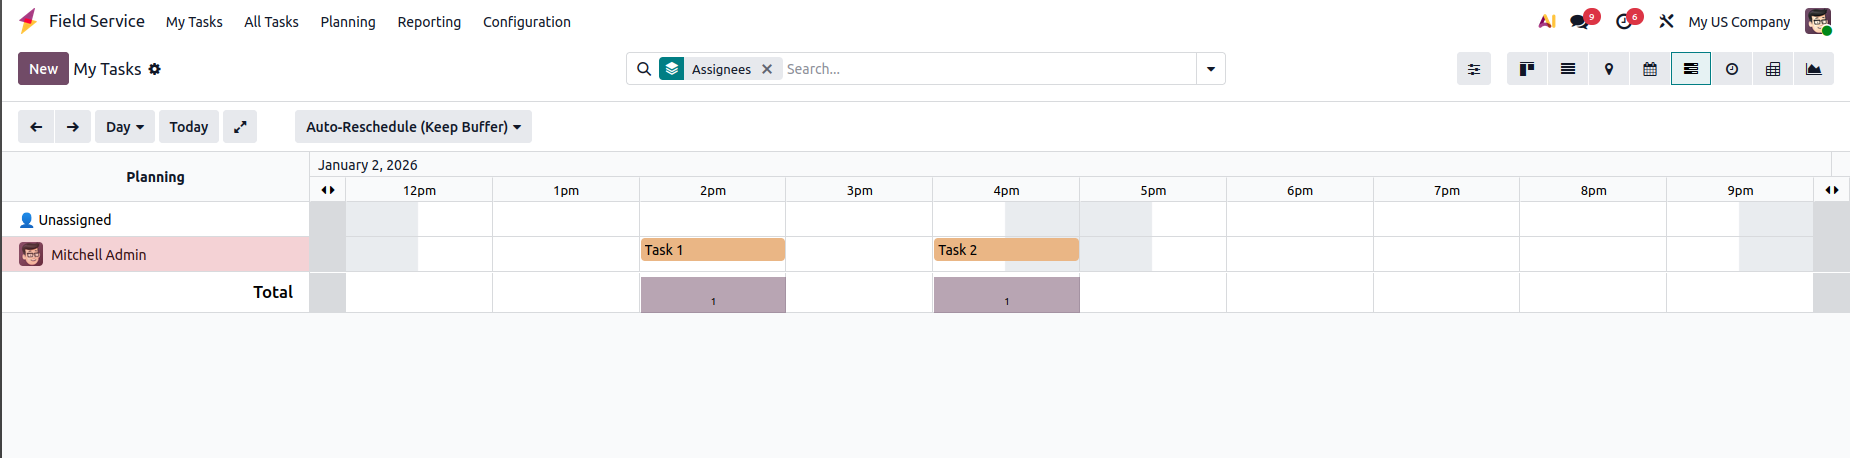
The Gantt Chart in Odoo is a visual planning tool designed to manage and coordinate time-based activities across multiple business operations. It provides a timeline view for scheduling and tracking records such as projects, manufacturing work orders, employee planning, field services, and other date-driven processes. By displaying start and end dates, overlaps, and progress in a single view, the Gantt Chart helps users plan work efficiently, adjust schedules with drag-and-drop, anticipate conflicts, and monitor execution in real time. Its purpose is to improve visibility, coordination, and decision-making across teams, ensuring resources are used effectively, and operations stay aligned with deadlines.
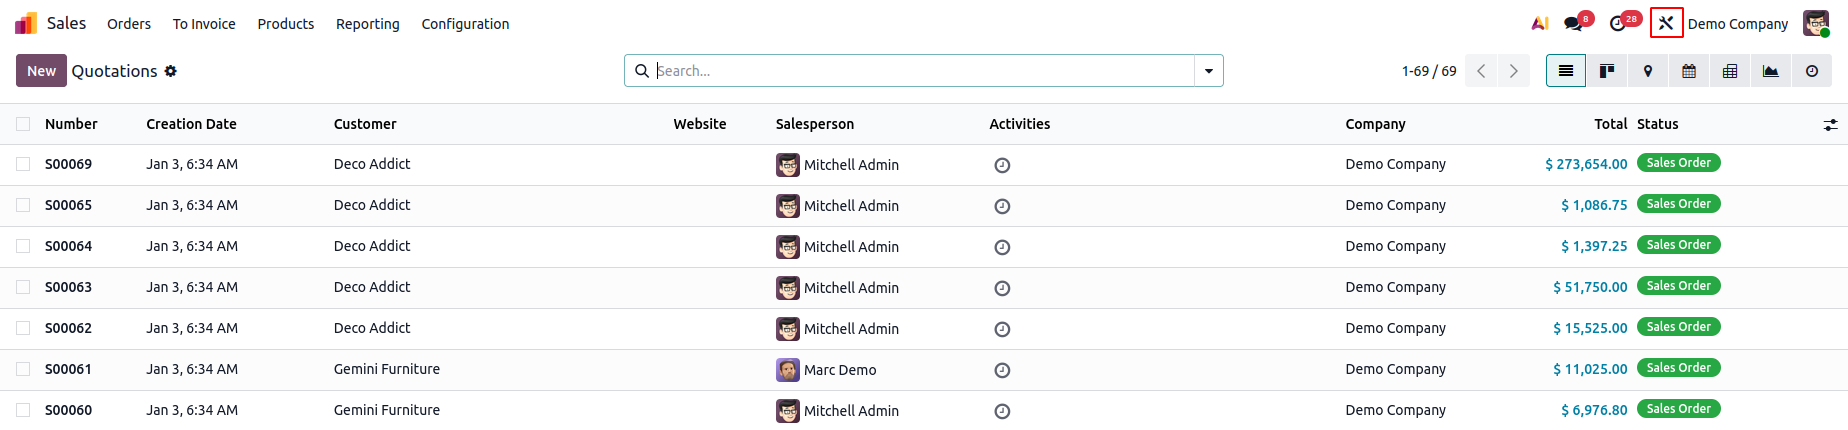
To add a Gantt view using Studio, click on the Studio button in the module.
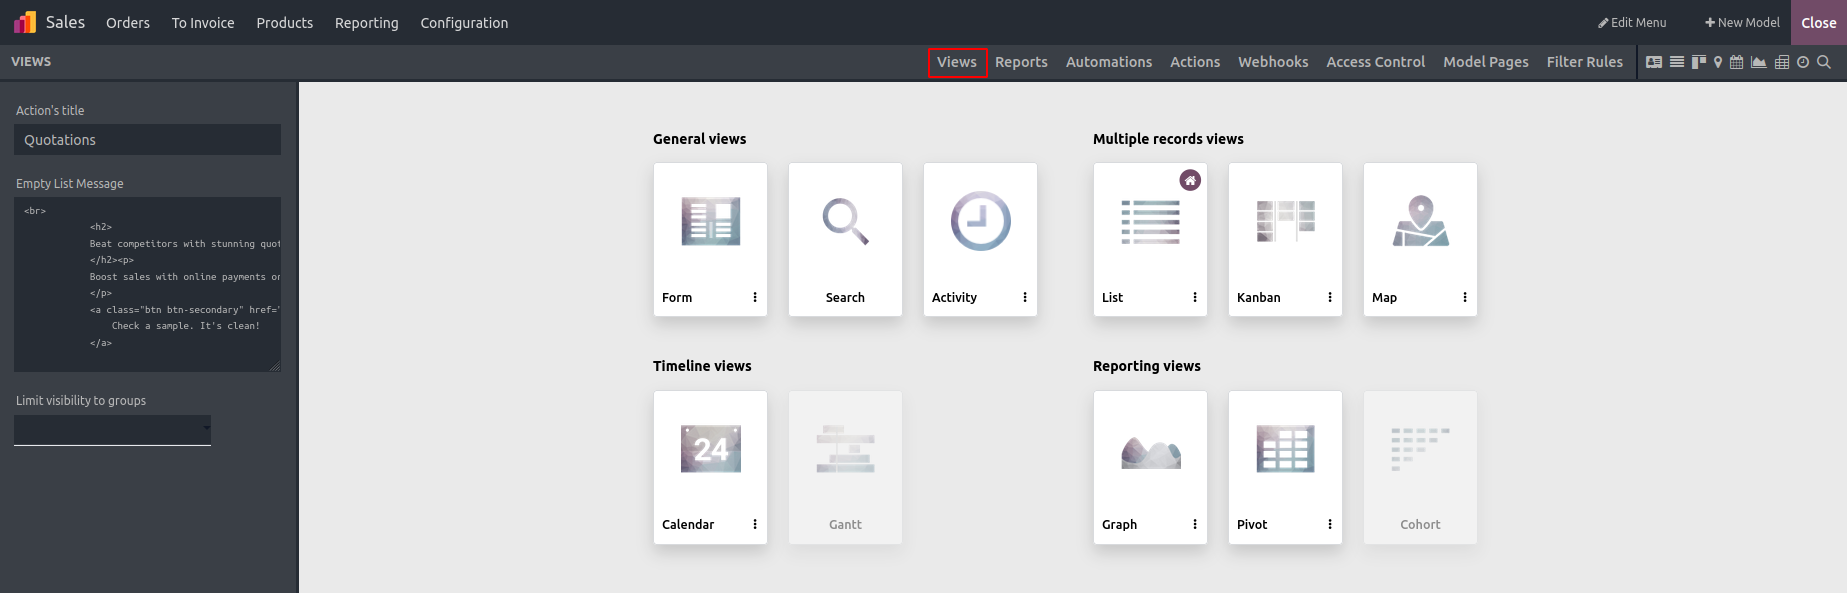
Select the Views and choose the Gantt view.
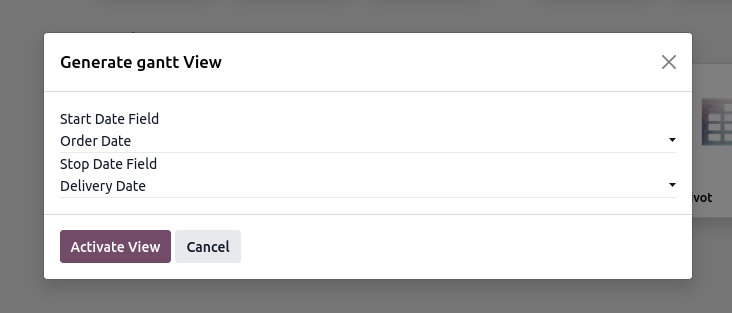
When you choose the Gantt view, a widget will appear where you can choose the start and end date fields, then click Activate View.
The Gantt settings include these components:
- Display Unavailability: To gray out the cells when a record cannot be created
- Display Total row: Displays the total number of rows at the bottom
- Start Date Field: Specifies the start date
- Stop Date Field: Specifies the stop date
- Label: Label to the Gantt view
- Default Group By: Determines the group by
- Default Scale: The default scale for the records- Day, Month, Quarter, Week, Year
- Color: Field names are assigned to color-coded boxes according to their values.
- Day Precision: Defines how accurately tasks are scheduled within a single day.
- Week Precision: Tasks are scheduled and shown by weeks.
- Month Precision: Tasks are scheduled and shown by months.
Once everything is set up, close Studio, and the Gantt view will be ready.