Whether you're tracking employee attendance, tracking monthly sales, or measuring inventory turnover, Odoo's Line Chart is a straightforward yet effective tool for visualizing how values change over time. It does this by connecting data points with straight lines, which clearly shows patterns, trends, and fluctuations. A typical line chart looks like this: the vertical axis (Y-axis) shows the measured values, and the horizontal axis (X-axis) represents a timeline or category. Whether you're tracking staff attendance, assessing inventory turnover, or keeping an eye on monthly sales, it makes patterns, trends, and fluctuations evident by connecting data points with straight lines.
In a standard line graph:
A timeline or category is represented by the horizontal axis (X-axis), while the measured values are shown on the vertical axis (Y-axis).
To create your own line chart with Studio in Odoo 19, open the Studio module, select the model (such as Sales Orders, Projects, or Invoices) you wish to work with, and then click "Graph View" from the "Views" tab.
Launch the Studio module.
Select the particular model you wish to work with, such as sales orders, projects, or invoices.
To start, select "Graph View" from the "Views" tab. And choose 'line' as type.
Set Up Your Chart Dimensions
To produce insightful results, set up the three main components of your line chart:
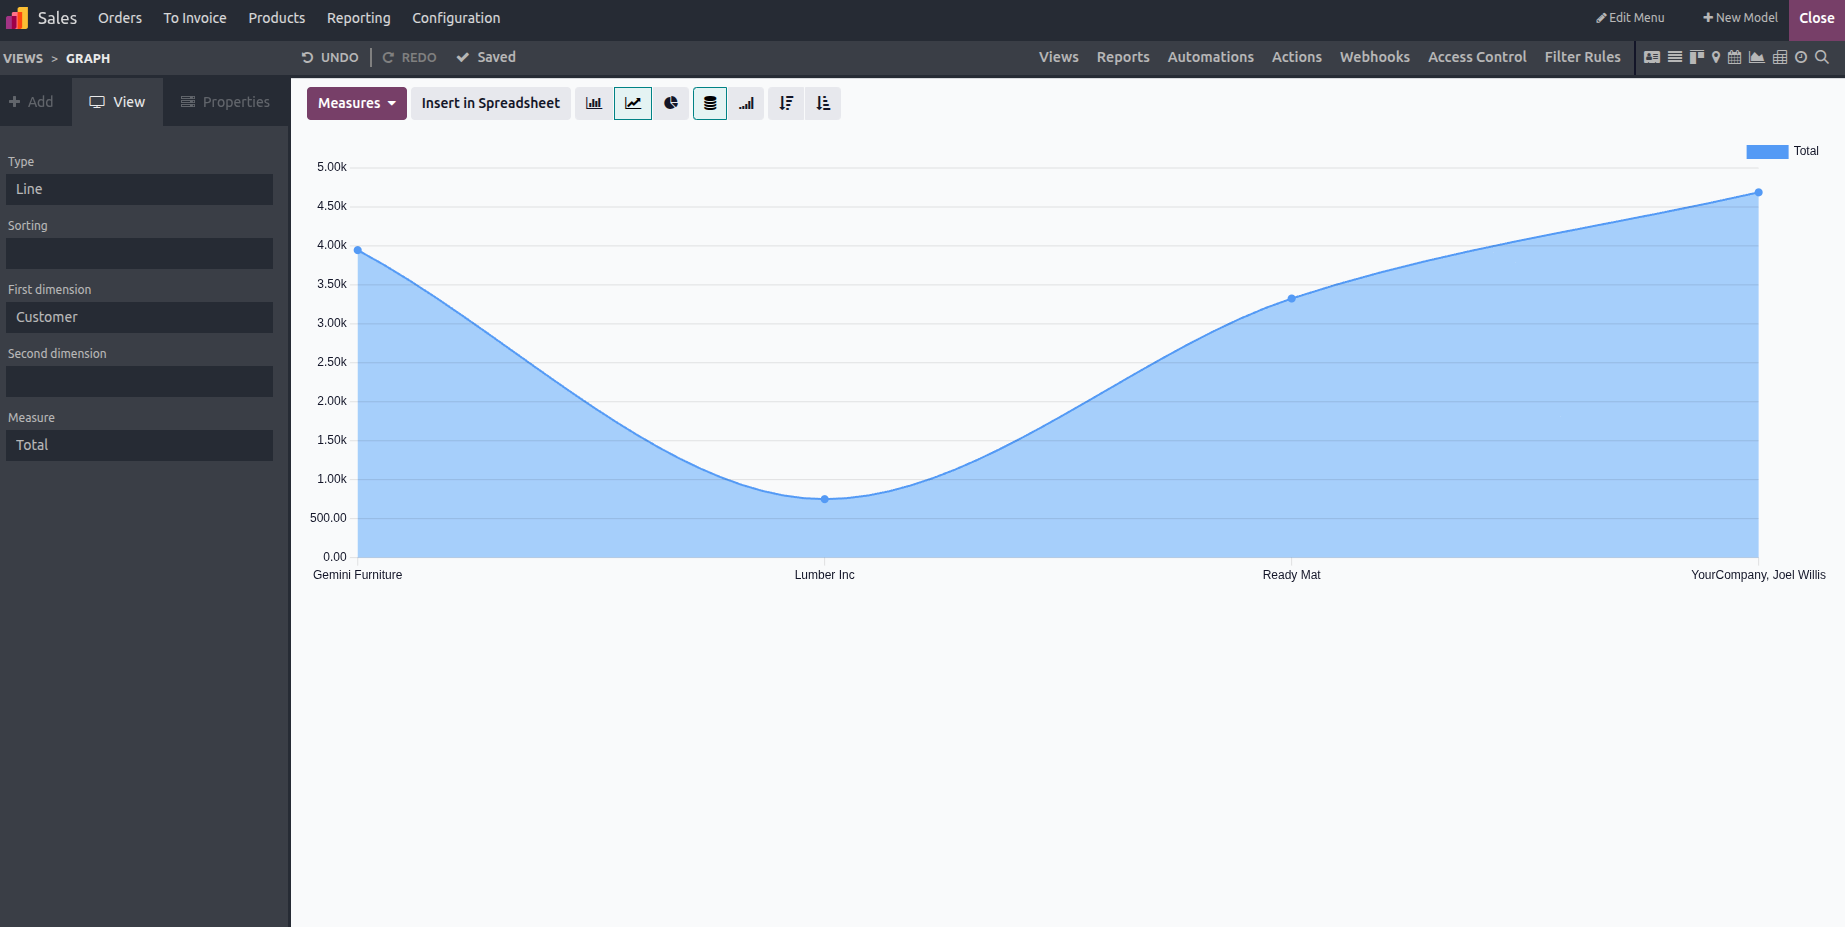
1. First Dimension: X-Axis (Timeline or Category)
This determines what shows up on the horizontal axis. It might be:
- A field with a date (like Order Date)
- A category (e.g., Department, Salesperson)
Your data is arranged into logical groups by it.
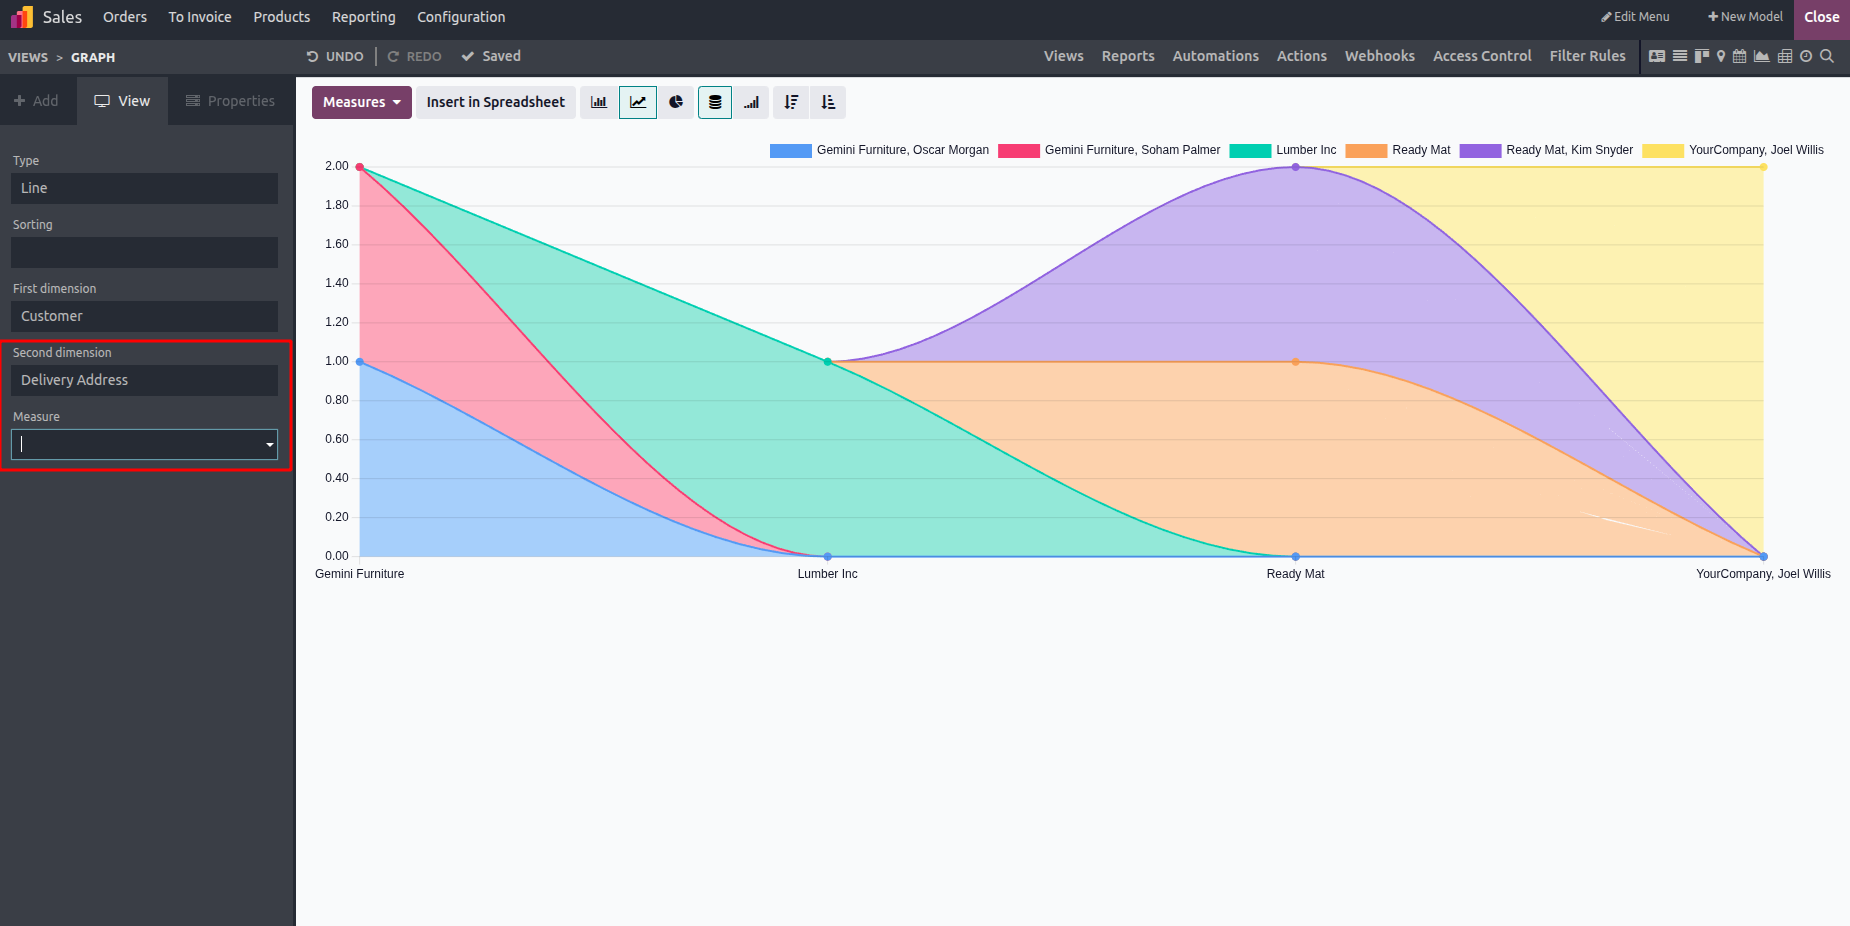
2. Second Dimension
Grouping (Optional): If the first dimension is month, your second dimension may be Sales Region to display regional comparisons over time. This optional parameter enables additional data breakdown and is ideal for comparisons within the same timeframe.
This optional field is ideal for comparisons within the same timeline because it permits additional data breakdown.
For instance, to display regional comparisons across time, your second dimension may be sales region if your first dimension is month.
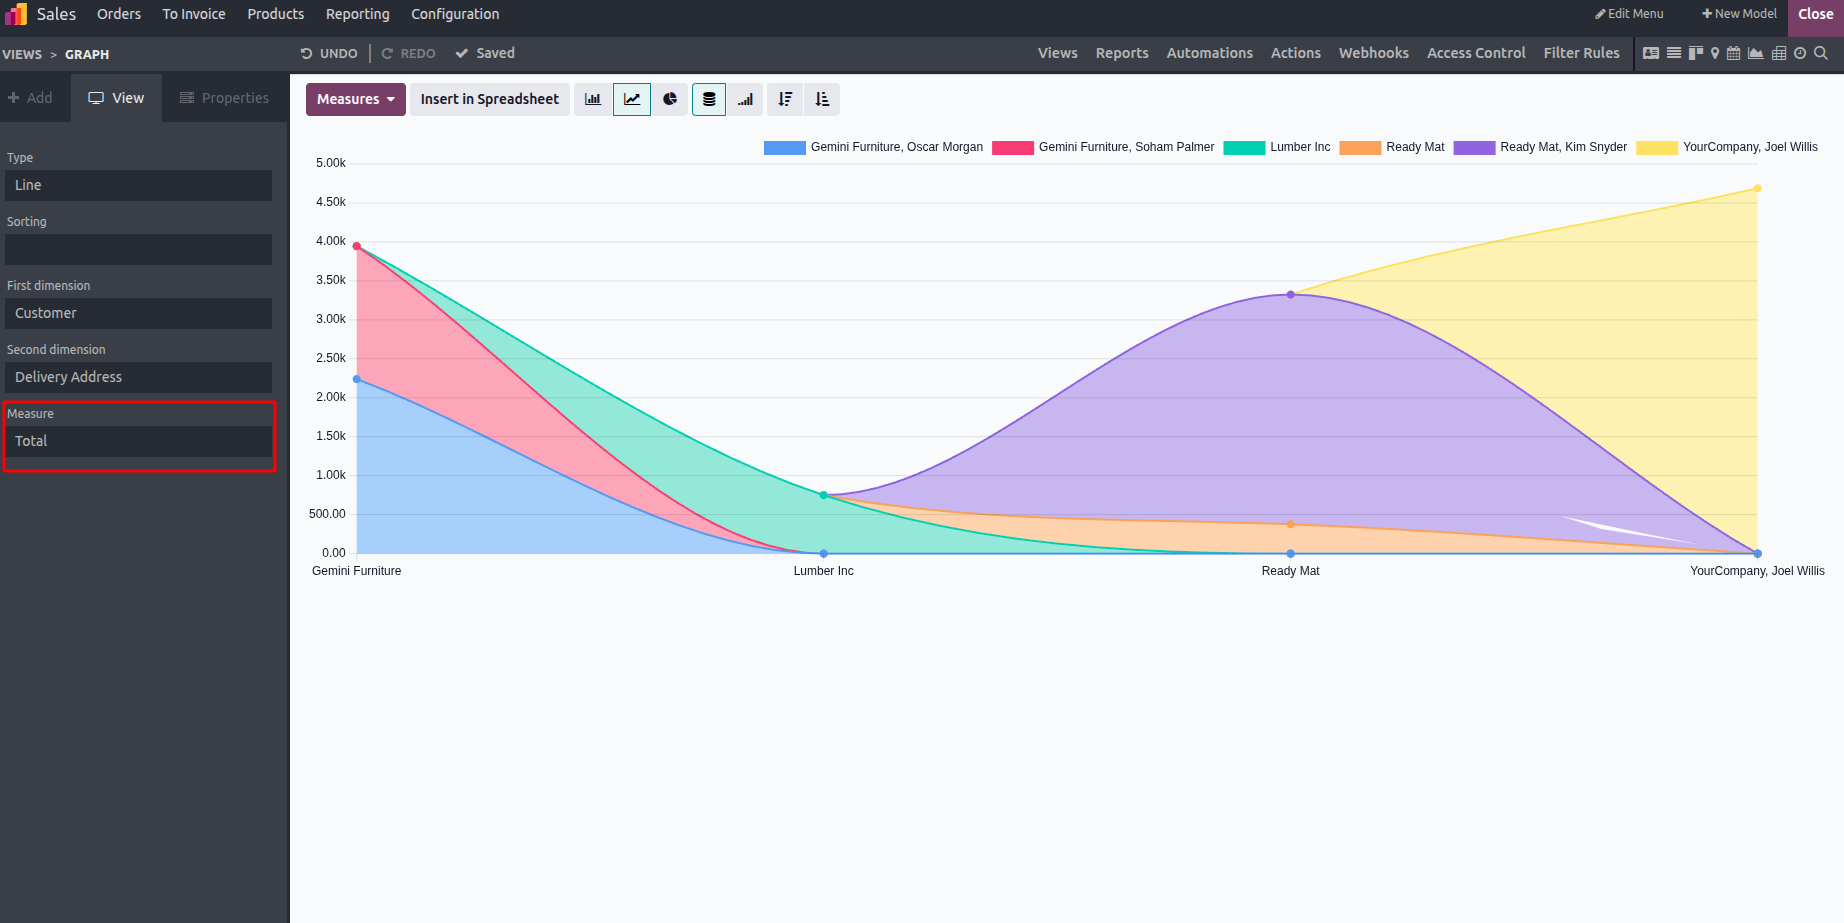
3. Measure-Y-Axis (Value to Track):
This specifies the metric that is shown along the vertical axis, such as the following: Total revenue, number of records, and quantity delivered. You can choose a numerical field that corresponds to the values you wish to measure.
This specifies the metrics that are shown along the vertical axis, like the following:
- Total earnings
- The quantity of records
- Quantity supplied
The values you wish to measure can be represented by a numerical field that you choose.
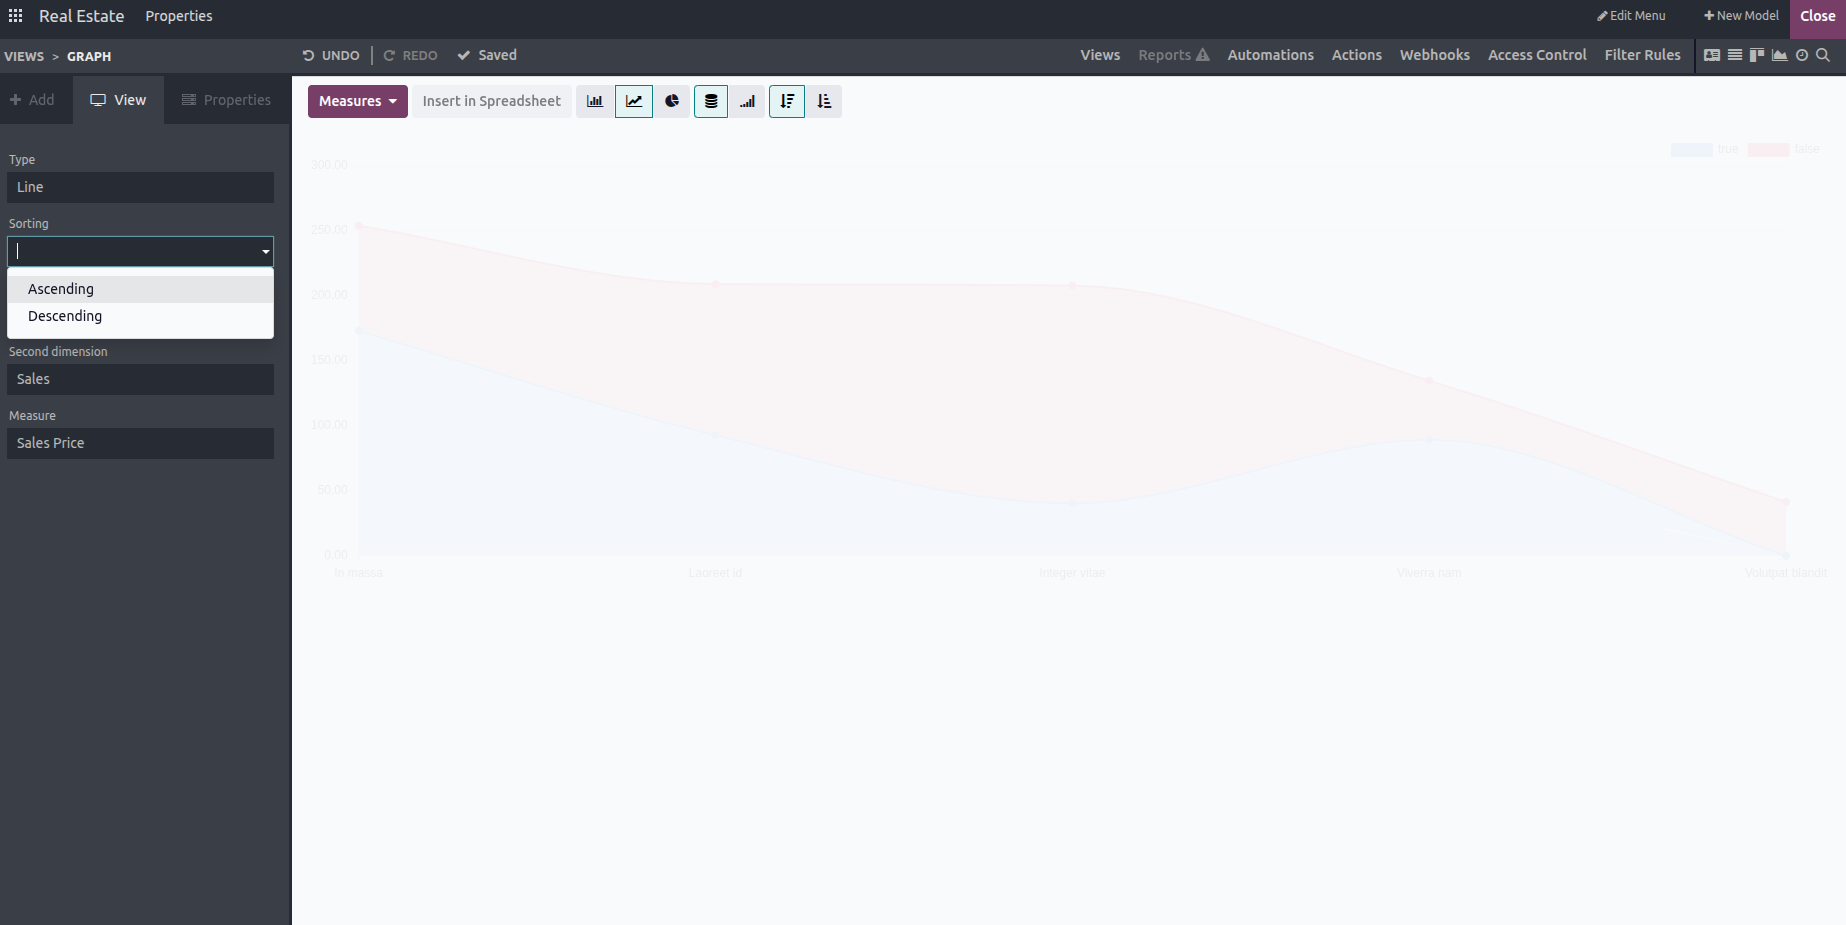
Sort Your Line Chart Using Odoo Studio
You can select the order of your data in Odoo Studio. That means you can arrange your data in one of two ways:
- Ascending: From lowest to highest or oldest to newest
- Descending: From top to lowest or newest to oldest,
Sorting options facilitate the interpretation of your trends.
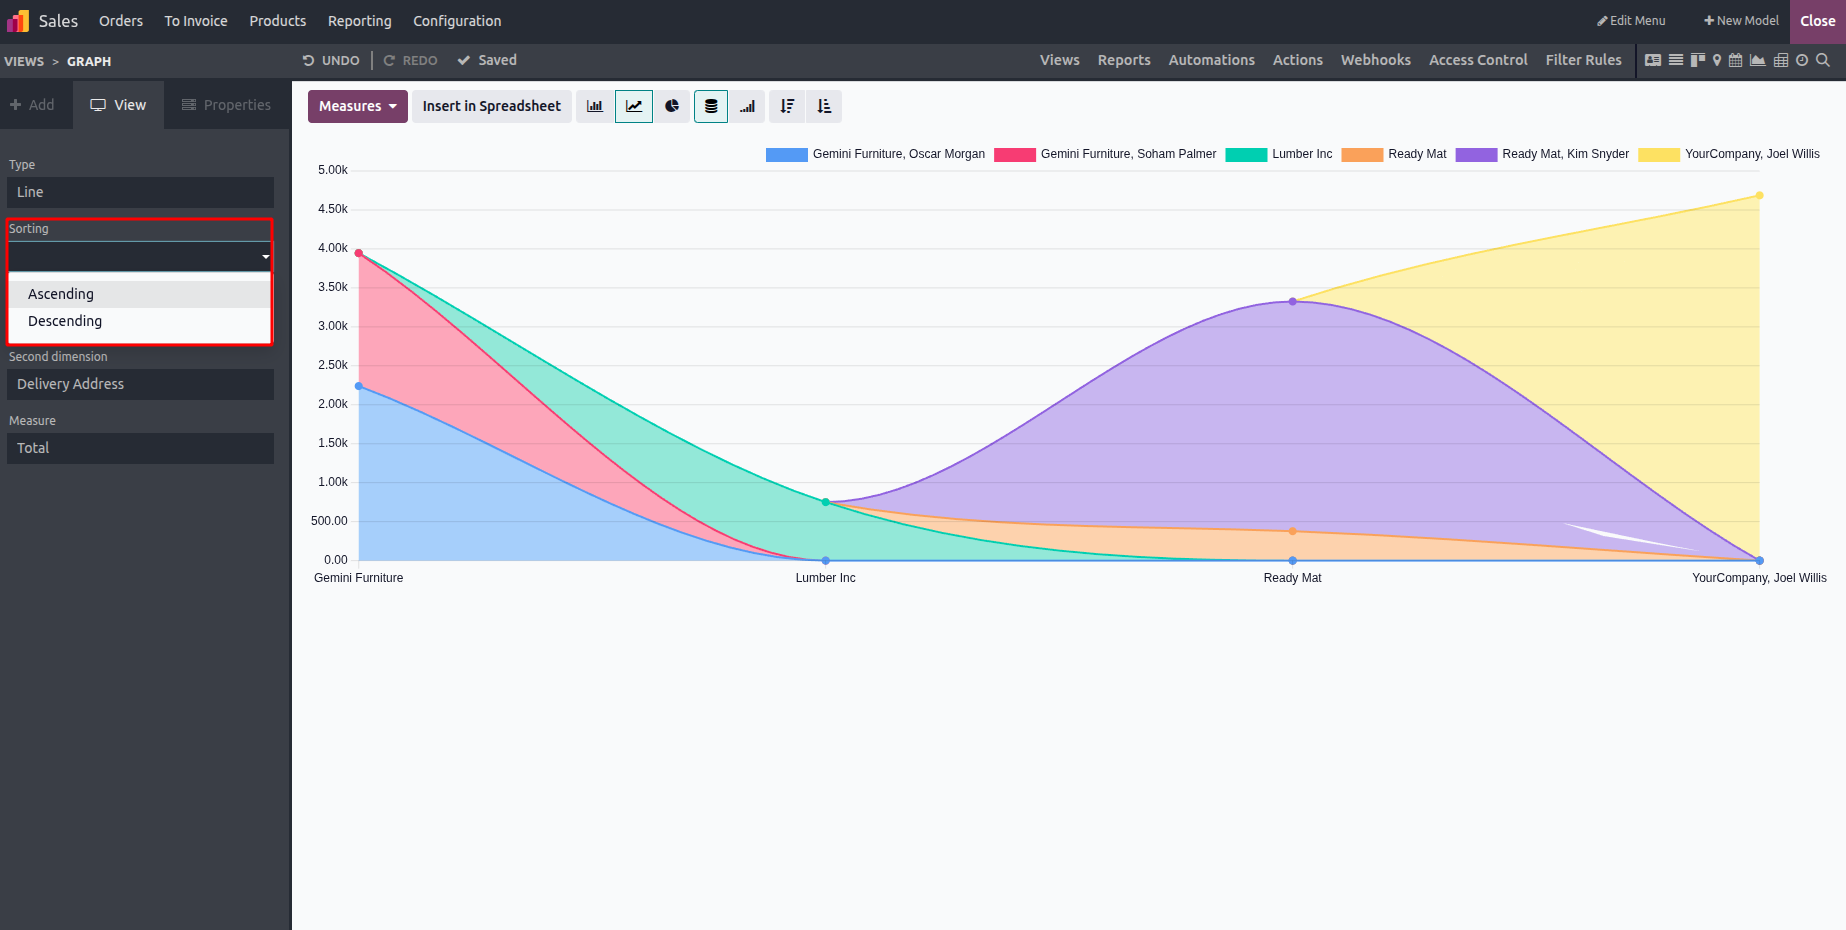
As an illustration, consider the Ascending Order View, which makes it simpler to track development or decline over time when a line chart is arranged in ascending order.
This is how a line chart appears when arranged in ascending order, which facilitates tracking growth or fall over time.