Using the Pivot view data analysis tool in Odoo Studio, you can create and customize pivot views for your custom models. The Pivot View in Studio is a powerful analysis tool that enables you to create customized data views tailored to your business needs. It helps in creating custom dashboards and reports that provide meaningful insights into your company's data.
With this tool, you can:
- Create customized pivot views for specific models
- Group data by one or more fields to generate multidimensional analyses
- Apply filters to focus on specific data sets
- Aggregate data using functions such as count, sum, average, and more
- Customize the layout and appearance, including rows, columns, and summary fields
- Generate charts and graphs from the pivot data for clearer visualization
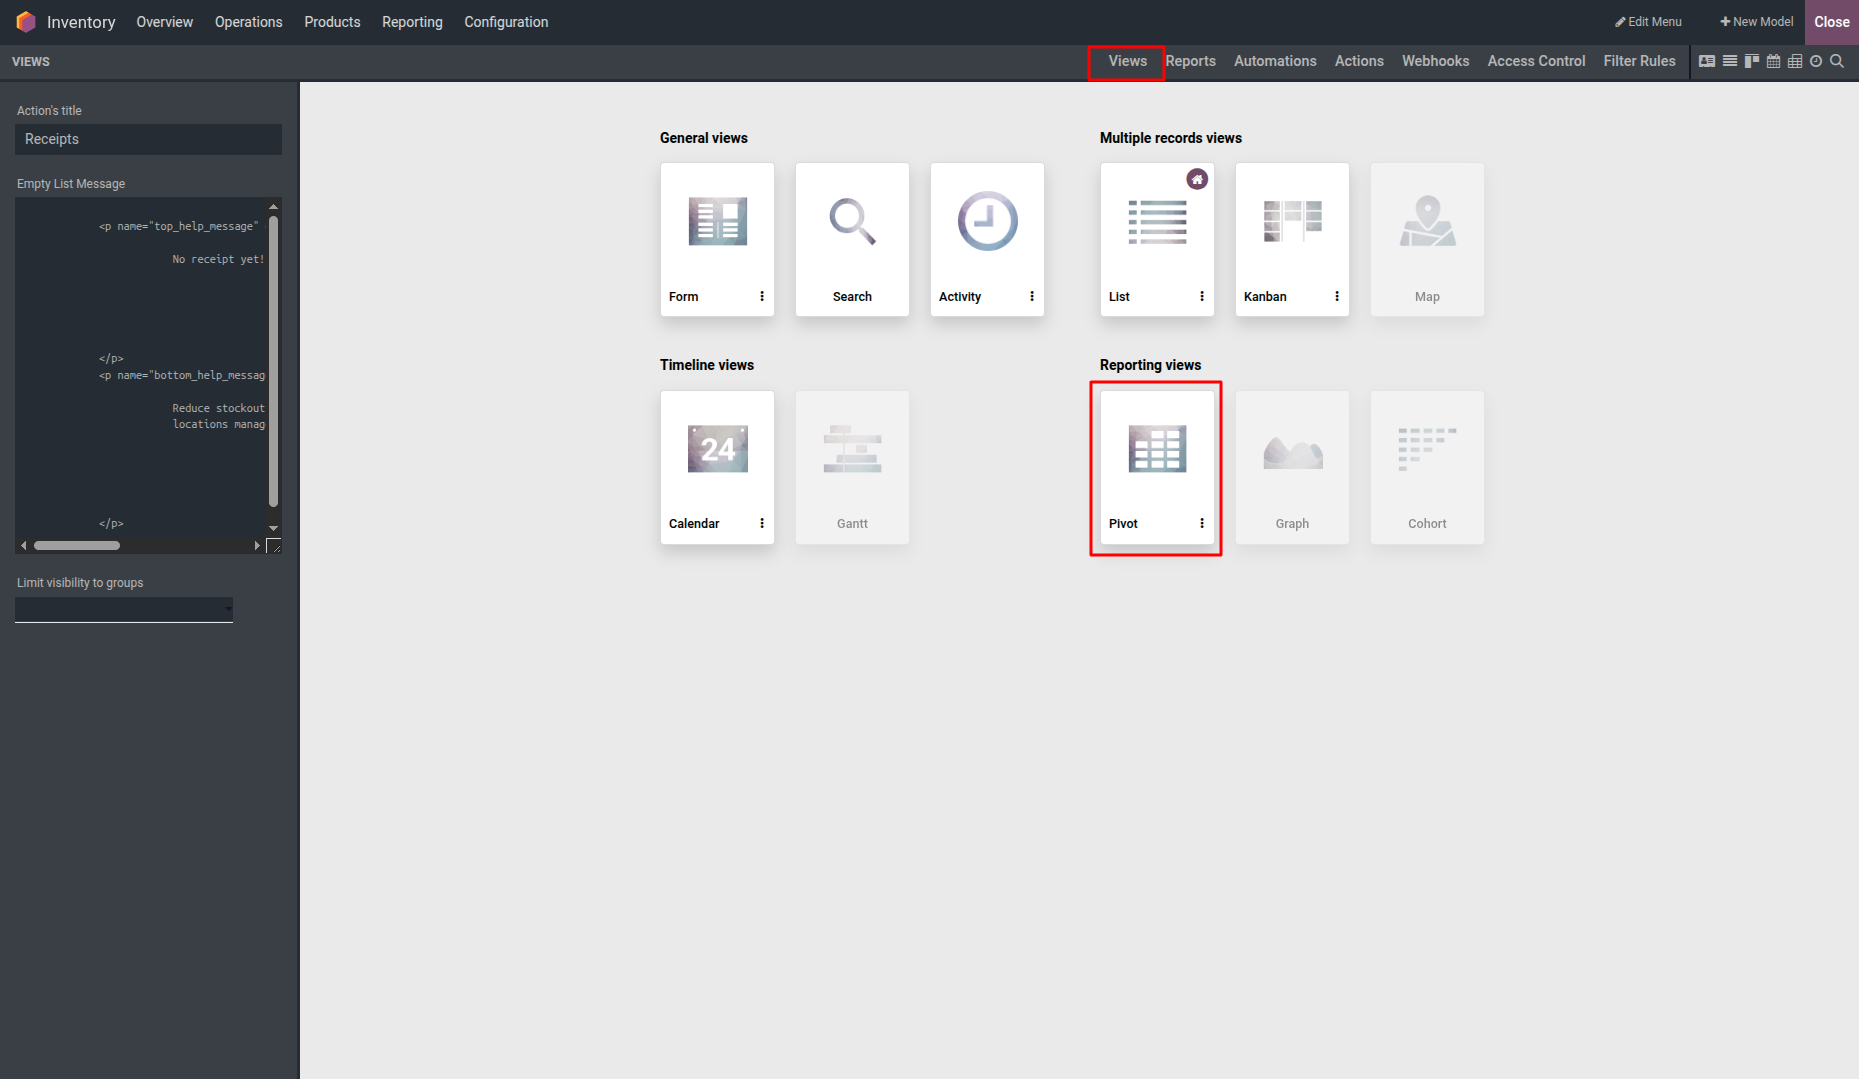
This flexibility makes Pivot View an effective solution for in-depth data analysis in Odoo Studio. The Pivot View is available under the Reporting Views section in Studio.
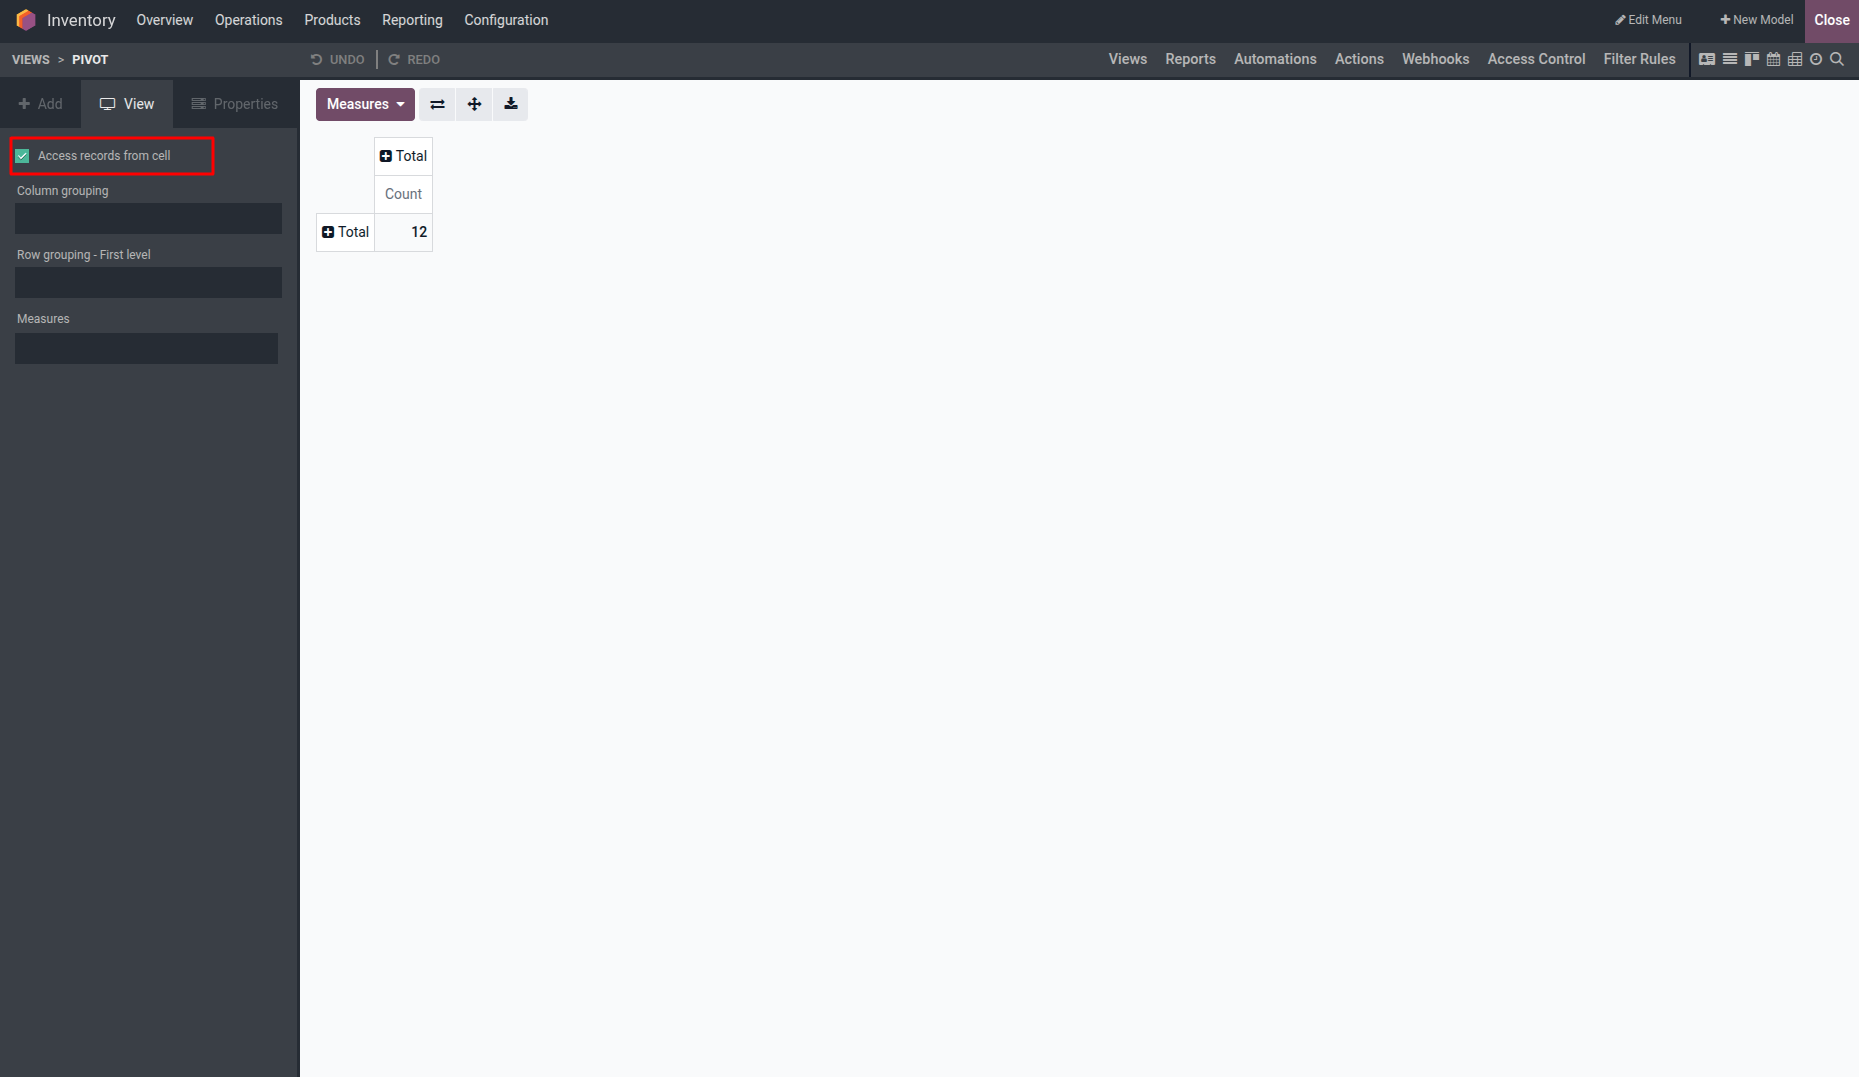
By enabling this option, users can access the records directly from the table.
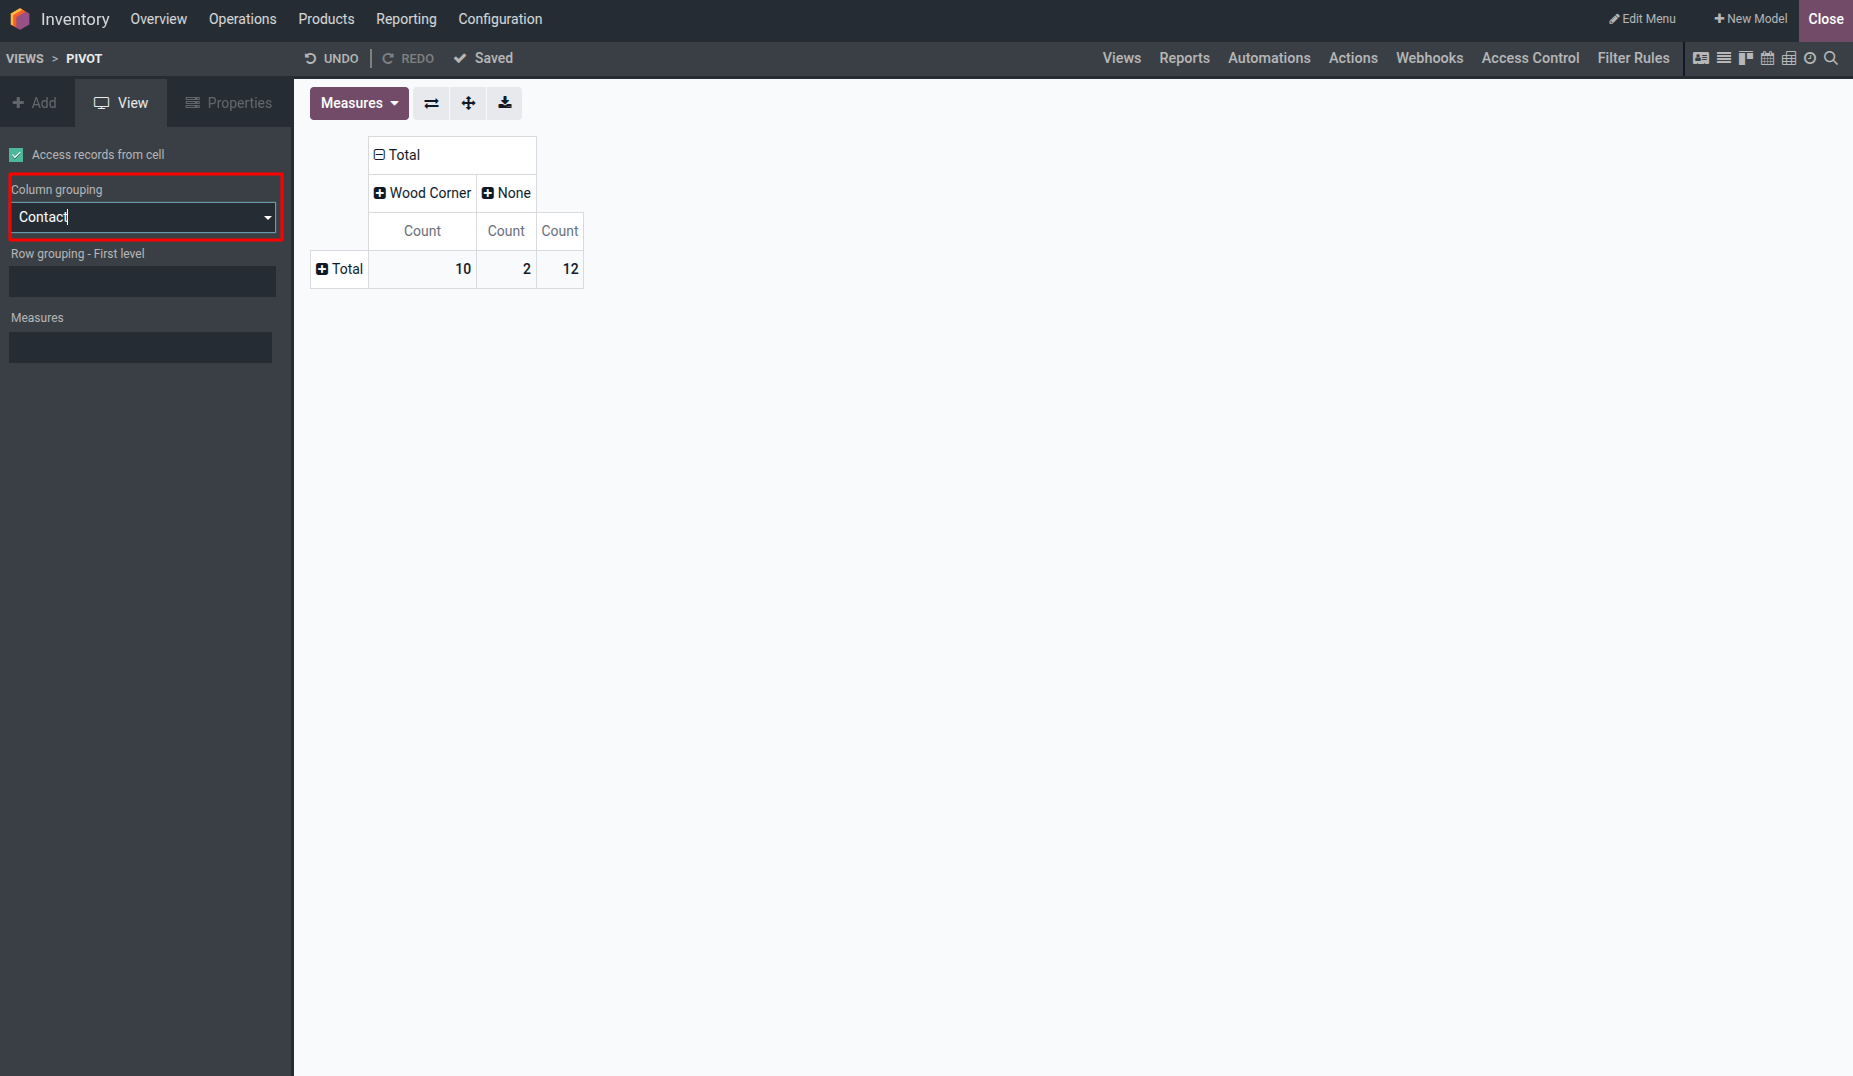
For parameter-based column grouping
Column grouping in the Studio Pivot Table is the process of organizing columns based on defined criteria.
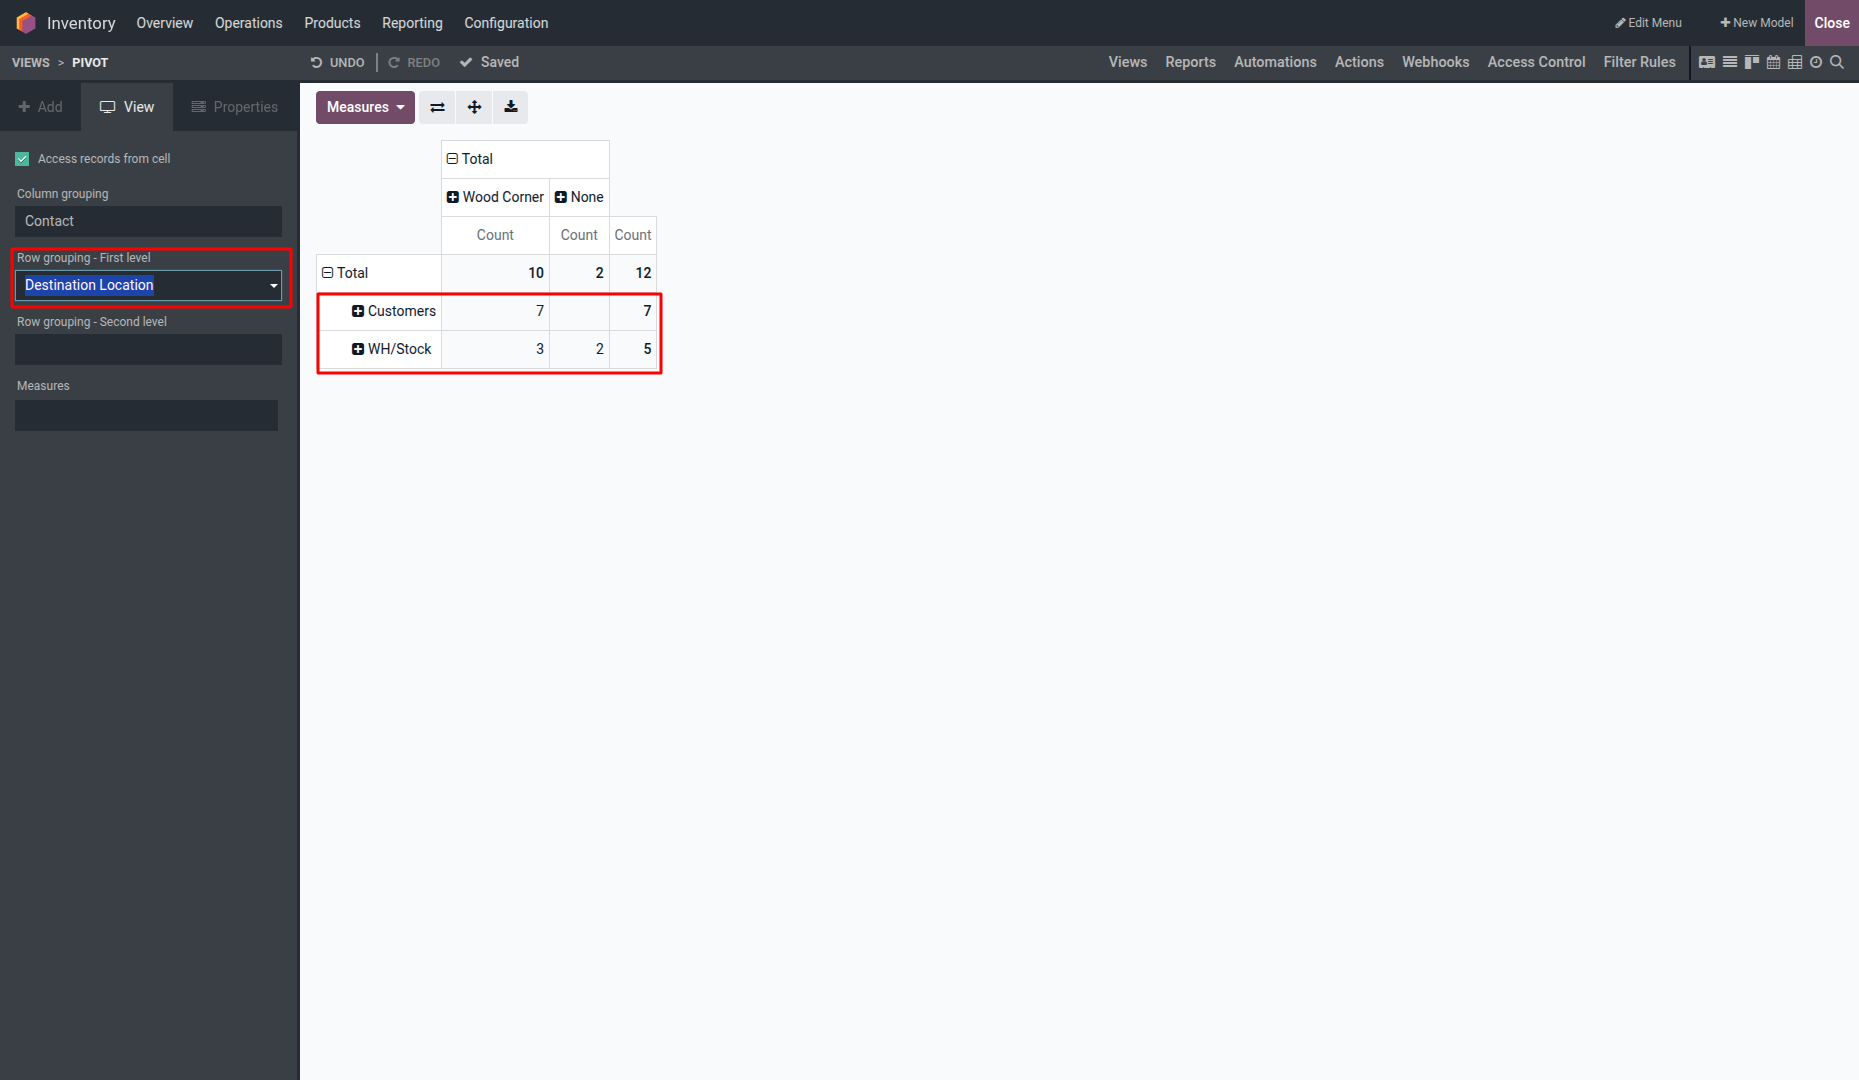
For parameter-based row grouping
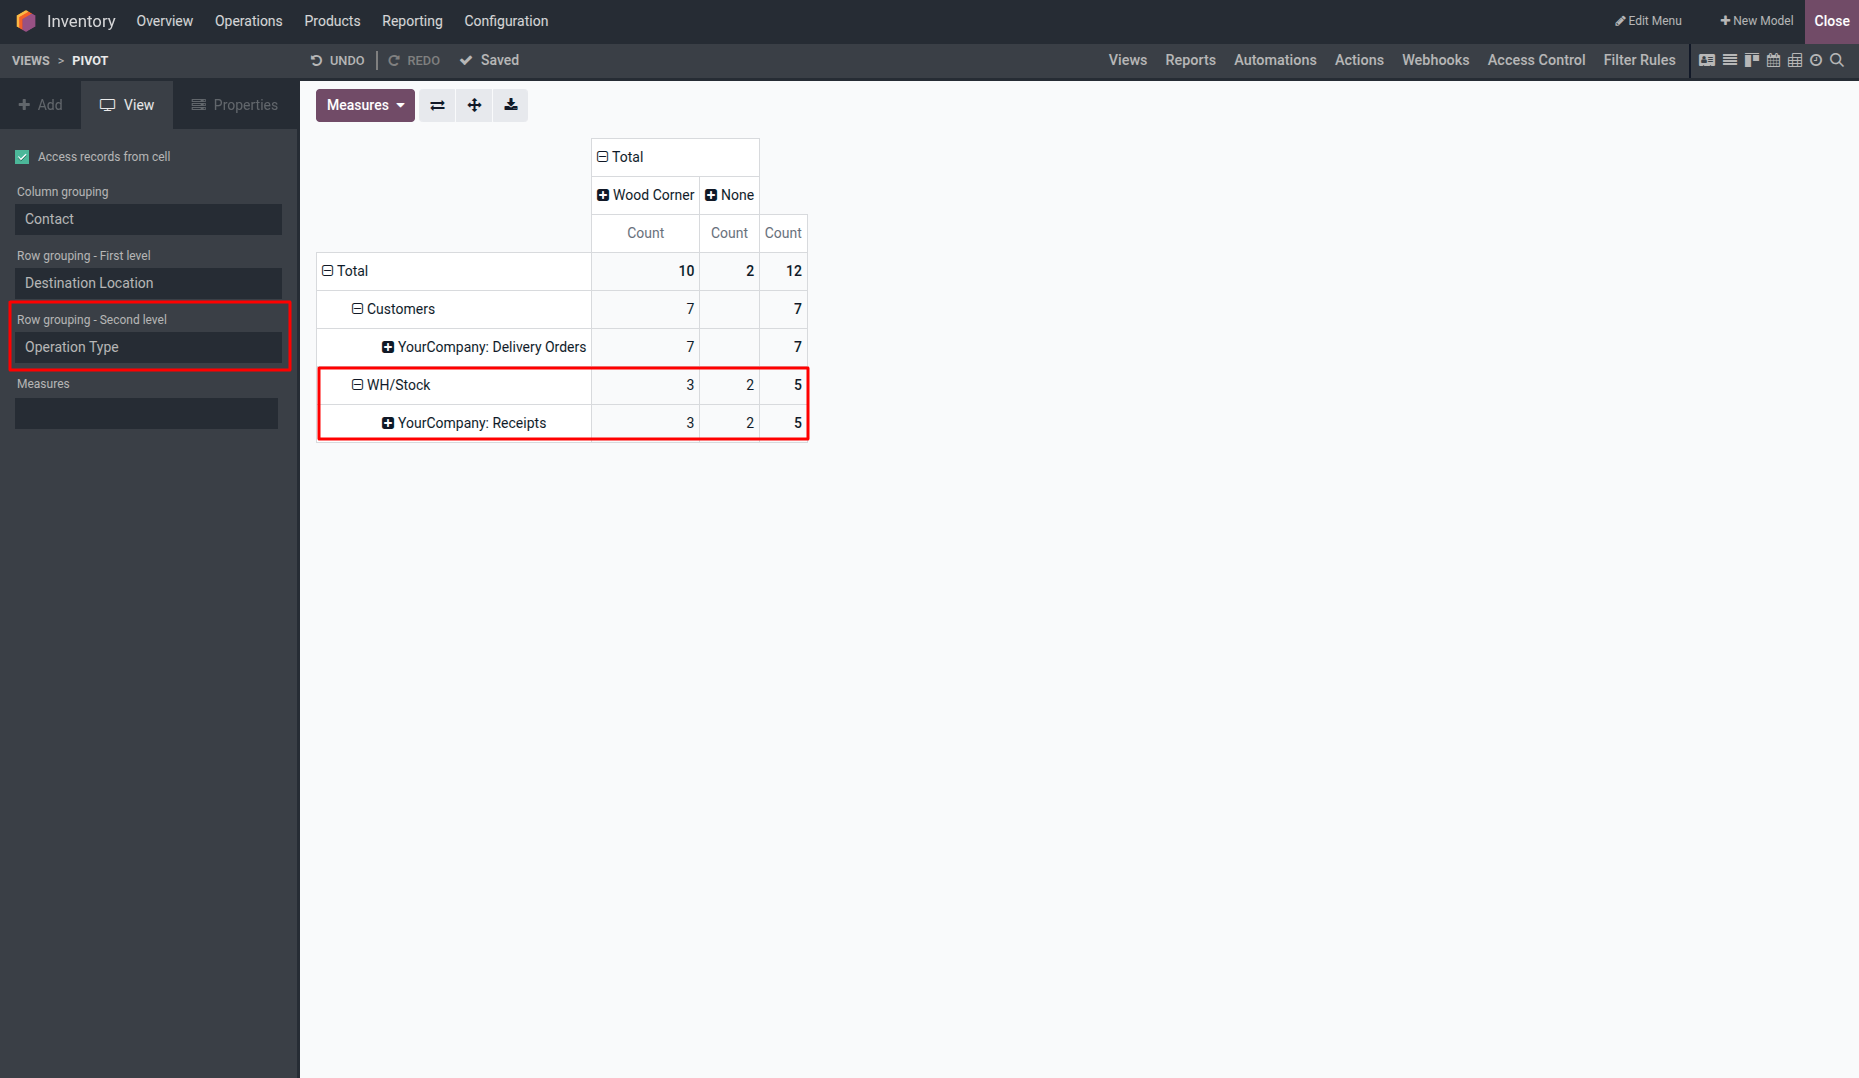
Row grouping in the Studio Pivot Table refers to the process of organizing rows by creating a hierarchy that groups related data together.
Row Grouping: The second level allows you to further refine row grouping by adding an additional layer of grouping.
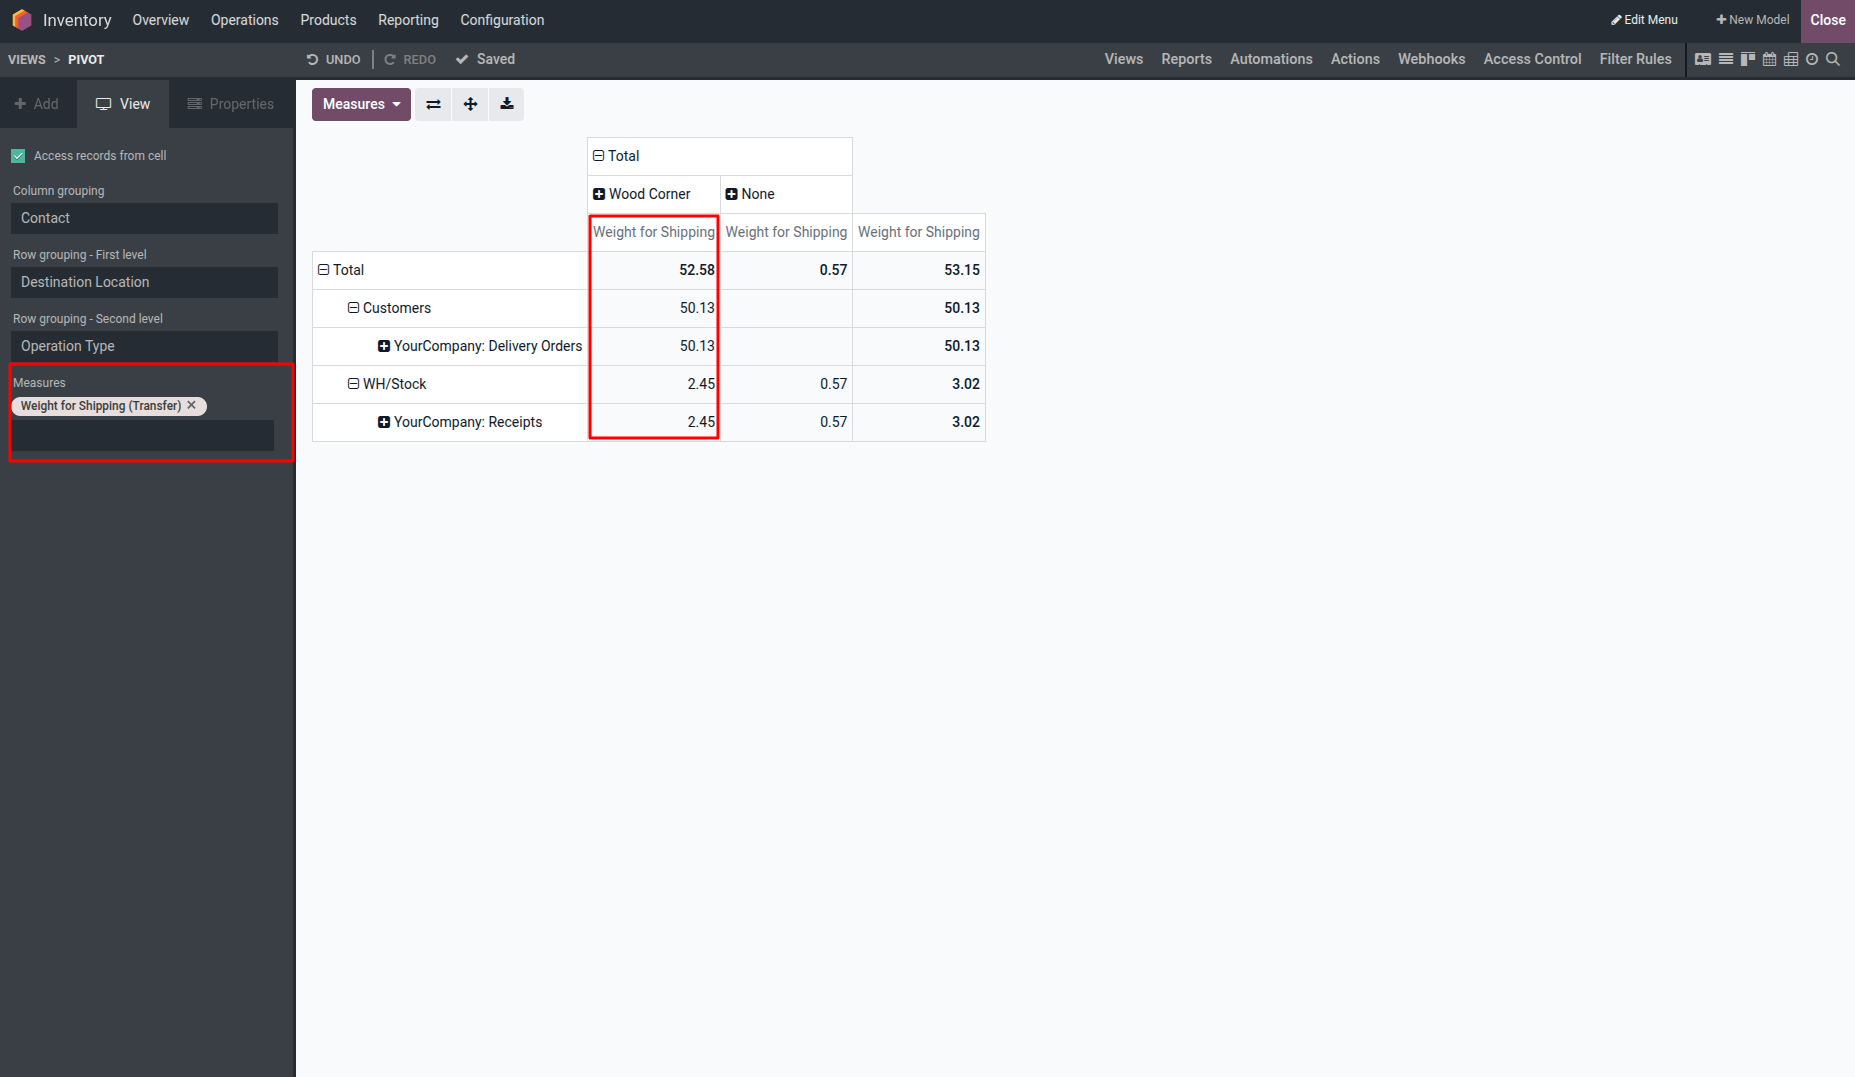
Measures in the Odoo 17 Studio Pivot Table represent the quantitative values used for analysis. Measures such as "Weight of Shipping" can be added to perform data aggregation and analysis.
Finally, the Pivot Table feature in Odoo Studio offers a user-friendly and powerful tool for data analysis, summarization, visualization, and reporting, enabling users to gain valuable insights and make informed decisions.