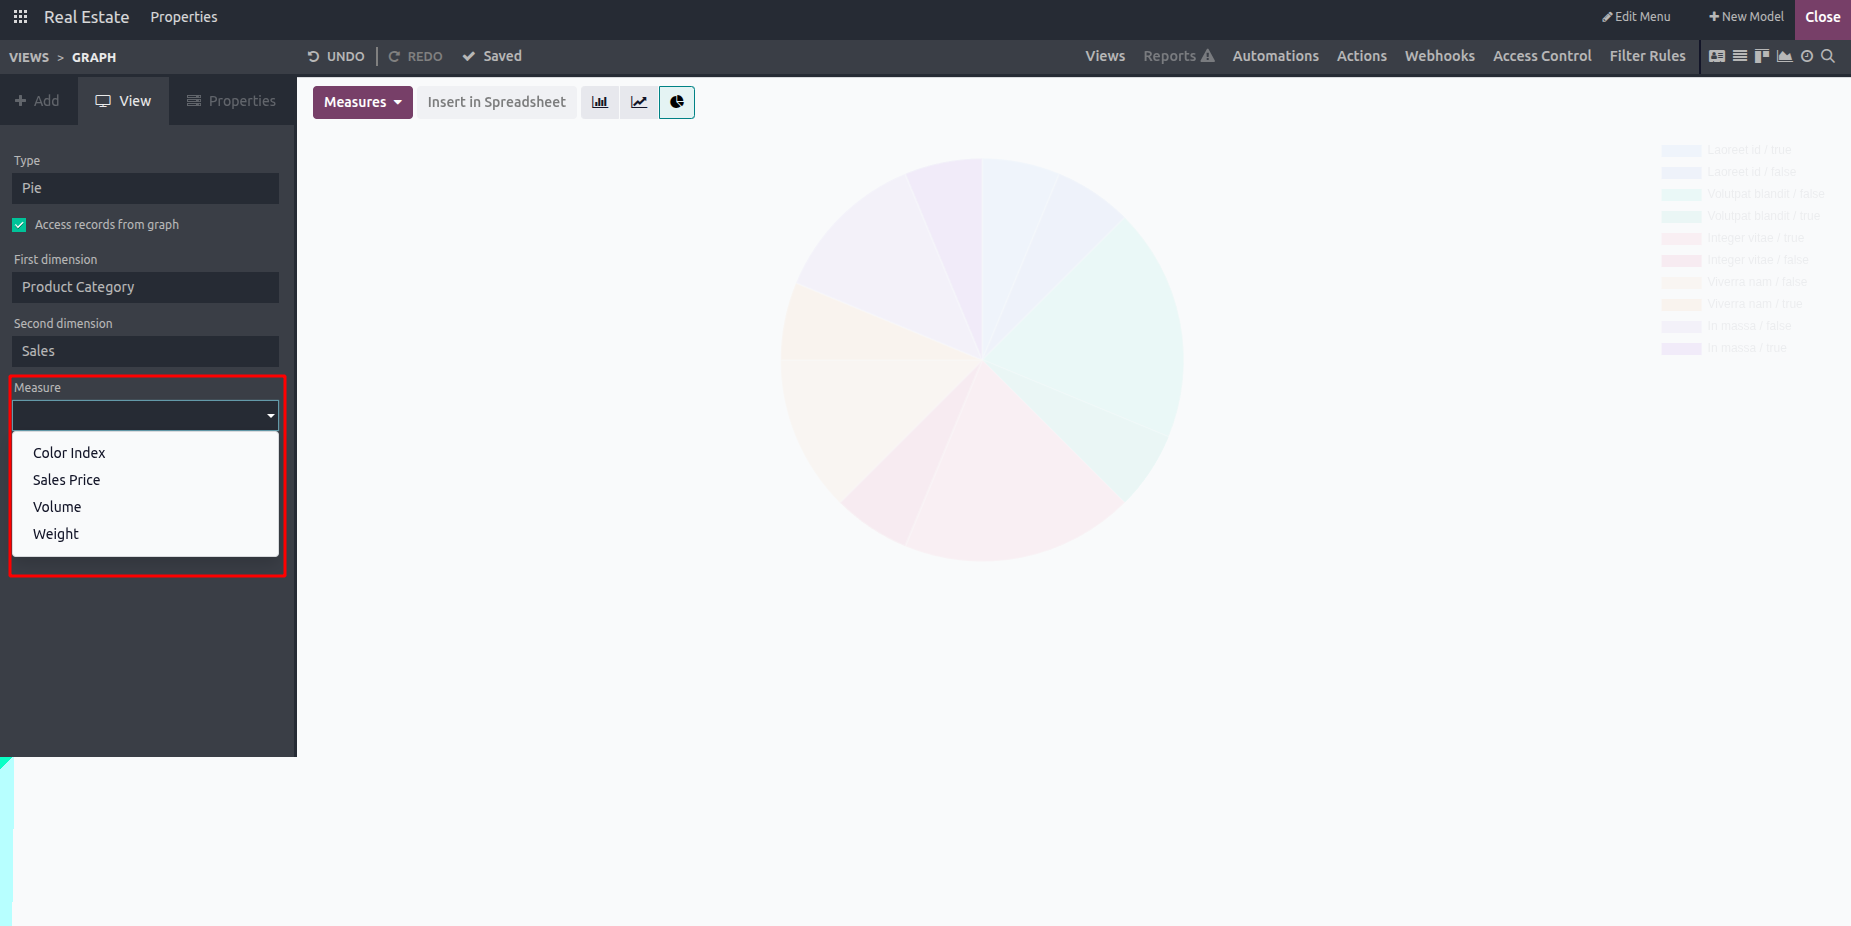
A pie chart is a circular graph that represents data in segments, where each slice corresponds to a percentage or fraction of the whole dataset. To create a pie chart in Odoo 19, access the Studio module and select the model you want to base the chart on.
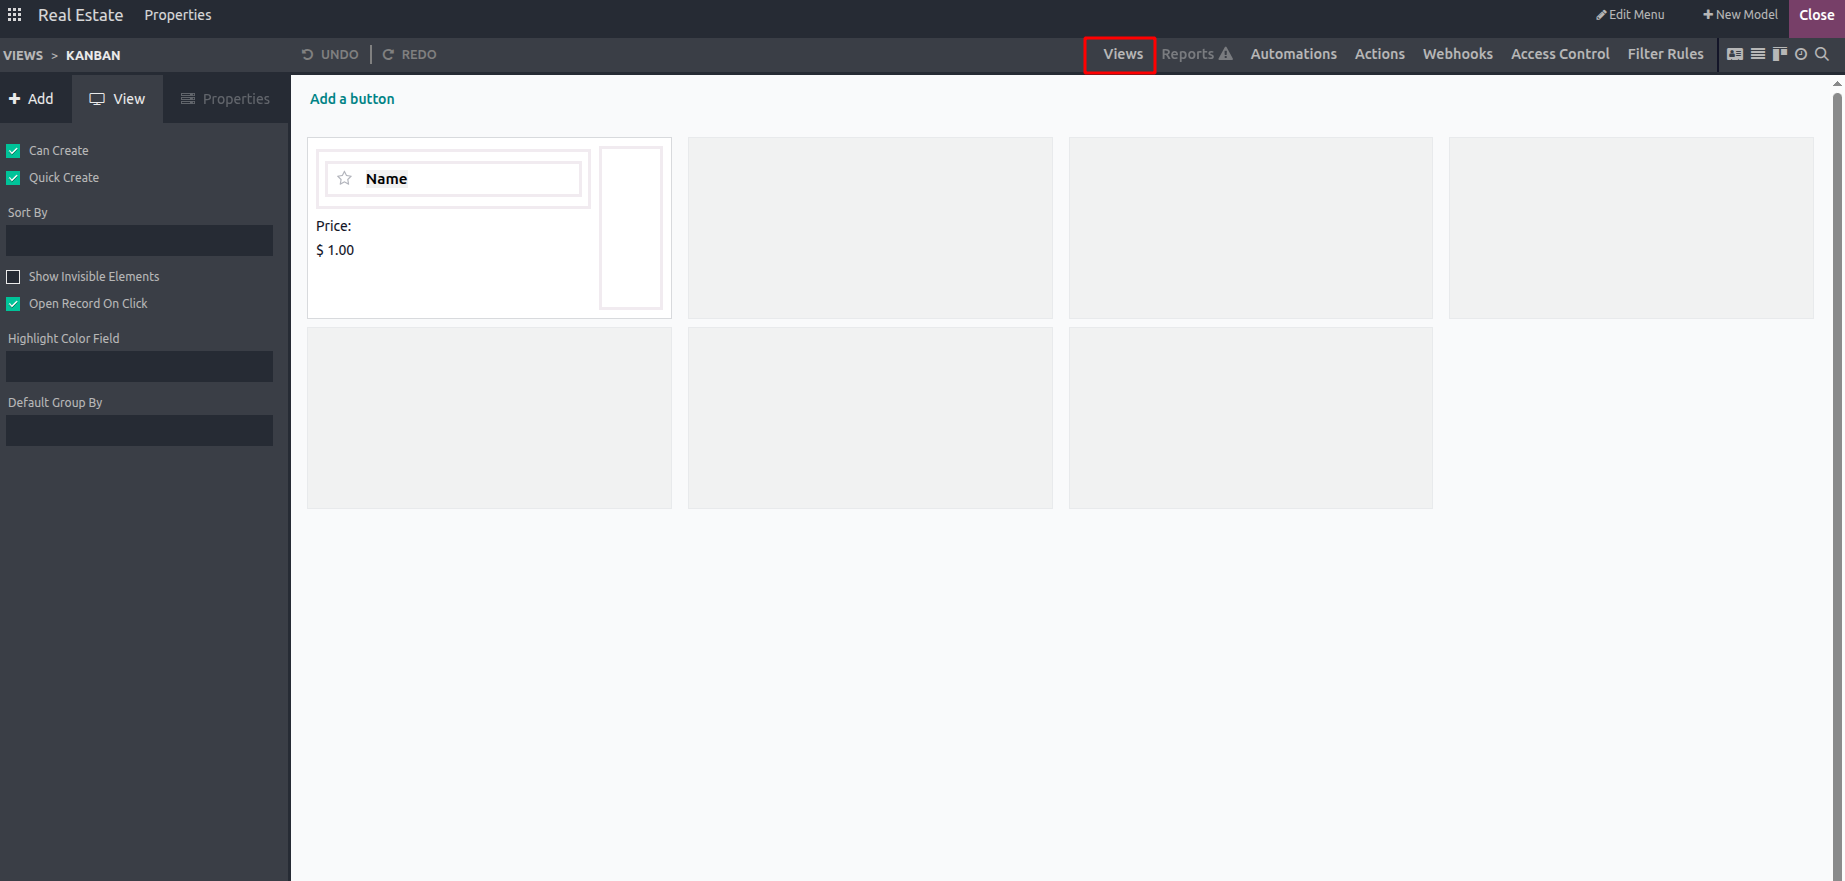
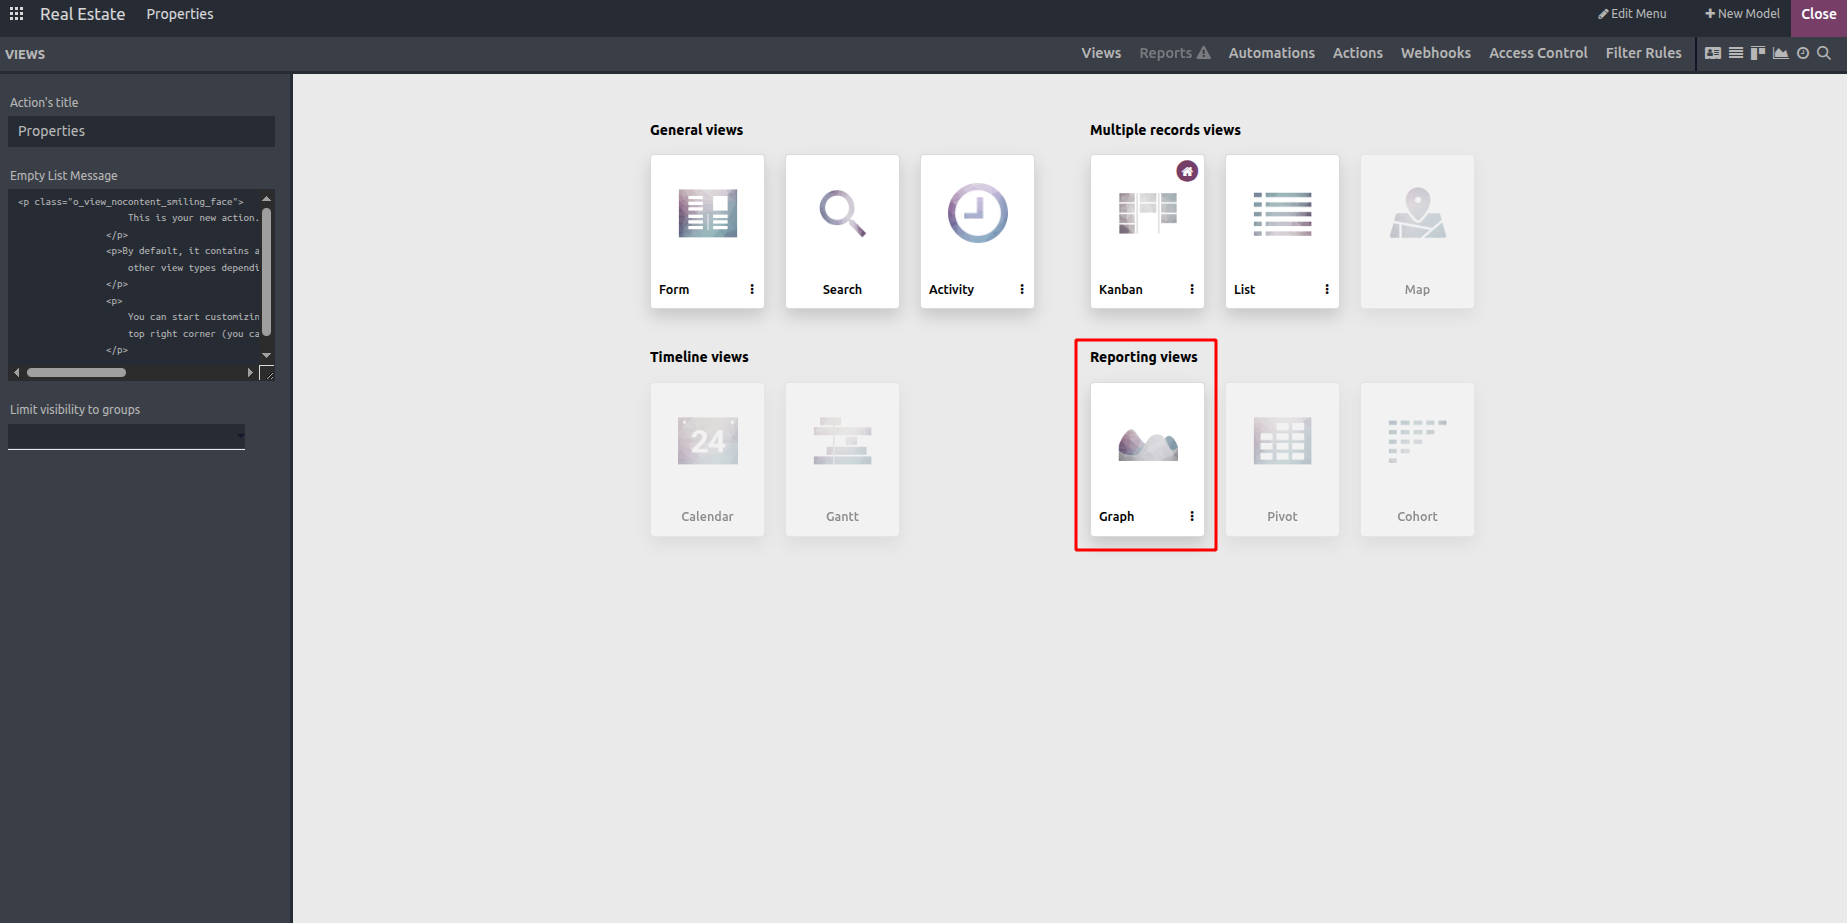
Select "Graph View" from the list of view options after navigating to the Views tab.
We can select "Pie" as the chart type under the View option.
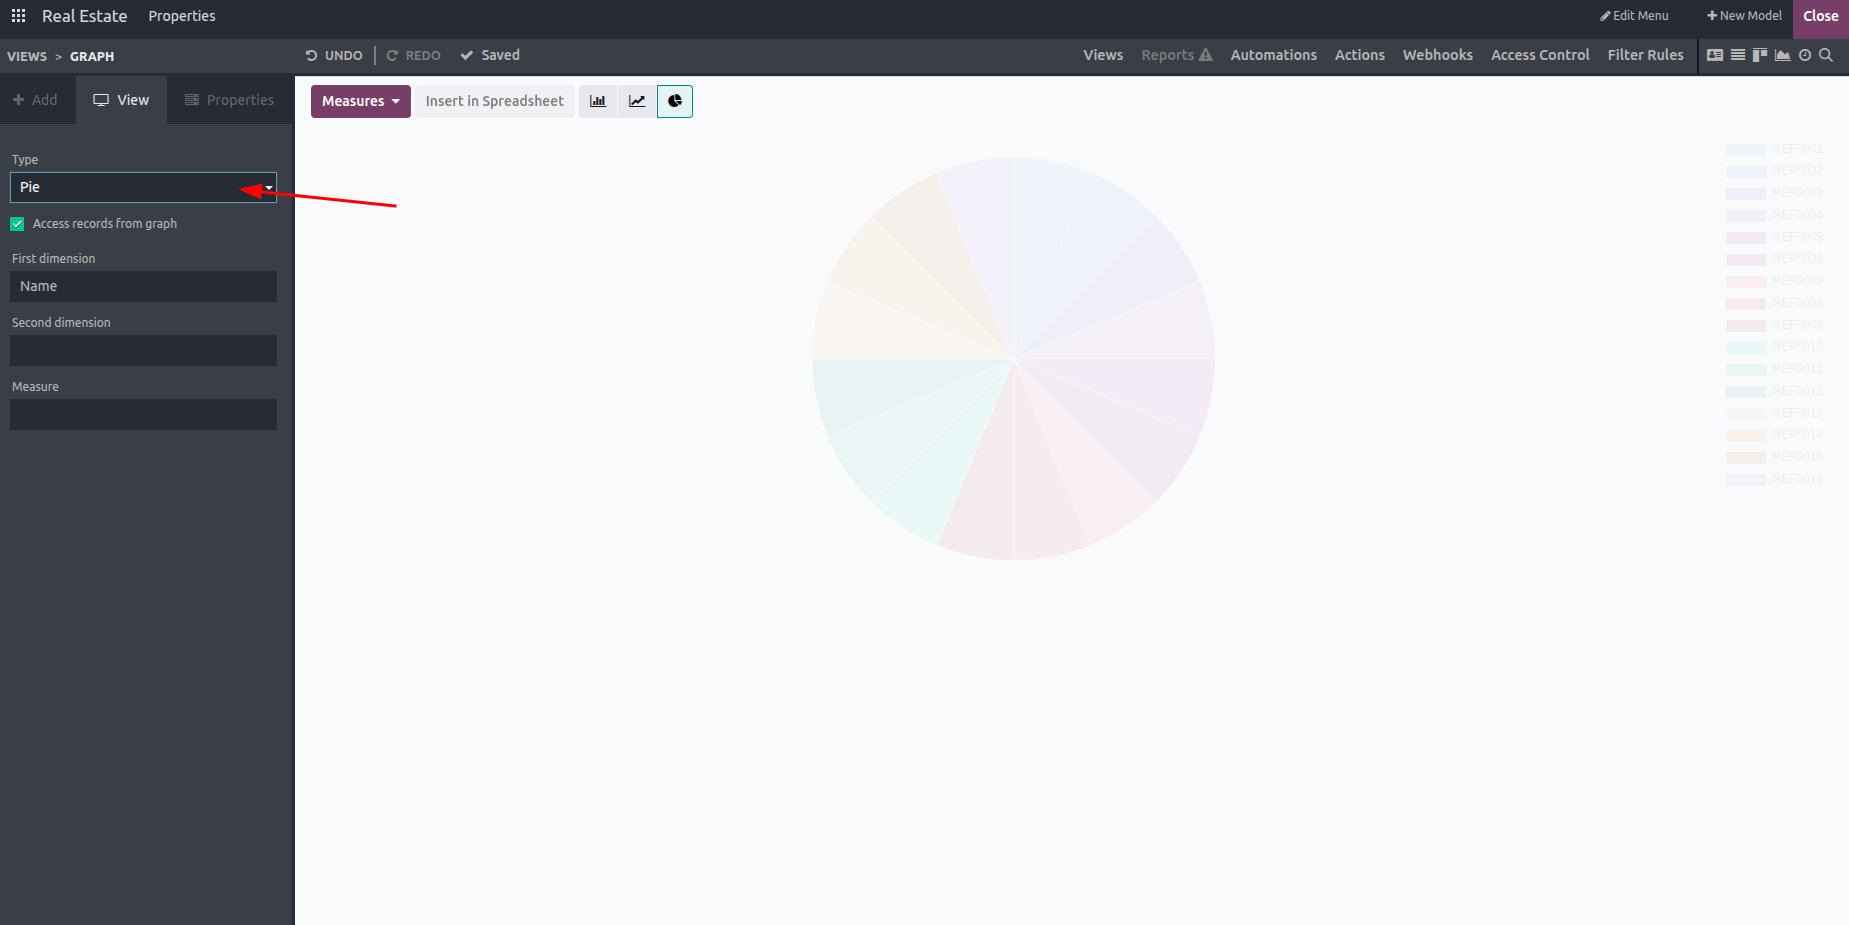
The following choices are available for the user to select from within the display.
- Type
- Access records from graph
- First dimension
- Second dimension
- Measure
The user can view records straight from the pie chart by turning on the "Access records from the graph" option. Additionally, the "First Dimension" and "Second Dimension" settings can be used to define the data dimensions. Select the Measure field to specify the default data type that will be measured in the view. Additionally, the "First Dimension" and "Second Dimension" parameters can be used to determine the data dimensions.
To specify the default data type that will be measured in the view, select the Measure field.