Online Sales Report
By going to the eCommerce module's reporting section, you may see the Online Sales Analysis. An extensive summary of your online sales performance is given by this dashboard.
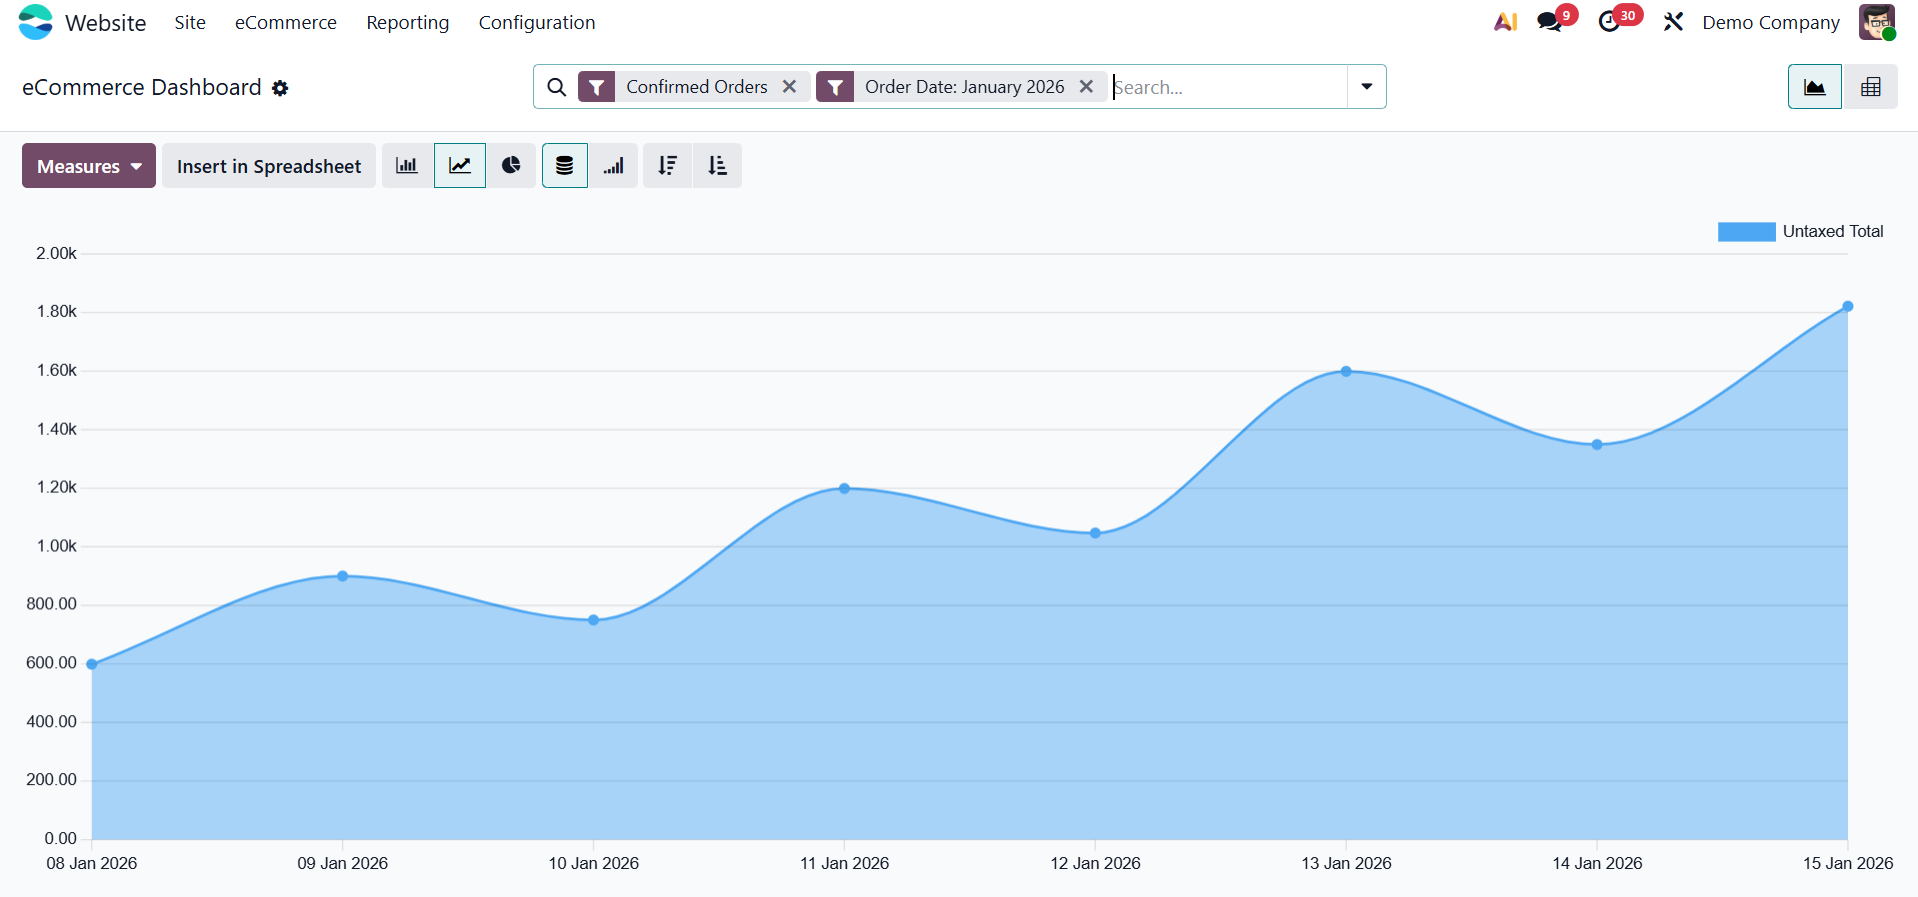
You may quickly switch between these chart layouts and sort data in either ascending or descending order by choosing the relevant icons.
Numerous measurements are available under the measurements tab for use in report analysis.
Available metrics include:
- Number of Lines
- Discount %
- Discount Amount
- Gross Weight
- Quantity Delivered
- Quantity Invoiced
- Quantity Ordered
- Quantity To Deliver
- Quantity To Invoice
- Total
- Untaxed Amount Invoiced
- Untaxed Amount To Invoice
- Untaxed Total
- Volume
These measures provide valuable insights into sales trends, inventory flow, and customer behavior.
Use the Filters tab to refine your data. The default filter options include:
- Confirmed Orders
- Unpaid orders.
- Order date
- Custom filter
For more specific reporting, you can create and apply custom filters using the Add Custom Filter option.
The Group By menu helps you categorize data based on fields such as: Website, Product, Product Category, Customer, Customer Country, Status, eCommerce Category, Order Date, and Custom Group, as shown below.
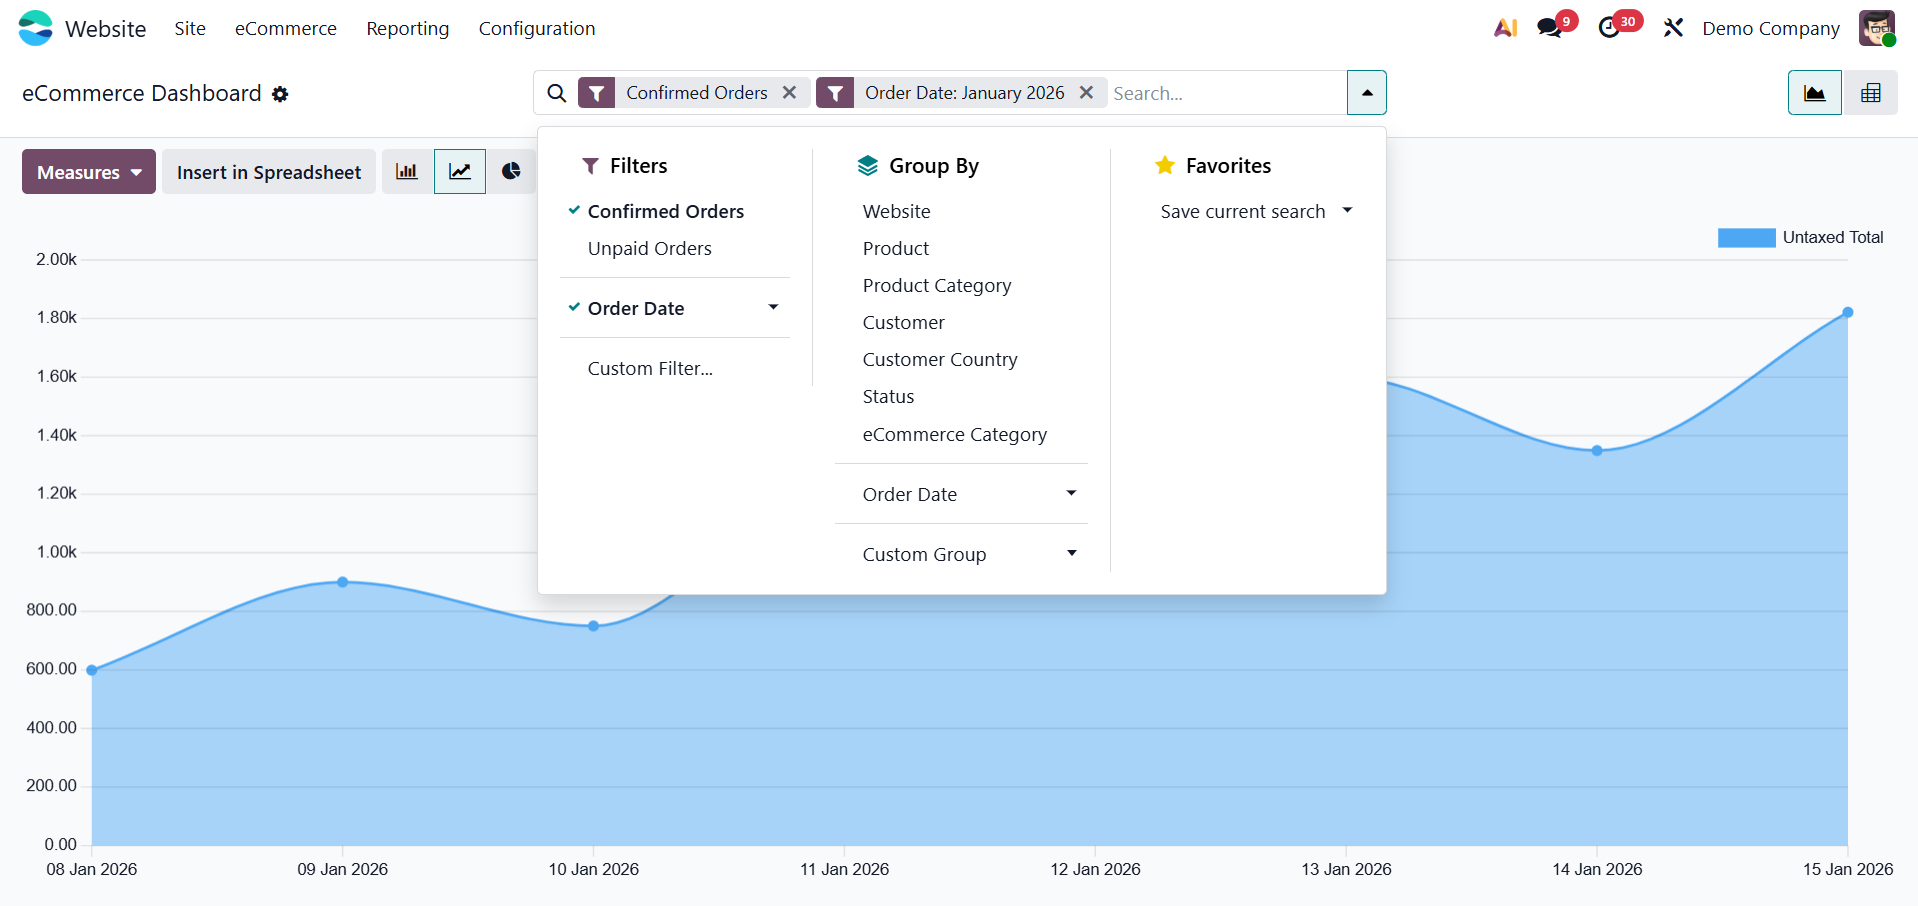
You can do the following under the Favorites tab: Save the current search parameters. And directly enter data into a spreadsheet.
You can easily recover frequently used views with these tools, which also improve report administration.
Click the Pivot icon in the analysis window's upper-right corner to open the Pivot View.
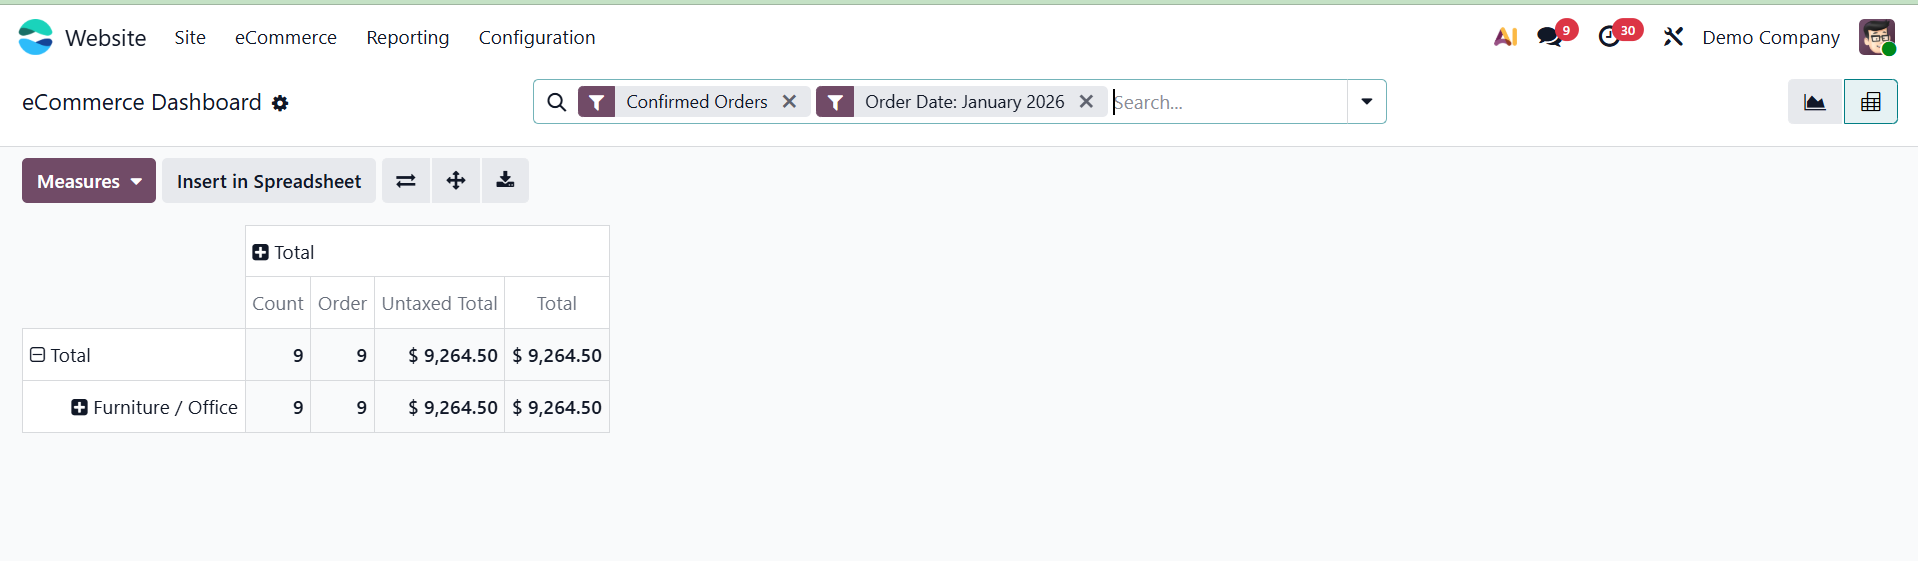
This approach facilitates deep data analysis using numerous dimensions by presenting results in a tabular style. Analyzing and monitoring your online sales has never been simpler thanks to the Odoo 19 eCommerce module's robust reporting features. You can confidently make data-driven decisions with the help of comprehensive pivot reports and real-time visual dashboards.