Reporting
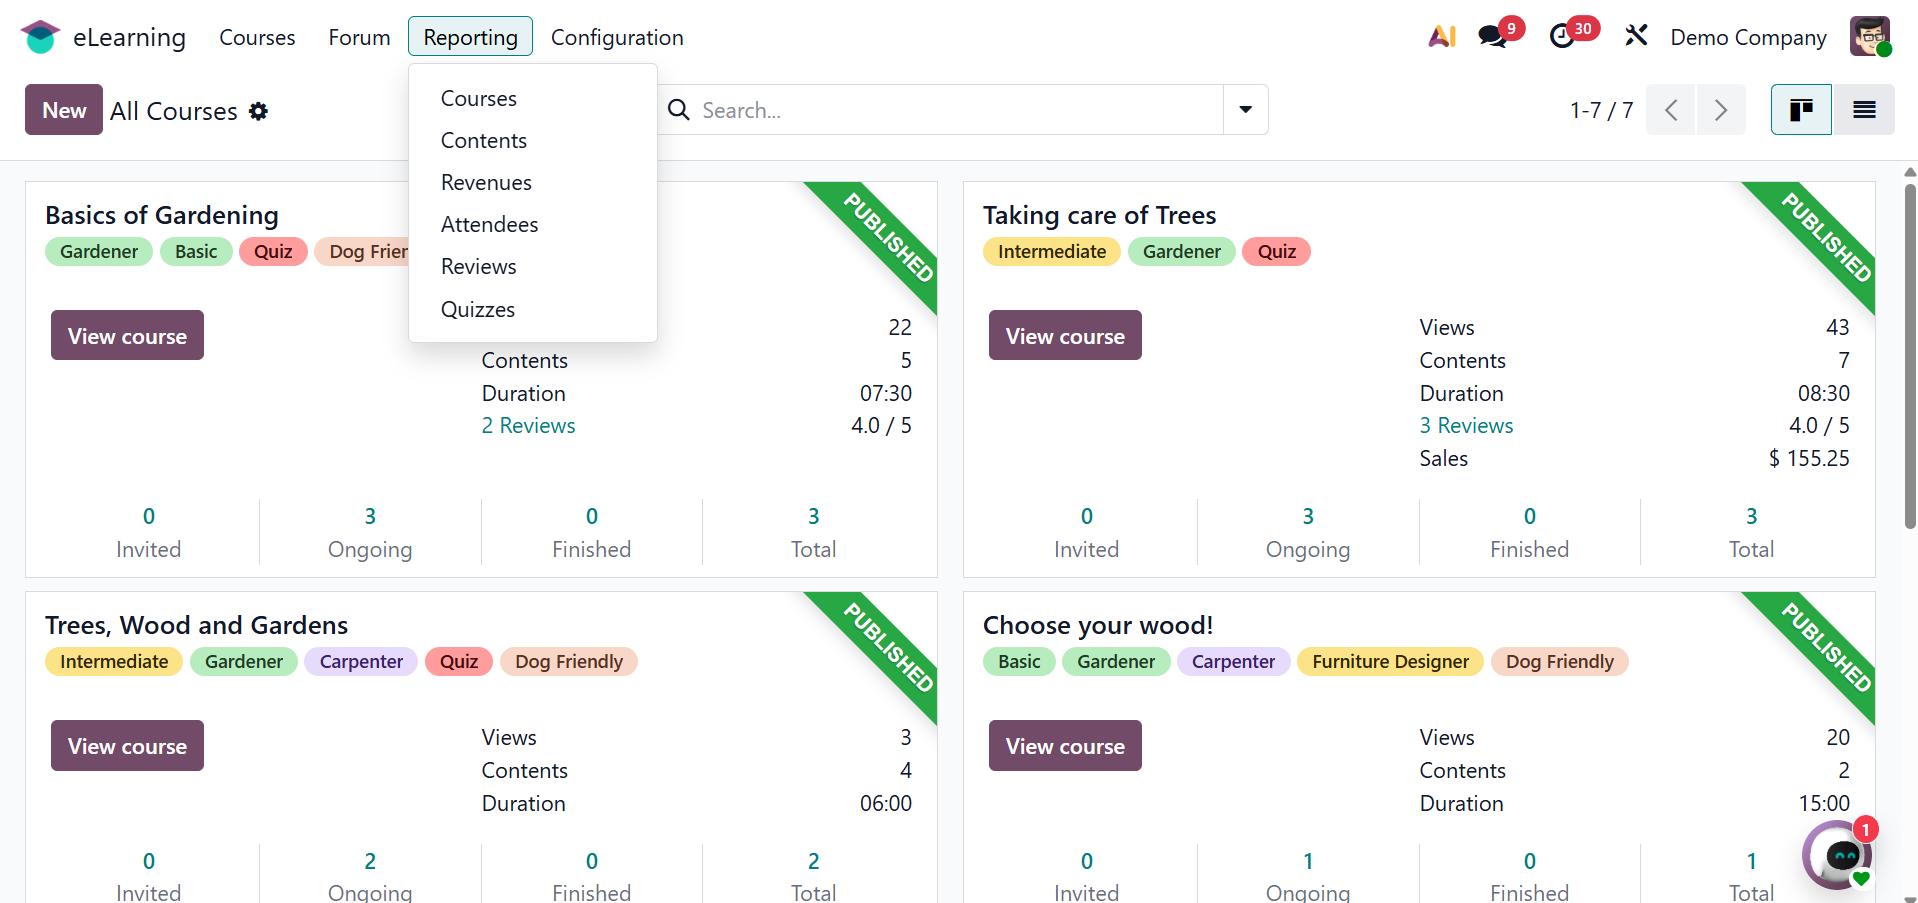
The eLearning module's reporting option makes it easier to assess the eLearning process. There are six distinct reports in the study. The various reports include those on Courses, Contents, Revenues, Attendance, Reviews, and Quizzes.
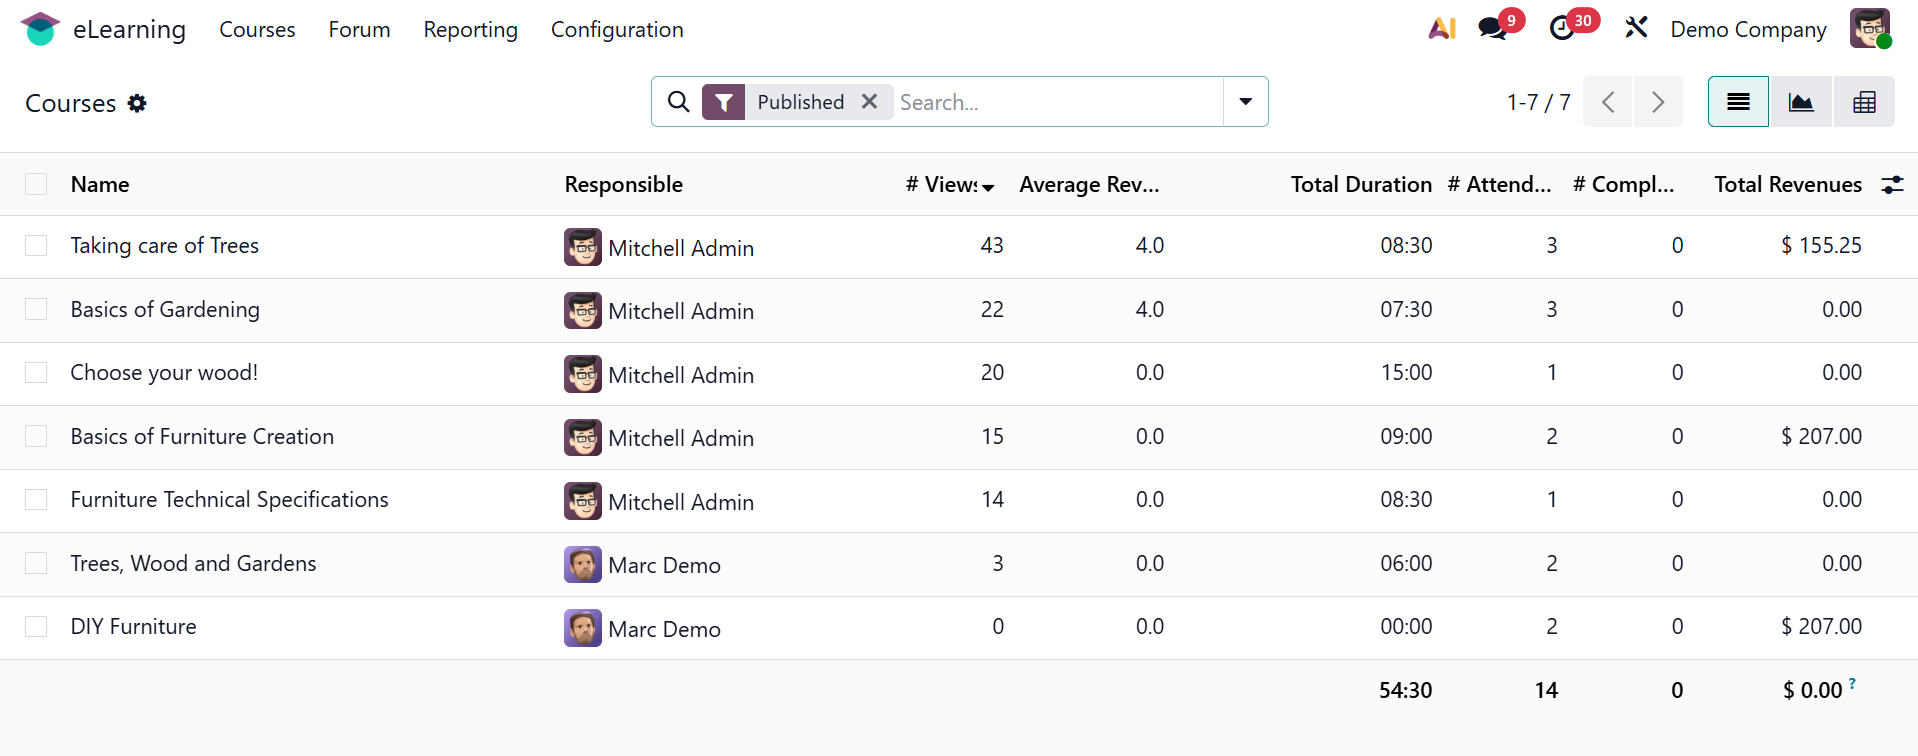
The Courses option shows the course name, responsible person, total views, average views, duration, number of attendees, total revenue, and other course statistics.
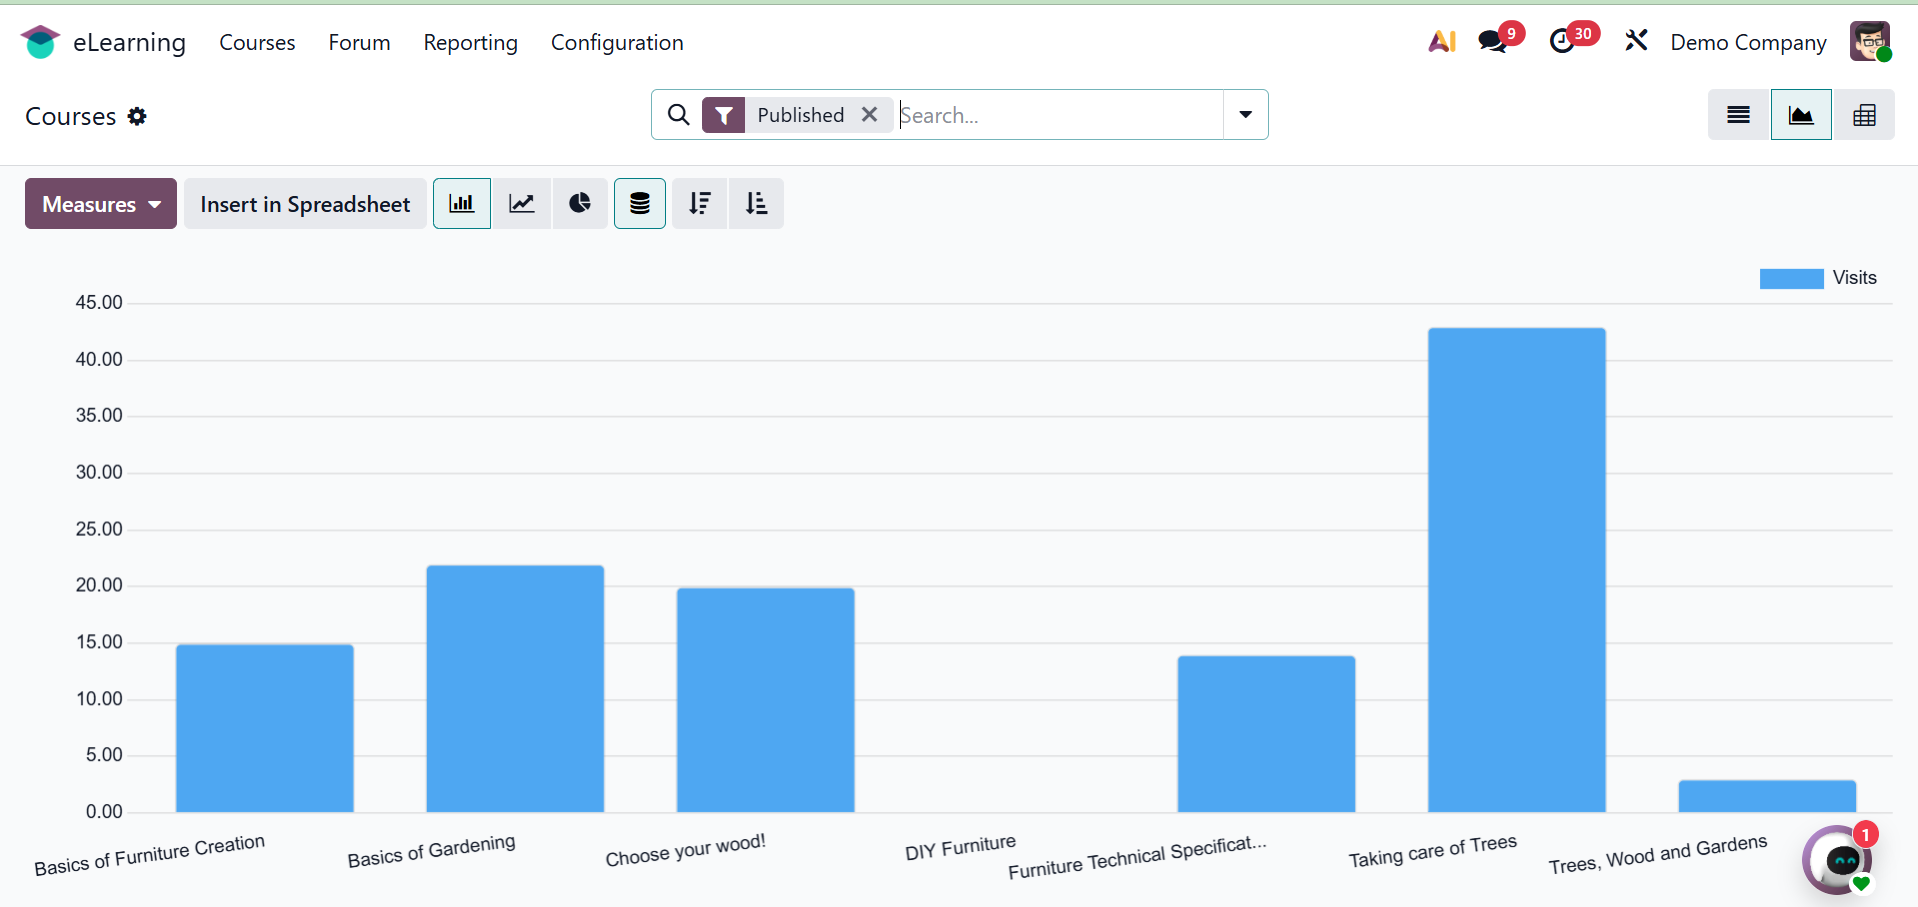
The courses page will be shown graphically as shown in the screenshot below.
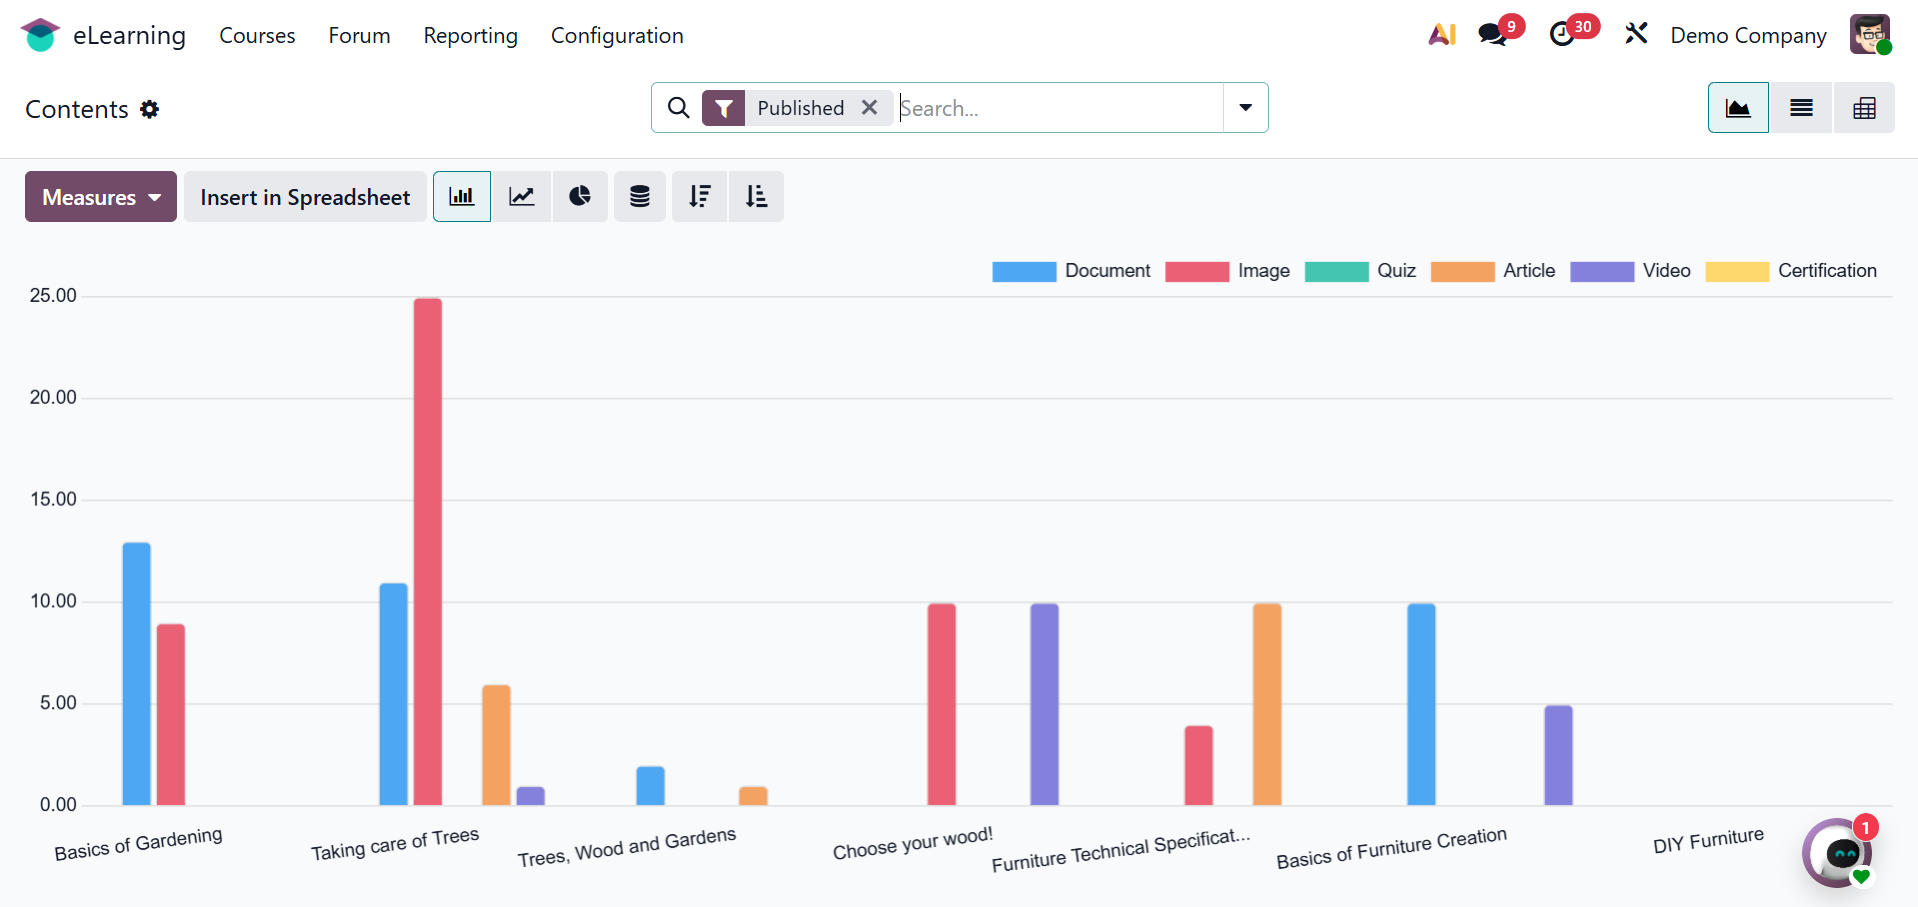
Pie charts, line charts, list view, pivot view, and graph view are just a few of the graph styles available in the Contents report, which provides a graphical representation of the contents. You can filter data based on user needs with the aid of the metrics.
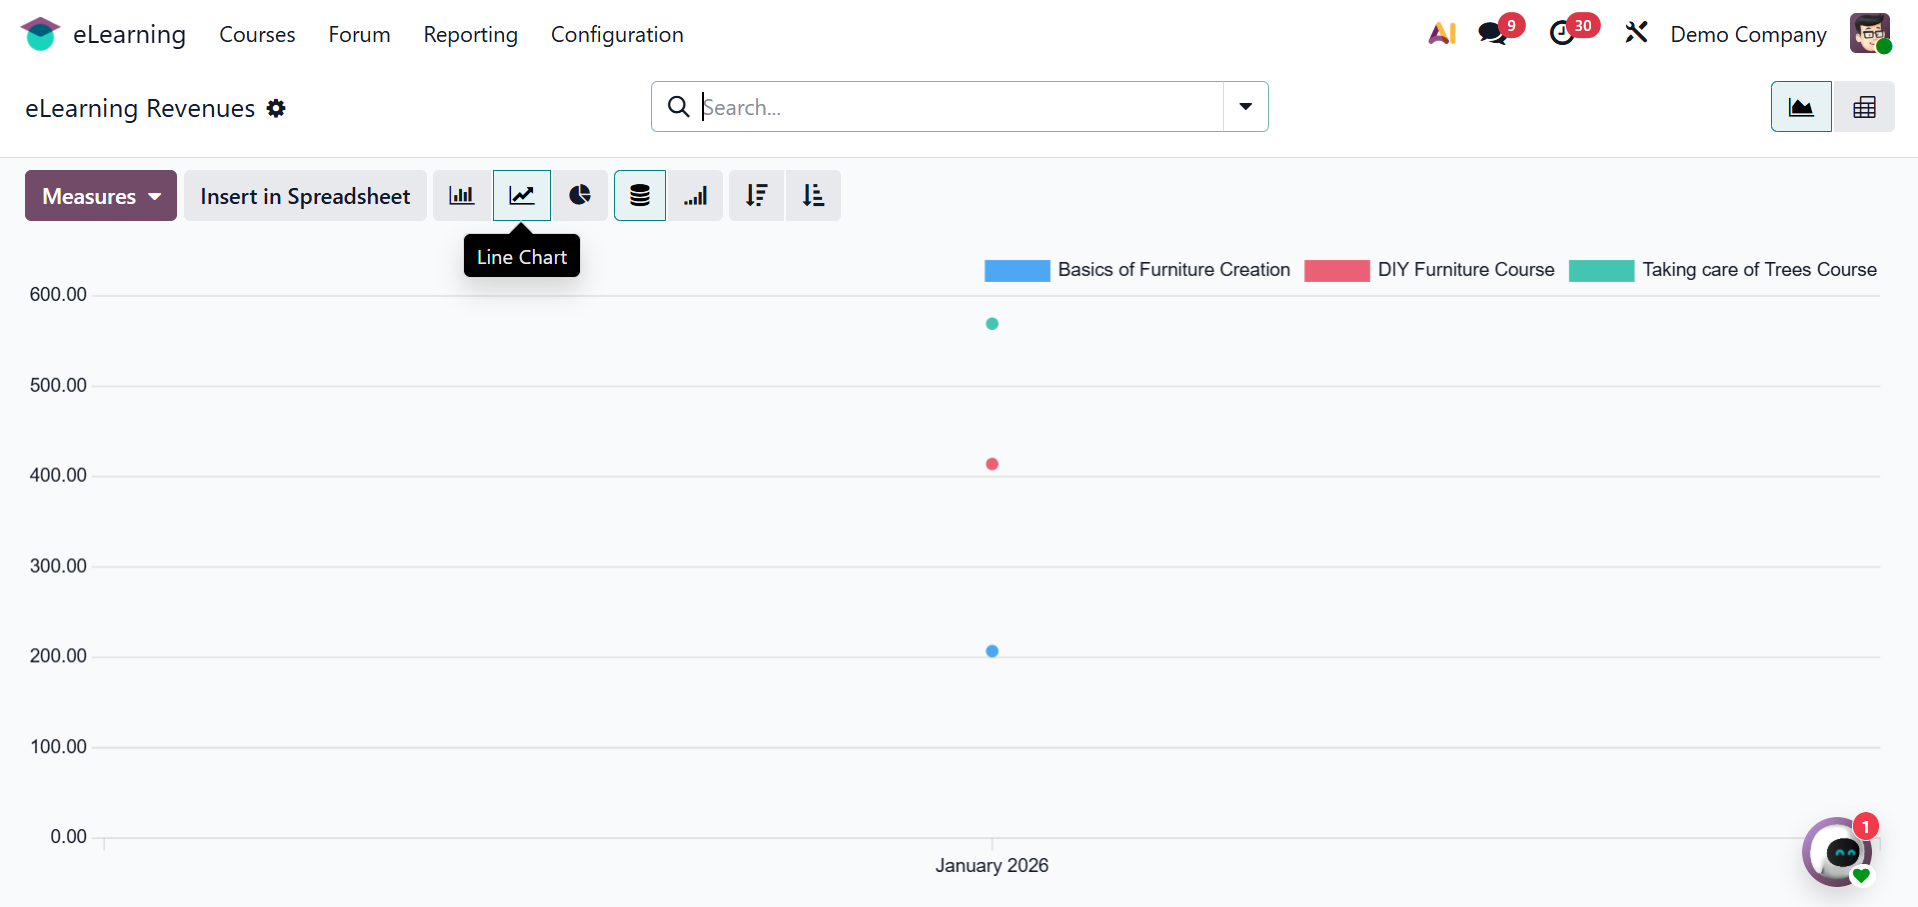
The data for each month is included in the eLearning Revenue reports. This report also includes analytics, filters, and other perspectives.
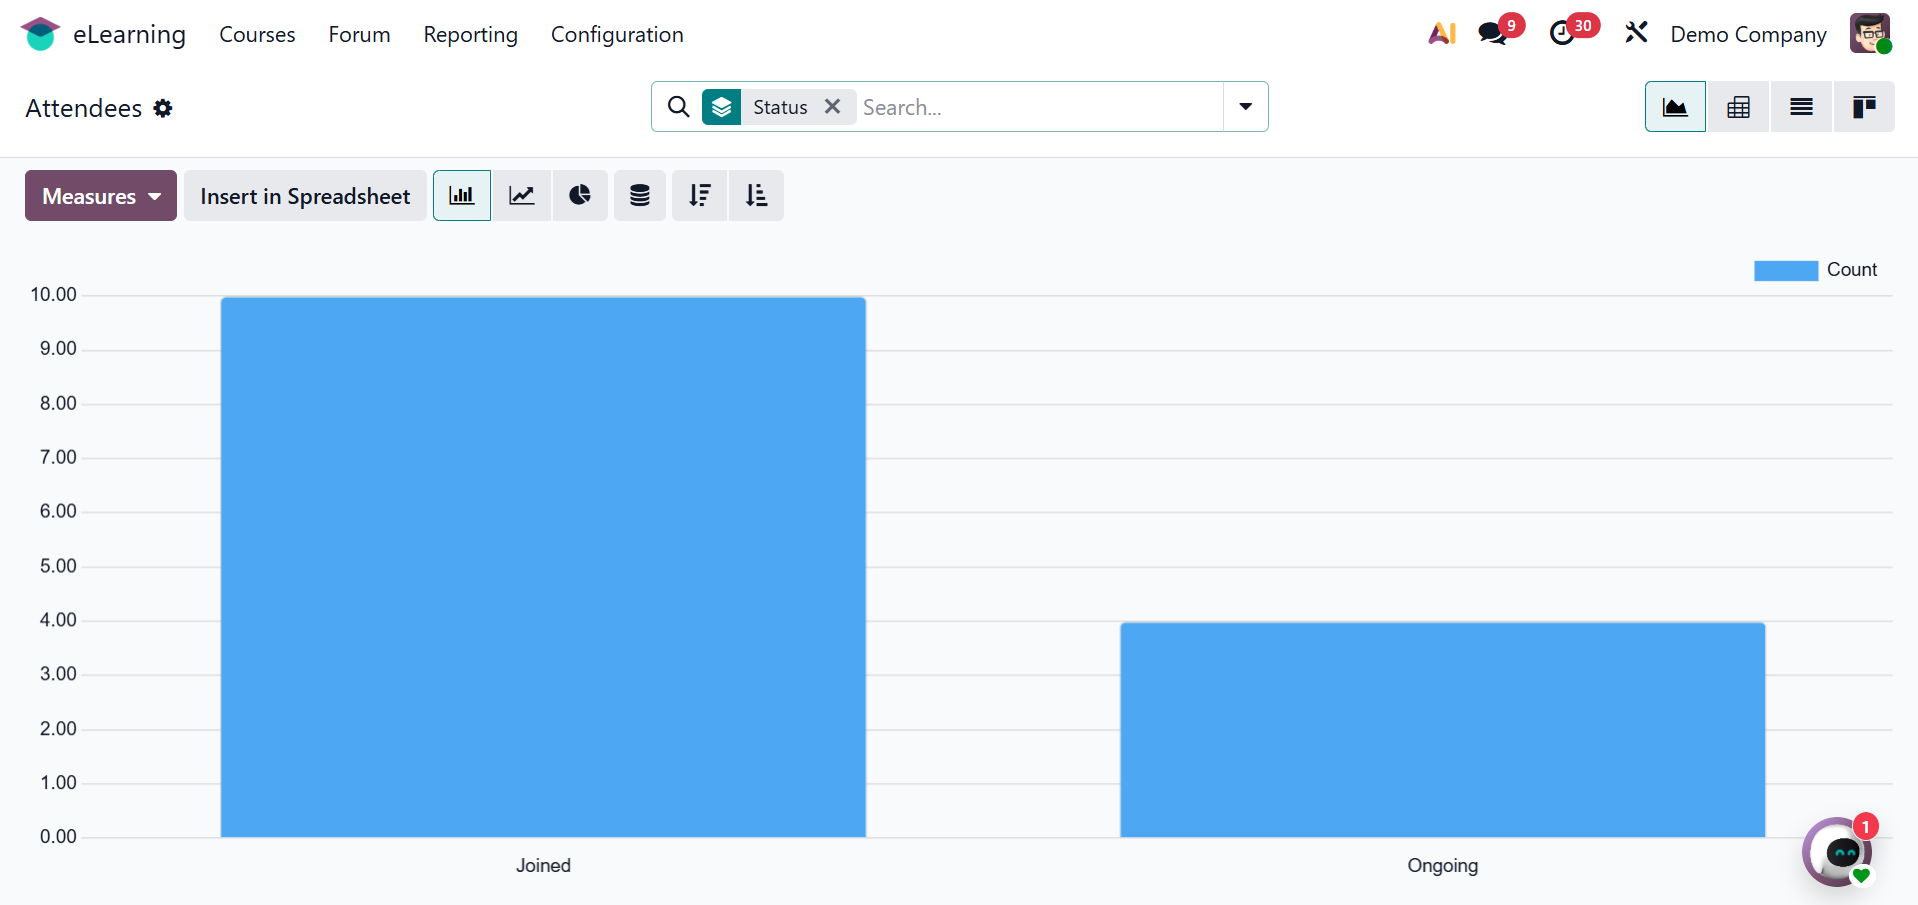
The Attendees report can be used to assess the attendees' status. The image below shows the names of the visitors together with their current details in a graph format.
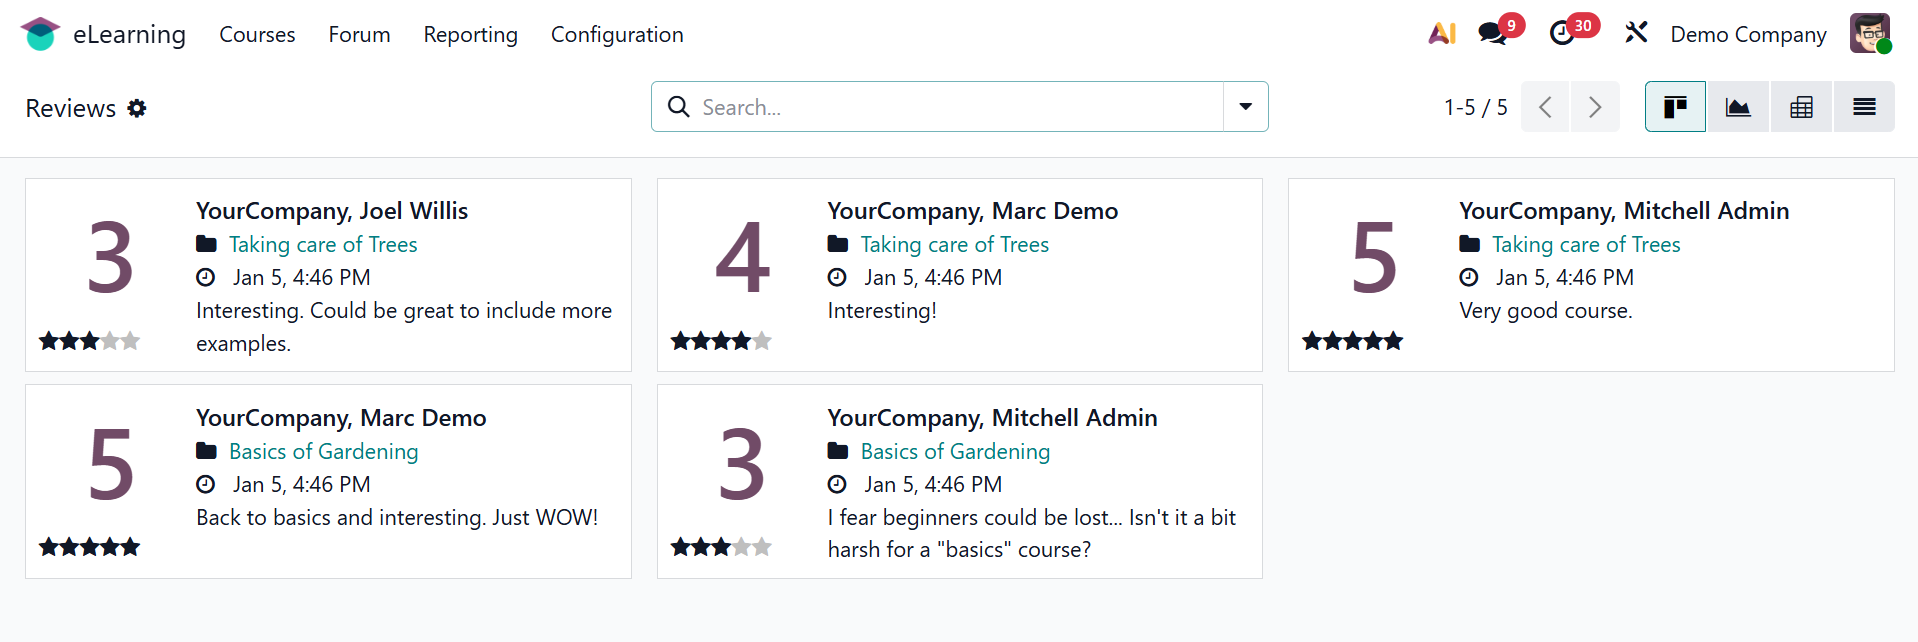
Each course can have reviews added by users, which can then be reviewed via the Reviews report on the back end. The Kanban view shows review details such as the course name, the time and date of submission, the comment, the rating, and so on. Click on each one to view more details.
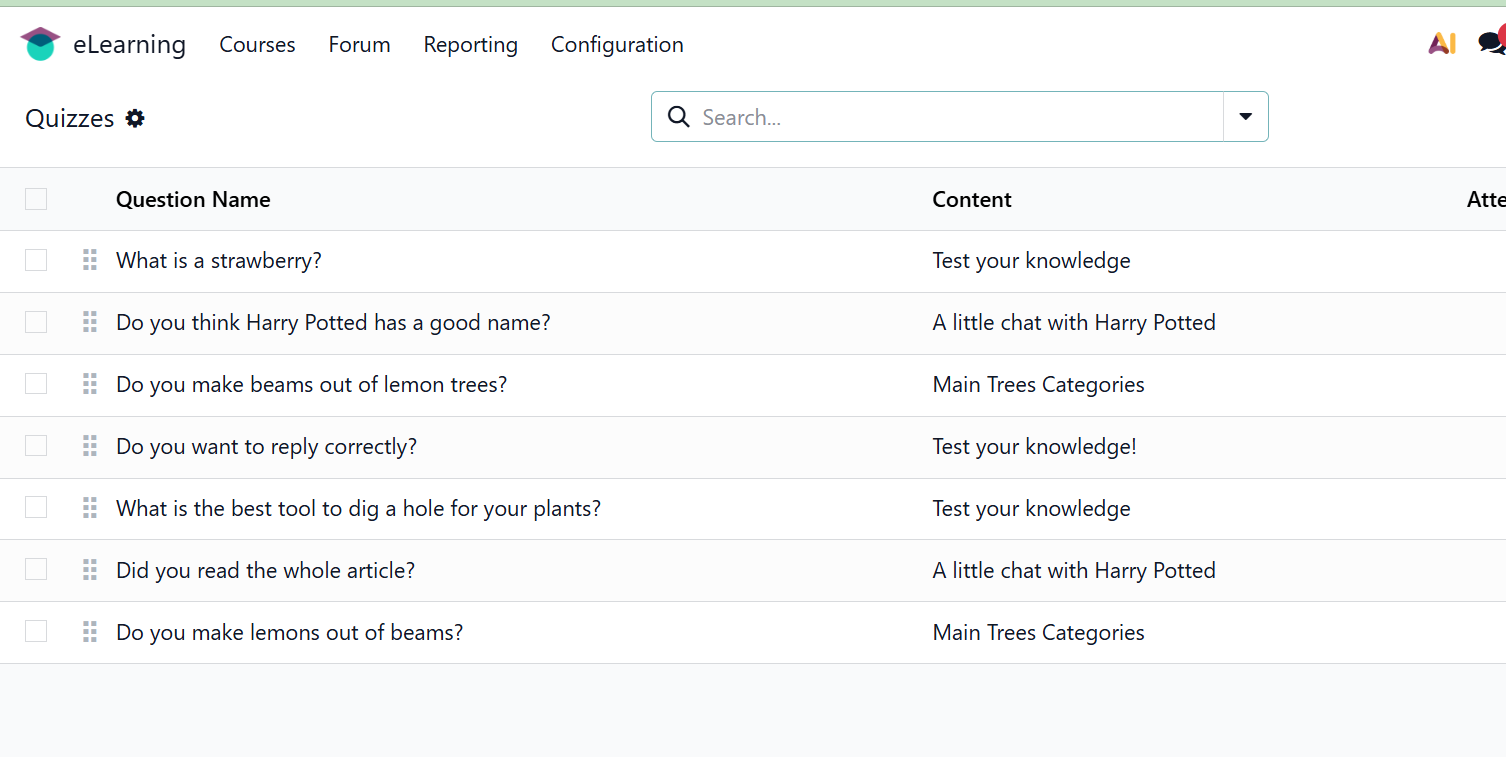
The final kind of reporting is quizzes. The questions in the list view of this report correspond to the total number of attempts, average number of attempts, number of successful efforts, etc.